The Effects of the COVID-19 Pandemic on Teleworking and Education in a Romanian Higher Education Institution: An Internal Stakeholders Perspective ...
←
→
Page content transcription
If your browser does not render page correctly, please read the page content below
International Journal of
               Environmental Research
               and Public Health

Article
The Effects of the COVID-19 Pandemic on Teleworking and
Education in a Romanian Higher Education Institution: An
Internal Stakeholders Perspective
Ştefan-Alexandru Catană 1, * , Sorin-George Toma 1 and Andreea Barbu 2

                                          1   Faculty of Business and Administration, University of Bucharest, 030018 Bucharest, Romania;
                                              tomagsorin62@yahoo.com
                                          2   Faculty of Entrepreneurship, Business Engineering and Management, University Politehnica of Bucharest,
                                              060042 Bucharest, Romania; barbu.andreeab@yahoo.com
                                          *   Correspondence: stefan.catana@faa.unibuc.ro

                                          Abstract: The COVID-19 pandemic has created the conditions for the expansion of teleworking (TW)
                                          in numerous sectors and organizations, and higher education institutions (HEIs) have had to adapt to
                                          this context. This paper aims to identify and analyze five factors (technology, individual involvement
                                          and skills, physical inactivity, psychological well-being, and household activities) that influence
                                          the effort and results in TW and education (E) in HEIs from the perspective of their key internal
                                          stakeholders. The data were gathered by a mix of qualitative and quantitative research methods, such
                                as interviews and surveys. They were analyzed and interpreted through factorial analysis that uses

                                          the presentation of the main components as an extraction method, with the Varimax rotation method
Citation: Catană, Ş.-A.; Toma, S.-G.;   adopting Kaiser normalization, and processed with SPSS statistical software. This study shows
Barbu, A. The Effects of the
                                          that the effort and results of the key internal stakeholders of HEIs are influenced by the five factors.
COVID-19 Pandemic on Teleworking
                                          In this respect, students’ results are negatively influenced by technology and physical inactivity
and Education in a Romanian Higher
                                          factors. Moreover, the efforts of auxiliary and non-teaching staff are highly positively influenced
Education Institution: An Internal
                                          by the psychological well-being factor and their results are positively influenced by the individual
Stakeholders Perspective. Int. J.
Environ. Res. Public Health 2021, 18,
                                          involvement and skills factor and negatively influenced by the household activities factor.
8180. https://doi.org/10.3390/
ijerph18158180                            Keywords: teleworking; education; higher education institution; internal stakeholders; well-being;
                                          physical inactivity; household activities; Faculty of Business and Administration
Academic Editors: Lucian-Ionel Cioca
and Diana Popa-Andrei

Received: 27 June 2021                    1. Introduction
Accepted: 31 July 2021
                                               Last year brought exceptional changes and unprecedented challenges not only to the
Published: 2 August 2021
                                          global economy, but also to human civilization. March 2020 will remain a turning point
                                          in the history of humanity as numerous and severe nationwide lockdowns have entered
Publisher’s Note: MDPI stays neutral
                                          into force around the world since the emergence of the COVID-19 pandemic. A huge
with regard to jurisdictional claims in
                                          number of organizations worldwide (e.g., multinational and transnational corporations,
published maps and institutional affil-
                                          small and medium enterprises, public institutions) have started to send their employees
iations.
                                          home, and therefore created the conditions for the expansion of a widespread phenomenon
                                          called TW, known also as work-for-home, remote work, home-office, home-based work,
                                          telecommuting, or smart-working [1–3].
                                               The increasing use of digitalization and the diffusion of the disruptive and rapid
Copyright: © 2021 by the authors.         advances in information and communication technologies have highly facilitated the imple-
Licensee MDPI, Basel, Switzerland.
                                          mentation of TW in numerous sectors, such as public administration, insurance, banking,
This article is an open access article
                                          or higher education, and contributed to the flexibilization of the labor market [4–6]. In
distributed under the terms and
                                          essence, they have led to the birth of new types of organizations and working methods and
conditions of the Creative Commons
                                          revolutionized the deployment of the working processes (e.g., virtual teams). Information
Attribution (CC BY) license (https://
                                          and communication technologies enable work tasks to be accomplished not only more
creativecommons.org/licenses/by/
4.0/).
                                          quickly and consistently with lower efforts, but also at distance. TW consequently involves

Int. J. Environ. Res. Public Health 2021, 18, 8180. https://doi.org/10.3390/ijerph18158180                    https://www.mdpi.com/journal/ijerph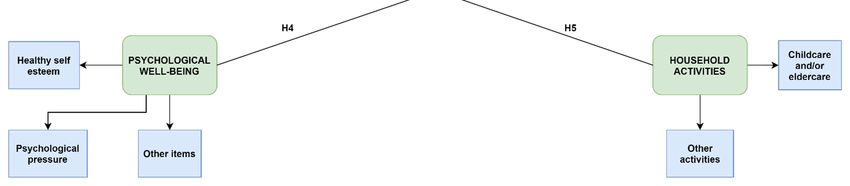
Int. J. Environ. Res. Public Health 2021, 18, 8180                                                                                2 of 17

                                        work undertaken using information and communication technologies and carried on out-
                                        side the specific workplace. It is worth emphasizing that TW has mostly been the advantage
                                        of well-paid employees [7] and is traditionally found in high-skilled, white-collar jobs [8].
                                              The idea of TW was introduced by Jack Nilles (1975) to name a relatively new mode
                                        of alternative work arrangements and it widely spread primarily at the beginning of the
                                        21st century as a new form of labor organization that could provide a solution to many
                                        individual, social, and organizational problems [9–11]. Although there is no internationally
                                        recognized definition, telework is considered as using “information and communication
                                        technologies, such as smartphones, tablets, laptops and/or desktop computers, for work
                                        that is performed outside the employer’s premises” [4] (p. 1). In essence, telework has
                                        two main characteristics: involves performing a professional activity remotely—from
                                        home or another location—using information and communication technologies [8] and is
                                        restricted to employees only [12]. The focused literature analyzed TW from a wide variety
                                        of viewpoints (e.g., individual, organization, society), revealing both its advantages and
                                        disadvantages [11]. For decades, working from home, a form of TW, has been promoted as
                                        one of the management policies that bring benefits such as cost savings [13], work flexibility,
                                        time-planning skills [14], reduced employee’s turnover [15], less absenteeism [15], reduc-
                                        tions in office space requirements [16], better work–life balance, higher work autonomy and
                                        morale [17], retrieve of temporal and spatial constraints in daily activities schedules [18,19],
                                        the potential to harmonize the different facets of people’s lives, permitting space and time
                                        management [20,21], improved productivity, and reduced informal communication [22].
                                        For example, work flexibility allows teleworkers to address various personal and/or family
                                        needs, such as healthcare, eldercare, or childcare. However, other authors reveal the nega-
                                        tive impact of TW as follows: overloading with work [11,23,24], connectivity problems [25],
                                        physical inactivity [26], psychological stress from technology dependency [27–29], lack
                                        of supervisors’ physical control over the employees [30], possible lack of trust between
                                        managers and their subordinates [30], low level of interaction between employees and their
                                        colleagues [31], work-related problems invading personal life [32,33], social isolation [34],
                                        various health complications (e.g., cardiovascular disease, cholesterol increase) [35], and
                                        the techno-insecurity of data [29,36].
                                              As the COVID-19 pandemic has dramatically affected and is still affecting the global
                                        higher education system, TW has become one of the most popular responses to this out-
                                        break as educational services and scientific research can be reasonably performed at home
                                        or online [37–39]. In this respect, more than 40% of teachers from the European Union used
                                        telework in 2018, one of the highest prevalence within the knowledge and information and
                                        communication technologies-intensive sectors [40]. However, educational services remain
                                        open to both home-based work and face-to-face activities as work flexibility increases
                                        engagement and job satisfaction, and improves the well-being of the workers [41–43]. As a
                                        broad and multifaceted concept, well-being is defined as “the balance point between an
                                        individual’s resource pool and the challenges faced” [44] (p. 230). It is linked with similar
                                        other concepts (e.g., happiness, contentment, wellness), expresses the positive feelings
                                        experienced by someone, and encompasses several types such as psychological or social
                                        well-being [45,46]. For example, there is a positive and significant relationship between
                                        psychological well-being and self-esteem [47].
                                              Education is defined as the act or process of imparting or acquiring general knowl-
                                        edge, developing the powers of reasoning and judgment, and generally of preparing
                                        oneself or others intellectually for mature life [48]. For individuals, education may provide
                                        employment, earnings, health, and poverty reduction [49]. Education is also linked to
                                        the improvement of public health, allows for nourishing psychosocial environments that
                                        support human development (e.g., sense of control and social support), work (e.g., working
                                        conditions and income), and helps to foster health knowledge and behaviors [50,51].
                                              HEI is a term used in Europe to designate organizations providing higher, postsec-
                                        ondary, tertiary, and/or third-level E [52]. A university represents both a higher education
                                        learning, teaching, and researching institution and a community of stakeholders (e.g.,
Int. J. Environ. Res. Public Health 2021, 18, 8180 3 of 17
teachers, researchers, students, auxiliary and non-teaching staff). The relationships with
its stakeholders highly influence the success of a HEI. Stakeholders are defined as all
those organizations, networks, and private people that are able to influence the objectives
of a given organization [53,54]. For a HEI, stakeholders include a plethora of elements
participating and/or benefiting from the provision of educational services such as teachers,
students, parents, companies, or society. HEIs classify stakeholders as either internal or
external [55]. Internal stakeholders are the rector, the deans, teachers, students, faculty
representatives, as well as auxiliary and non-teaching staff, whereas external stakeholders
comprise partners and customers [56].
In HEIs, e-learning has turned into an alternative to traditional face-to-face education
systems for those persons that want to study, but have to go through a distance to university,
or need more flexibility for different reasons [57]. Moreover, studies have shown that TW in
academia has been developed over the last two decades and it does not exclude face-to-face
activities that could be combined with the traditional way of teaching thus forming blended
learning [58]. In Romania, the crisis generated by the COVID-19 pandemic made TW not
only an option, but also a necessity for continuing the educational process in HEIs [59].
As a result, online education delivery continues to develop rapidly and expand widely,
gaining support across all educational sectors [60,61].
Recent researches have investigated how internal stakeholders in the higher education
sector are affected by TW. In a comparison study between academic teleworkers and
non-teleworkers, Tustin [62] found that academics appreciate TW and their students are
more satisfied with academic support from telecommuters than non-telecommuters. Other
studies considered that teleworkers felt social and psychological well-being [17]. They are
more productive, more satisfied with their work, and less stressed compared with work
at the office [63]. Although non-teaching staff appreciated the life satisfaction and the
possibility of managing a family and doing their home stuff alongside their work, they
reported that it is difficult to set properly the work and leisure time [64].
The above considerations show that there is a close relationship between internal
stakeholders, TW, and E in HEIs. Firstly, the studies carried on in this field revealed a high
level of satisfaction from teachers, students, and auxiliary and non-teaching staff towards
TW and online E [52–54], thus being mutually beneficial to the stakeholders. Secondly, these
concepts focus on the economic, technological, social, and human dimensions, and TW is
specific to employees. Thirdly, both internal stakeholders and TW activities contribute to
the development of HEIs [65].
Based on the theoretical framework previously displayed, two principal research
objectives were set up:
Objective 1 (O1). To identify and analyze some of the main factors that influence TW and E
in HEIs.
Objective 2 (O2). To present the perspective of the key internal stakeholders of HEIs on these factors.
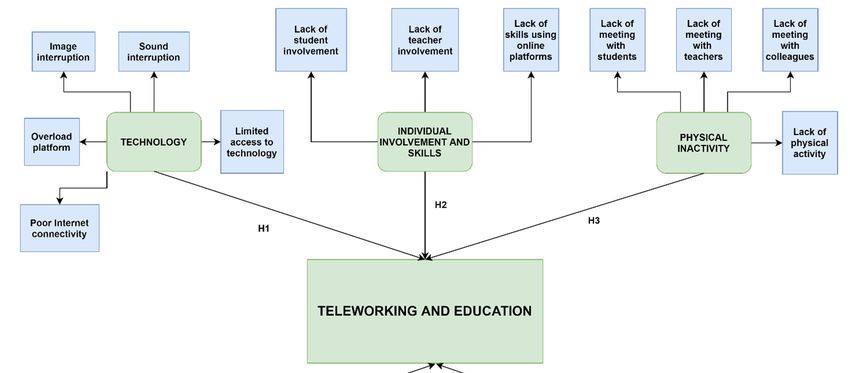
The authors have designed and empirically tested a theoretical model to explain the
influence of five factors (technology, individual involvement and skills, physical inactivity,
psychological well-being, and household activities) on TW and E in HEI (Figure 1). Each
factor is defined through a different number of items. As processes, TW and E involve the
existence of inputs (effort) and outputs (results). Therefore, the dependent variables are the
effort and results of the key internal stakeholders (students, teachers, and auxiliary and
non-teaching staff) during TW and E in HEIs and the independent variables are the five
factors previously mentioned. This study addresses the context in which TW is related to
teachers and auxiliary and non-teaching staff, while E is related to students and teachers.variables are the effort and results of the key internal stakeholders (students, teachers, and
auxiliary and non-teaching staff) during TW and E in HEIs and the independent variables
Int. J. Environ. Res. Public Health 2021,are the five factors previously mentioned. This study addresses the context in which4 of
18, 8180 TW17
is related to teachers and auxiliary and non-teaching staff, while E is related to students
and teachers.
Figure
Figure 1.
1. Research
Research model.
model.
This
This research
research attempts
attempts to measure the influence, either positive or negative, of the
five independent
five independent variables on the effort and results of the the key
key internal
internal stakeholders
stakeholders during
their activities
their activities in the academic environment. In
In this respect, the authors used statistical
tools such
tools such as the Varimax rotation method with Kaiser normalization, Cronbach’s Alpha
coefficient, t-test, Levene’s Test, and Pearson
coefficient, Pearson coefficients.
coefficients.
Starting from
Starting fromthethe
above objectives,
above the following
objectives, six research
the following hypotheseshypotheses
six research were formulated:
were
formulated:
Hypothesis 1 (H1). Technology factor negatively influences the internal stakeholders’ results in
TW and E in HEIs.
Hypothesis 1 (H1). Technology factor negatively influences the internal stakeholders’
results in TW and E in HEIs.
Hypothesis 2 (H2). Individual involvement and skills factor positively influences the internal
stakeholders’ results
Hypothesis 2 (H2).inIndividual
TW and E ininvolvement
HEIs. and skills factor positively influences the
internal stakeholders’ results in TW and E in HEIs.
Hypothesis 3 (H3). Physical inactivity factor negatively influences the internal stakeholders’
results in TW 3and(H3).
Hypothesis E in HEIs.
Physical inactivity factor negatively influences the internal
stakeholders’ results in TW and E in HEIs.
Hypothesis 4 (H4). Psychological well-being factor positively influences the internal stakeholders’
effort in TW and
Hypothesis E in HEIs.
4 (H4). Psychological well-being factor positively influences the internal
stakeholders’ effort in TW and E in HEIs.
Hypothesis 5 (H5). Household activities factor negatively influences the auxiliary and non-
teaching staff’s
Hypothesis 5 results in TW in HEIs.
(H5). Household activities factor negatively influences the auxiliary and
non-teaching staff’s results in TW in HEIs.
Hypothesis 6 (H6). The key internal stakeholders consider that the traditional educational system
(face-to-face) represents the best way to carry out the educational process (this hypothesis does not
appear in Figure 1).
Against this background, the paper aims to identify and analyze the above five factors
that influence the effort and results in TW and E in HEIs from the perspective of their keyInt. J. Environ. Res. Public Health 2021, 18, 8180 5 of 17
internal stakeholders. To accomplish these purposes, the authors used a mix of qualitative
and quantitative research methods (e.g., interviews, surveys) within a Romanian HEI.
This study is conducive to the development of the literature on TW and E in HEIs.
It pinpoints and interprets some of the main factors that affect TW and E from the key
internal stakeholders’ point of view.
The paper is structured as follows. Section 2 presents materials and methods. Results
and a discussion are presented in Sections 3 and 4, respectively. Section 5 illustrates the
conclusions, along with their limitations and research perspectives.
2. Materials and Methods
Firstly, the authors looked for information through desk research. Several secondary
data (e.g., books, articles) from the fields of economics and business administration were
identified and collected from electronic databases (e.g., Springer) and libraries (e.g., the
Central University Library Carol I of Bucharest). Secondly, these data were classified, ana-
lyzed, and synthesized. Thirdly, the authors chose the populations to be addressed starting
from the fact that the University of Bucharest has decided to carry out the educational
process mostly online, since March 2020. They selected the undergraduate program of the
Marketing specialization within the Faculty of Business and Administration, University of
Bucharest, due to the following reasons:
• Starting with March 2020, a high proportion of the educational process has been
provided through online platforms.
• The number and the size of the internal stakeholders (Tables 1–3) allowed the deploy-
ment of both comprehensive exploratory and descriptive research, and the use of
both qualitative and quantitative research methods. Based on the literature review,
three specific groups (students, teachers, and auxiliary and non-teaching staff) were
identified as the key internal stakeholders. The respondents were males and females
as no one declare being non-binary.
• Two out of three authors are teaching various disciplines to students from all three
years of study composing this undergraduate program.
Table 1. Year of study, gender, and number of students within the Marketing specialization, under-
graduate program.
Gender
Year of Study Number of Students
Male Female
I 128 (36.67%) 51 77
II 124 (35.53%) 57 67
III 97 (27.80%) 43 54
Total 349 (100%) 151 (43.26%) 198 (56.74%)
Table 2. Gender, age, title, and number of teachers within the Marketing specialization, undergraduate program.
Number of Gender Age
Title
Teachers Male Female 21–30 31–40 41–50 51–60 61–70
Professor 5 3 2 0 0 2 2 1
Associate professor 12 8 4 0 2 9 1 0
Lecturer 9 7 2 0 6 1 2 0
Assistant professor 13 1 12 7 5 1 0 0
Total 39 (100%) 19 (48.72%) 20 (51.28%) 7 (17.96%) 13 (33.33%) 13 (33.33%) 5 (12.82%) 1 (2.56%)Int. J. Environ. Res. Public Health 2021, 18, 8180 6 of 17
Table 3. Gender, age, and number of auxiliary and non-teaching staff within the Marketing specialization, undergradu-
ate program.
Gender Age
Number of Auxiliary and Non-Teaching Staff
Male Female 21–30 31–40 41–50 51–60
9 2 7 1 6 1 1
Fourthly, in order to accomplish the objectives and test the hypotheses of the paper, the
authors used mixed methods research [66,67], namely qualitative (e.g., in-depth interviews)
and quantitative (e.g., surveys). The fieldwork research was conducted between 10 and
24 of February and 1 and 28 of March 2021. In the first period, 12 in-depth interviews,
both face-to-face and phone interviews, were carried on with people representing the
three groups to identify the main themes of the questionnaires. Interviews were semi-
structured, lasted around 30 min, and covered a plethora of factors that influence TW and E
as follows: individual factors, job factors, organizational factors, family/home factors [68],
and environmental, legal, and safety factors [69].
The six research hypotheses were tested through an online questionnaire applied to
three different populations: 349 students, 39 teachers, and 9 auxiliary and non-teaching staff.
The relatively long time allowed the deployment of the research on the whole populations,
given that the survey participation was voluntary. After receiving, centralizing, and
systematizing the data gathered online, 334 questionnaires were validated from students
(15 out of 349 sent incomplete responses or did not respond), 35 questionnaires from
teachers (2 out of 39 were on child care leave and did not telework and 2 out of 39 sent
incomplete responses or did not respond), and 7 questionnaires from the auxiliary and
non-teaching staff (2 out of 9 were on child care leave and did not telework). The response
rate was: 95.7% in the case of students, 89.7% in the case of teachers, and 77.7% in the case
of auxiliary and non-teaching staff, which are higher than the norm of 56% for researches
utilizing a questionnaire survey [70]. In the case of students, most respondents were
female (59.98%) with an average age of 21.55 years, close to the gender structure of the
program (Table 1). In the case of teachers, most respondents were female (54.29%), mostly
aged between 31 and 40 years old (34.3%) and between 41 and 50 years old (31.4%),
close to the gender and age structure of the program (Table 2). Most respondents were
associate professors (28.6%) and assistant professors (22.9%) and had at least 5 years of
work experience within the faculty. In the case of auxiliary and non-teaching staff, most
respondents were female (77.78%), mostly aged between 31 and 40 years old (42.86%),
and had an average of 12.28 years of work experience within the faculty. In their final
form, the questionnaires comprised 28 items in the case of students, 27 items in the case
of teachers, and 24 items in the case of auxiliary and non-teaching staff, measuring five
factors as follows: technology, individual involvement and skills, physical inactivity,
psychological well-being, and household activities. The questionnaires also included socio-
demographic items (gender, age, work status, residence, income, marital status). The
multi-item factors were measured on a five-point Likert scale where 1 = strongly disagree
and 5 = strongly agree.
Fifthly, the collected data were interpreted through the factorial analysis that uses as
an extraction method the presentation of the main components, along with the Varimax
rotation method using Kaiser normalization [71,72], and processed with SPSS statistical
software (Version 23, IBM, New York, NY, USA).
3. Results
To identify the factors that influence TW and E in HEIs from the students’ perspective,
an analysis of the items was performed. The analysis revealed the existence of four
main types of factors: technology, individual involvement and skills, physical inactivity,
and psychological well-being (Table 4). The values of the Cronbach’s Alpha coefficientInt. J. Environ. Res. Public Health 2021, 18, 8180 7 of 17
were determined to measure the internal validity of the questionnaire, and exceeded the
threshold of 0.7, which shows a good internal consistency of the tested items [73].
Table 4. Testing data from the students’ group.
Items Factor Loadings Factor EV % Variance Cronbach’s Alpha
Sound interruption 0.824
Image interruption 0.803
Technology 4.61 35.494 0.809
Overload platform 0.746
Poor Internet connectivity 0.738
Lack of student involvement 0.853 Individual
Lack of teacher involvement 0.840 involvement and 1.82 14.045 0.784
Lack of skills for using online platforms 0.705 skills
Lack of meeting with teachers 0.917
Lack of meeting with colleagues 0.891 Physical inactivity 1.54 11.847 0.805
Lack of physical activity 0.590
Healthy self-esteem 0.799
Psychological
Other items (e.g., motivation, 1.05 8.106 0.712
0.787 well-being
loneliness)
Psychological pressure 0.609
Note: EV—Eigenvalue.
After investigating the teachers’ group, the same four factors were identified (Table 5).
Testing the internal consistency of the items revealed a low score of 0.564 for the factor
related to the adaptation to the operation of online platforms, which was excluded from
the following analysis. Although the factors related to involvement and physical inac-
tivity obtained values of Cronbach’s Alpha coefficients between 0.6 and 0.7, there are
studies that state that a factor above 0.6 still reflects an acceptable consistency of these
items considered [74].
Table 5. Testing data from the teachers’ group.
Items Factor Loadings Factor EV % Variance Cronbach’s Alpha
Sound interruption 0.918
Image interruption 0.879
Technology 3.38 30.797 0.847
Overload platform 0.838
Poor Internet connectivity 0.645
Lack of student involvement 0.864 Individual
Lack of skills for using online platforms 0.812 involvement and 1.36 12.388 0.652
Lack of teacher involvement 0.803 skills
Lack of physical activity 0.907
Lack of meeting with colleagues 0.863 Physical inactivity 1.49 74.53 0.657
Lack of meeting with students 0.863
Psychological pressure 0.878
Psychological
Other items (e.g., motivation, 1.88 17.171 0.816
0.650 well-being
loneliness)
Healthy self-esteem 0.602
Note: EV—Eigenvalue.
In the case of the group formed by the auxiliary and non-teaching staff of the
faculty, three factors were identified: technology, physical inactivity, and household
activities (Table 6). Testing the internal consistency of the items revealed a score of over
0.7 in the case of Cronbach’s Alpha coefficients, which shows a good consistency of the
items considered [73].Int. J. Environ. Res. Public Health 2021, 18, 8180 8 of 17
Table 6. Testing data from the auxiliary and non-teaching staff group.
Items Factor Loadings Factor EV % Variance Cronbach’s Alpha
Image interruption 0.974
Limited access to the technology 0.866
Technology 2.21 55.37 0.763
Overload platform 0.846
Poor Internet connectivity 0.736
Lack of meeting with colleagues 0.895
Physical inactivity 4.68 58.57 0.944
Lack of physical activity 0.885
Care of children or elderly 0.724 Household
1.39 17.42 0.877
Other activities (e.g., feeding pets, activities
0.709
doing laundry)
Note: EV—Eigenvalue.
As can be seen from the Tables 4–6, the technology factor includes, on the one hand,
the technical aspects regarding the internet connection and functionality of the platforms,
and on the other hand, the skills of using the software. In addition, the authors considered
necessary to separately analyze the devices and online teaching platforms used by internal
stakeholders. In this respect, all students used their own electronic devices to engage in the
online educational process. Most of them possess a smartphone and a laptop (46.71%), and
some of them (23.65%) have only a laptop. Moreover, most teachers have electronic devices
from their own sources, with the faculty allocating only six laptops for them. In the case
of the auxiliary and non-teaching staff, all of them handle laptops, the faculty providing
laptops for six of them. Additionally, by analyzing the most used online teaching platforms,
the results demonstrate that each group predominantly utilizes four platforms: Google
Meetings, Zoom, Moodle, and Microsoft Teams (Table 7).
Table 7. Online teaching platforms used by the key internal stakeholders.
Auxiliary and
Online Teaching Platforms Students (%) Teachers (%)
Non-Teaching Staff (%)
Google Meetings 79.6 60.0 57.1
Zoom 69.8 57.1 55.2
Moodle 64.7 65.7 -
Microsoft Teams 32.4 45.7 12.5
However, certain technical problems have occurred for all the three investigated
groups during the use of the above online teaching platforms. They pointed out that
they have often had problems with the overload of the platforms. This item affected to a
large extent the quality of the educational online process (50.6% of students and 20% of
teachers). Poor internet connectivity is another item that negatively influenced the quality
of the educational process. The problems generated by it led to the interruption of sound
and loss of information during the educational process (34.7% of students and 11.4% of
teachers). On the other hand, image interruption did not alter the quality of the online
educational process.
The influences of technology and psychological well-being factors are perceived
differently by students depending on the gender of respondents or whether or not they
are employed during this period (Table 8). More than that, the individual involvement
and skills factor is perceived differently by students depending on their gender. The
respondents consider that these three factors influence more the quality of the online
educational process. Moreover, students perceive differently the level of effort made
during this period depending on their gender.Int. J. Environ. Res. Public Health 2021, 18, 8180 9 of 17
Table 8. Independent Samples T-Test for Gender and Employee variables (in students’ case).
Levene’s Test for Equality of Variances t-Test for Equality of Means
Equal Variances
Sig. Mean
F Sig. (Assumed/Not t df
(2-Tailed) Difference
Assumed)
T 1.380 0.241 assumed −4.752 332 0.000 −0.47821
Inv 5.356 0.021 not assumed −2.667 258.349 0.008 −0.32663
P In 0.359 0.549 assumed −1.010 332 0.313 −0.11554
Gender Pw 5.427 0.020 not assumed −5.080 263.951 0.000 −0.61597
Results 3.978 0.047 not assumed −1.155 308.118 0.249 −0.129
Effort 2.647 0.105 assumed −2.827 332 0.005 −0.370
Comf 1.174 0.279 assumed 2.513 332 0.012 0.291
T 0.336 0.563 assumed 2.024 332 0.044 0.21025
Inv 1.965 0.162 assumed 0.387 332 0.699 0.04666
P In 0.143 0.706 assumed 1.466 332 0.144 0.16829
Employee Pw 0.293 0.589 assumed 3.875 332 0.000 0.46767
Results 0.577 0.448 assumed −0.278 332 0.781 −0.032
Effort 1.052 0.306 assumed 0.898 332 0.370 0.119
Comf 1.951 0.163 assumed −1.428 332 0.154 −0.167
Note: T—Technology factor; Inv—Involvement factor; P In—Physical inactivity; PW—Psychological well-being factor; Results—Level
of results appreciation for the online educational process; Effort—Level of effort appreciation for the online educational process; Comf—
Comfort level for using electronic devices and platforms; N = 334.
The students from the first two years of study, who are not employed, are more
sensitive to how technology and psychological well-being factors influence the online
educational process. The results show a weak negative correlation between these variables
and the specified factors (Table 9). To interpret the correlations, the values of the Pearson
coefficients were analyzed, using the guide developed by Evans (1996): very weak correla-
tions have values below 0.2, weak correlations have values between 0.2 and 0.4, moderate
correlations are characterized by values between 0.4 and 0.6, strong correlations have
values between 0.6 and 0.8, while correlations with values above 0.8 are very strong [75].
Table 9. Correlations between various variables associated with the group of students.
Variables T Inv P In PW Adapt Effort Results CW
Age −0.171 ** −0.035 −0.011 −0.209 ** 0.152 ** −0.021 0.087 0.185 **
Year of study −0.230 ** −0.031 0.006 −0.294 ** 0.175 ** −0.038 0.111 * 0.242 **
Work experience −0.091 0.09 0.024 0.015 0.032 0.132 0.154 0.147
Average income −0.129 * 0.014 0.064 −0.187 ** −0.029 −0.002 −0.104 −0.073
Family members 0.108 * −0.034 −0.008 0.009 −0.105 −0.044 −0.067 0.016
T 1 0.331 ** 0.255 ** 0.399 ** −0.351 ** −0.023 −0.179 ** −0.290 **
Inv 0.331 ** 1 0.333 ** 0.443 ** −0.201 ** 0.014 −0.032 −0.121 *
P In 0.255 ** 0.333 ** 1 0.454 ** −0.277 ** 0.049 −0.166 ** −0.332 **
PW 0.399 ** 0.443 ** 0.454 ** 1 −0.315 ** 0.087 −0.065 −0.281 **
CP −0.203 ** −0.250 ** −0.189 ** −0.286 ** 0.419 ** 0.170 ** 0.168 ** 0.415 **
Comf −0.412 ** −0.229 ** −0.281 ** −0.373 ** 0.555 ** 0.106 0.276 ** 0.455 **
Adapt −0.351 ** −0.201 ** −0.277 ** −0.315 ** 1 0.101 0.249 ** 0.410 **
Effort −0.023 0.014 0.049 0.087 0.101 1 0.086 0.244 **
Results −0.179 ** −0.032 −0.166 ** −0.065 0.249 ** 0.086 1 0.495 **
CW −0.290 ** −0.121 * −0.332 ** −0.281 ** 0.410 ** 0.244 ** 0.495 ** 1
Note: T—Technology factor; Inv—Involvement factor; P In—Physical inactivity; PW—Psychological well-being factor; CP—Characteristics
of the educational process; Comf—Comfort level for using electronic devices and platforms; Adapt—Adaptability level in the online
educational process; Effort—Level of effort appreciation for the online educational process; Results—Level of results appreciation for the
online educational process; CW—Level of appreciation of the conducting way of the online educational process; N = 334; * Correlation is
significant at the 0.05 level (2-tailed); ** Correlation is significant at the 0.01 level (2-tailed).
In the case of teachers, the results demonstrate that their age negatively influences
the factors related to the involvement in the educational process (R = −0.371, p < 0.05).Int. J. Environ. Res. Public Health 2021, 18, 8180 10 of 17
The youngest considered lack of involvement as a general problem that affects the whole
educational process in the online educational process (Table 10). The items related to
physical inactivity affect teachers’ psychological well-being as there is a weak positive
correlation (R = 0.346, p < 0.05). Physical inactivity also influences other items related to
psychological well-being such as the adaptability level to the online educational process.
In this respect, a lack of physical inactivity led to a lower adaptability level (R = 0.418,
p < 0.05).
Table 10. Correlations between various variables associated with the group of teachers.
Variables T PW Inv P In Effort Results CW Adapt
Age −0.288 0.095 −0.371 * 0.316 0.092 −0.25 −0.226 −0.059
Seniority −0.171 0.111 −0.171 0.248 0.249 −0.207 −0.142 0.067
Average income −0.1 0.161 0.065 −0.005 0.193 0.143 −0.186 −0.069
Family members 0.144 0.287 −0.005 0.069 −0.16 0.176 −0.014 0.119
T 1 0.111 0.205 0.303 0.093 0.096 0.243 0.193
PW 0.111 1 0.066 0.346 * 0.268 −0.073 −0.107 0.219
Inv 0.205 0.066 1 0.088 −0.047 −0.029 −0.088 0.184
P In 0.303 0.346 * 0.088 1 0.008 −0.301 0.023 0.418 *
Effort 0.093 0.268 −0.047 0.008 1 0.17 0.051 −0.023
Results 0.096 −0.073 −0.029 −0.301 0.17 1 0.402 * 0.121
CW 0.243 −0.107 −0.088 0.023 0.051 0.402 * 1 0.343 *
Adapt 0.193 0.219 0.184 0.418 * −0.023 0.121 0.343 * 1
Note: T—Technology factor; PW—Psychological well-being factor; Inv—Involvement factor; P In—Physical inactivity; Effort—Level of
effort appreciation for the online educational process; Results—Level of results appreciation for the online educational process; CW—Level
of appreciation of the conducting way of the online educational process; Adapt—Adaptability level in the online educational process;
N = 35; * Correlation is significant at the 0.05 level (2-tailed).
In addition, through independent samples t-tests, the authors checked whether the
gender of teachers influences the analyzed variables. The results of these tests show that
age is not responsible for how these variables change (Table 11).
Table 11. Independent samples t-tests for teachers’ gender.
Levene’s Test for Equality of Variances t-Test for Equality of Means
Equal Variances
Sig. Mean
F Sig. (Assumed/Not t df
(2-Tailed) Difference
Assumed)
T 0.122 0.729 assumed 0.206 33 0.838 0.05757
Inv 0.458 0.503 assumed 0.174 33 0.863 0.06086
Pw 0.123 0.728 assumed 0.327 33 0.746 0.14145
P In 0.299 0.588 assumed 2.018 33 0.052 0.59704
Adapt 0.976 0.330 assumed 0.416 33 0.680 0.207
Effort 9.324 0.004 not assumed 0.700 24.319 0.491 0.197
Results 2.576 0.118 assumed −0.874 33 0.388 −0.309
In the case of auxiliary and non-teaching staff, the outcomes show that their age or
seniority in the institution does not influence the effort or results obtained (Table 12). In
contrast, the results obtained in the online educational process are strongly influenced the
household activities (R = 0.917, p < 0.01), while the psychological well-being factor strongly
influences the effort made by auxiliary and non-teaching staff in TW and E processes
(R = 0.801, p < 0.05).Int. J. Environ. Res. Public Health 2021, 18, 8180 11 of 17
Table 12. Correlations between various variables associated with the group of auxiliary and non-
teaching staff.
Variables Effort Results
Age 0.439 0.194
Seniority 0.293 0.387
HA −0.52 −0.766 *
Inv −0.279 0.228 *
PW 0.801 * 0.354
P In −0.348 0
T −0.421 −0.62
Note: HA—household activities factor; T—Technology factor; PW—Psychological well-being factor;
Inv—Involvement factor; P In—Physical inactivity; Effort—Level of effort appreciation for the online
educational process; Results—Level of results appreciation for the online educational process; CW—
Level of appreciation of the conducting way of the online educational process; N = 7; * Correlation is
significant at the 0.05 level (2-tailed).
In addition to these findings, students (41%) and auxiliary and non-teaching staff
(57.1%) consider that the best way to carry out the educational process remains the tradi-
tional (face-to-face) system. Most teachers (54.29%) consider that the best way to carry out
the educational process is blended learning (Table 13).
Table 13. The best way to carry out the educational process.
Way of Carrying out Auxiliary and
Students (%) Teachers (%)
Educational Activities Non-Teaching Staff (%)
Traditional system
41 45.71 57.1
(face-to-face)
Online 19.8 0 28.6
Blended learning (mixed
39.2 54.29 14.3
system)
Total 100 100 100
4. Discussion
All of the faculties from the University of Bucharest pivoted to online classes and tem-
porarily jettisoned in-person classes, from March 2020 until the present (June 2021). They
did so as a way of embracing and implementing social distancing as one of the main inter-
ventions recommended within the COVID-19 pandemic. In fact, many HEIs during this
critical period resorted to online instruction as a solace to ensure and salvage their teaching,
learning, and research continuity, and as means to comply with social distancing [64]. As
highlighted in the theoretical framework section, the practice of deploying social distancing
measures, such as closing learning institutions like schools during pandemic outbreaks,
seems to be common. Scholars have produced a short review of university closures due to
COVID-19 and point out that, due to the COVID-19 pandemic, many universities across
the globe have canceled or postponed their academic activities, and have, consequently,
transitioned to online educational platforms [76].
Based on the factor analysis, the results of our research illustrated some of the advan-
tages and disadvantages of TW and online E, during the COVID-19 pandemic. The authors
identified and analyzed five factors that affect TW and E in a HEI: technology, individ-
ual involvement and skills, physical inactivity, psychological well-being, and household
activities. Accordingly, while previous studies described many items related to experi-
ences of TW and E, generally [77], our study customized these results in the context of the
COVID-19 pandemic.
This study highlighted that the technology factor negatively influences the internal
stakeholders’ results in TW and E in HEIs. In the case of students, the obtained results
in the online educational process are rather modest, being negatively influenced by theInt. J. Environ. Res. Public Health 2021, 18, 8180 12 of 17
technology factor (R = −0.179, p < 0.01). The technology factor does not influence both
the teachers’ results in TW and E and the auxiliary and teaching staff’s results in TW
in HEIs. These results are in line with previous researches that discuss technology as a
determinant of TW [78], including the educational services [79]. Some of them underline
the advantages of the technology factor, such as flexibility of working hours and the
possibility to work during the most productive time [80], whereas others emphasize its
disadvantages such as lower productivity when people are using poor information and
communication technologies infrastructure [81], lack of skills to deal with increasingly
sophisticated technology [82], and possible loss of data security [16], which are also found
in HEIs. This research shows that individual involvement and skills factor positively
influences the internal stakeholders’ results in TW and E in HEIs. In the case of auxiliary
and non-teaching staff, their results are positively influenced by this factor (R = 0.228,
p < 0.01). On the other hand, the lack of involvement of both teachers and students led to
an absence of interactivity between these two groups, which puts psychological pressure
on both sides. Other studies highlight that, during the online educational process, teachers
reported a sense of worry and concern for students and deeply felt their absenteeism [83].
Moreover, in other researches, teachers stated that the COVID-19 pandemic increased
student anxiety and parental stress [84].
The results confirmed the third hypothesis that physical inactivity has a negative
influence on the internal stakeholders’ results in TW and E in HEIs due to the lack of
physical meetings between them. In the case of students, the outcomes obtained in the
online educational process are rather modest due to the physical inactivity (R = −0.166,
p < 0.01), in line with other studies [85]. With the outbreak of COVID-19, social distance
together with its coeval, physical distancing, has emerged not only as a mantra but also as
a prism through which coronavirus is viewed [86]. With social distancing and quarantine
strategies, people spend more time at home, with less opportunity for an active lifestyle [87],
leading to the appearance of health threats, such as occupational and cardiovascular
diseases [82], which are also found in HEIs. In terms of the influence of the psychological
well-being factor on the internal stakeholders’ effort in TW and E in HEIs, the fourth
hypothesis was validated. In the case of the auxiliary and non-teaching staff, their effort is
positively highly influenced by this factor (R = 0.801, p < 0.01). Psychological well-being
associated with TW has been studied in a different context [88], including HEIs [89,90].
Other studies reveal that, during the COVID-19 pandemic, teleworkers’ stress was caused
by new factors such as health and life threats, numerous restrictions, and recommendations
due to the epidemic state (stay-at-home, closure of many institutions), isolation, lack
of social support [91], inability to connect effectively with employing organization [92]
and a reduced sense of belonging to the organization [15,82]. Satisfaction with life and
the affective component of psychological well-being tend to correlate because both are
influenced by the assessment made by people about activities and circumstances in which
life is carried out [93]. In accordance with other studies, the persons who attained a tertiary
level of education, such as teachers and students, experience relatively more negative
consequences from TW and E on relationships with colleagues [31].
The results confirmed the fifth hypothesis that the household activities factor nega-
tively influences the auxiliary and non-teaching staff’s results in TW in HEIs. In this respect,
carrying out work tasks at their own homes, at the same time as carrying out household
chores, creates a great psychological pressure among the auxiliary and non-teaching staff,
who now perceive a much greater effort than in the period in which they worked at their
workplace. The fact that they are tempted to deal in parallel with household chores, not
only what they have to do for professional activity, eventually leads to record poorer results
from a professional point of view, as their concentration is no longer 100% directed to what
they have to do in this regard (R = −0.766, p < 0.05). Previous studies in this field of research
indicated that women pay more attention to family duties. Thus, they are attracted more
to home-based telework, which assists them in balancing work and family responsibili-Int. J. Environ. Res. Public Health 2021, 18, 8180 13 of 17
ties [94]. One of the disadvantages of TW in HEIs to the household activities is the fact that
women find themselves multitasking due to their multiple domestic responsibilities [95].
The study invalidates the sixth hypothesis. The traditional system (face-to-face)
is considered the best way to carry out the educational process by students (41%) and
auxiliary and non-teaching staff (57.1%), whereas teachers (45.71%) believe that blended
learning (mixed system) is the best way, in accordance with other researches [96]. In
addition, the study shows that the three key internal stakeholders used mainly laptops or
smartphones as their own electronic devices for carrying out online activities. The most
used online platforms during the COVID-19 pandemic were Google Meetings and Zoom.
Moreover, previous studies revealed that the demand for video conferencing apps has
surged during the TW [97] and the most used online educational platforms were Microsoft
Teams and Zoom [98].
This study leads to several practical implications. Firstly, the government may support
and promote a culture of TW and online E through investments in modern technologies.
Secondly, HEIs may sustain their key internal stakeholders by delivering them electronic
devices, ensuring up-to-date online educational platforms, and organizing training courses
for developing technological skills and psychological counseling. Thirdly, HEIs may
involve other stakeholders through partnerships (e.g., companies) to improve the quality
of the online educational process.
Concerning future lines of research, it might be relevant to expand the study on other
internal stakeholders and external stakeholders, such as alumni, statutory authorities,
local and national government bodies, local and regional communities, local businesses,
committees, and elected officials. Since this study has been based on some of the factors that
influence the internal stakeholder’s effort and results in TW and E in HEIs, future researches
should be conducted to identify and analyze other important factors. Moreover, they might
take into consideration the possible correlations among the items related to these factors.
Other researchers may monitor the extent to which these and other factors are valid outside
of this pandemic context. Another limitation of our study is the size and the structure of
the populations, as these are representative only for the Marketing specialization within
the Faculty of Business and Administration from the University of Bucharest. A larger and
more representative population should be analyzed for future researches.
5. Conclusions
The appearance and expansion of the COVID-19 pandemic have dramatically changed
the way activities are carried out in organizations from various sectors. From a theoretical
point of view, this paper contributes to the enrichment of the literature on TW and E in HEIs.
It provides a theoretical model that brings some clarifications regarding the perspective of
their key internal stakeholders on TW and E. In addition, the paper presents the connection
between these concepts in HEIs, highlighting the fact that they focus mainly on the same
dimensions: economic, technological, social, and human. It also shows that TW and E lead
to the development of HEIs through the active involvement and participation of their key
internal stakeholders (students, teachers, and auxiliary and non-teaching staff).
From a practical point of view, TW and online E in a HEI should be implemented
by taking into account the needs and expectations of its key internal stakeholders. This
paper identifies and investigates some of the factors (technological, individual involvement
and skills, physical inactivity, psychological well-being, and household activities) that
influence the internal stakeholder’s effort and results in TW and E in HEIs, by taking into
account their opinions. Firstly, this study shows that the students’ results are negatively
influenced by the technology factor and physical inactivity. Secondly, it demonstrates
that the efforts of auxiliary and non-teaching staff are highly positively influenced by the
psychological well-being factor and their results are positively influenced by the individual
involvement and skills factor and negatively influenced by the household activities factor.
Thirdly, students and auxiliary and non-teaching staff consider that the traditional systemInt. J. Environ. Res. Public Health 2021, 18, 8180 14 of 17
(face-to-face) represents the best way to carry out the educational process, while teachers
state that blended learning (mixed system) is the best way.
Last but not least, there is a need for future studies related to the factors that influence
TW and E in HEIs. This should be sustained by the technological advances, on one hand,
and, on the other hand, by the psycho-demographic changes.
Author Contributions: Conceptualization, Ş.-A.C. and S.-G.T.; methodology, S.-G.T.; software, A.B.;
validation, Ş.-A.C., S.-G.T., and A.B.; formal analysis, A.B.; investigation, Ş.-A.C.; resources, S.-G.T.;
data curation, Ş.-A.C. and S.-G.T.; writing—original draft preparation, Ş.-A.C. and S.-G.T.; writing—
review and editing, Ş.-A.C., S.-G.T., and A.B.; visualization, S.-G.T.; supervision, S.-G.T.; project
administration, Ş.-A.C. All authors have read and agreed to the published version of the manuscript.
Funding: This research received no external funding.
Institutional Review Board Statement: The study was conducted in accordance with the Declaration
of Helsinki, and the protocol was approved by the Ethics Committee of the University of Bucharest
(decision No. 14/25 February 2020).
Informed Consent Statement: The questionnaire opens with the following information: The ques-
tionnaire is part of an academic study on the topic: the effects of the pandemic on teleworking
and education. Participation in the study is voluntary and anonymous, and that by completing the
questionnaire you provide implicit consent to participate in this research.
Data Availability Statement: Data is available on request.
Conflicts of Interest: The authors declare no conflict of interest.
References
1. Angelici, M.; Profeta, P. Smart-working: Work flexibility without constraints. CESifo Work. Pap. 2020, 8165, 1–56.
2. International Labour Organization (ILO). Practical Guide on Teleworking during the COVID-19 Pandemic and Beyond. Available
online: https://www.ilo.work.wcms_751232.pdf (accessed on 10 March 2021).
3. OECD. Productivity Gains from Teleworking in the Post COVID-19 Era: How Can Public Policies Make It Happen? Available
online: https://read.oecd-ilibrary.org/view/?ref=135_135250-u15liwp4jd&title=Productivity-gains-from-teleworking-in-the-
post-COVID-19-era (accessed on 10 March 2021).
4. International Labour Organization (ILO). Challenges and Opportunities of Teleworking for Workers and Employers in the
ICTS and Financial Services Sectors. Available online: https://www.ilo.org/wcmsp5/groups/public/---ed_dialogue/---sector/
documents/publication/wcms_531111.pdf (accessed on 15 March 2021).
5. Brussevich, M.; Dabla-Norris, E.; Khalid, S. Who will Bear the Brunt of Lockdown Policies? Evidence from Tele-workability
Measures Across Countries. IMF Work. Pap. 2020, 2020, 1–24. [CrossRef]
6. Eurofound. Telework and ICT-Based Mobile Work: Flexible Working in the Digital Age. Available online: https://www.
eurofound.europa.eu/sites/default/files/ef_publication/field_ef_document/ef19032en.pdf (accessed on 16 March 2021).
7. Milasi, S.; González-Vázquez, I.; Fernández-Macías, E. Telework before the COVID-19 pandemic: Trends and drivers of differences
across the EU. OECD Product. Work. Pap. 2021, 21, 1–20.
8. Sostero, M.; Milasi, S.; Hurley, J.; Fernandez-Macías, E.; Bisello, M. Teleworkability and the COVID-19 Crisis: A New Digital
Divide? Available online: http://hdl.handle.net/10419/231337 (accessed on 10 March 2021).
9. Nilles, J.M. Telecommunications and Organizational Decentralization. IEEE Trans. Commun. 1975, 23, 1142–1147. [CrossRef]
10. Bajzikova, L.; Sajgalikova, H.; Wojcak, E.; Polakova, M. How Far Is Contract and Employee Telework Implemented in SMEs and
Large Enterprises? (Case of Slovakia). Procedia Soc. Behav. Sci. 2016, 235, 420–426. [CrossRef]
11. Gálvez, A.; Tirado, F.; Jesús Martínez, M. Work–Life Balance, Organizations and Social Sustainability: Analyzing Female Telework
in Spain. Sustainability 2020, 12, 3567. [CrossRef]
12. Eurofund. Working Anytime, Anywhere: The effects on the World of Work. Available online: http://eurofound.link/ef1658
(accessed on 15 March 2021).
13. Randa Diab-Bahman, R.; Al-Enzi, A. The impact of COVID-19 pandemic on conventional work settings. Int. J. Sociol. Soc. Policy
2020, 40, 909–927. [CrossRef]
14. Morgan, R.E. Teleworking: An assessment of the benefits and challenges. Eur. Bus. Rev. 2020, 16, 344–357. [CrossRef]
15. Ward, N.; Shabha, G. Teleworking: An assessment of socio-psychological factors. Facilities 2001, 19, 61–70. [CrossRef]
16. Lim, V.K.G.; Teo, T.S.H. To work or not to work at home: An empirical investigation of factors affecting attitudes towards
teleworking. J. Manag. Psychol. 2000, 15, 560–586. [CrossRef]
17. Harpaz, I. Advantages and disadvantages of telecommuting for the individual, organization and society. Work Study 2002, 51,
74–80. [CrossRef]Int. J. Environ. Res. Public Health 2021, 18, 8180 15 of 17
18. Pérez, M.; Sánchez, A.; de Luis Carnicer, M. Benefits and barriers of telework: Perception differences of human resources
managers according to company’s operations strategy. Technovation 2002, 22, 775–783. [CrossRef]
19. Zhang, S.; Moeckel, R.; Moreno, A.T.; Suai, B.; Gao, J. A work-life conflict perspective on telework. Transp. Res. Part A 2020, 141,
51–68. [CrossRef] [PubMed]
20. Tietze, S.; Musson, G. Identity, identity work and the experience of working from home. J. Manag. Dev. 2010, 29, 148–156.
[CrossRef]
21. Dima, A.; Tuclea, C.; Vrânceanu, D.M.; T, igu, G. Sustainable Social and Individual Implications of Telework: A New Insight into
the Romanian Labor Market. Sustainability 2019, 11, 3506. [CrossRef]
22. Nakrošienė, A.; Bučiūnienė, I.; Goštautaitė, B. Working from home: Characteristics and outcomes of telework. Int. J. Manpow.
2019, 40, 87–101. [CrossRef]
23. Vega, R.; Anderson, A.; Kaplan, S. A within-Person Examination of the Effects of Telework. J. Bus. Psychol. 2015, 30, 313–323.
[CrossRef]
24. Sorensen, S. The performativity of choice: Postfeminist perspective on work-life balance. Gender Work Organ. 2017, 24, 297–313.
[CrossRef]
25. Sharit, J.; Czaja, S.J.; Hernandez, M.A.; Nair, S.N. The employability of older workers as teleworkers: An appraisal of issues and
an empirical study. Hum. Factors Ergon. Manuf. Serv. Ind. 2009, 19, 457–477. [CrossRef] [PubMed]
26. Kossek, E.; Thompson, R.J.; Lautsch, B.A. Balanced workplace flexibility: Avoiding the traps. Calif. Manag. Rev. 2015, 57, 5–25.
[CrossRef]
27. Suh, A.; Lee, J. Understanding teleworkers’ technostress and its influence on job satisfaction. Internet Res. 2017, 27, 140–159.
[CrossRef]
28. De, R.; Pandey, N.; Pal, A. Impact of digital surge during COVID-19 pandemic: A viewpoint on research and practice. Int. J. Inf.
Manag. 2020, 55, 102171.
29. Estrada-Muñoz, C.; Vega-Muñoz, A.; Castillo, D.; Müller-Pérez, S.; Boada-Grau, J. Technostress of Chilean Teachers in the Context
of the COVID-19 Pandemic and Teleworking. Int. J. Environ. Res. Public Health 2021, 18, 5458. [CrossRef] [PubMed]
30. Felstead, A.; Jewson, N.; Walters, S. Managerial control of employees working at home. Br. J. Ind. Relat. 2003, 41, 241–264.
[CrossRef]
31. Aguilera, A.; Lethiais, V.; Rallet, A.; Proulhac, L. Home-based telework in France: Characteristics, barriers and perspectives.
Transp. Res. Part A Policy Pract. 2016, 92, 1–11. [CrossRef]
32. Maruyama, T.; Hopkinson, P.G.; James, P.W. A multivariate analysis of work–life balance outcomes from a large scale telework
programme. New Technol. Work Employ. 2009, 24, 76–88. [CrossRef]
33. Tremblay, D.G.; Paquet, R.; Najem, E. Telework: A way to balance work and family or an increase in work-family conflict? Can. J.
Commun. 2006, 31, 715–731. [CrossRef]
34. Loia, F.; Adinolfi, P. Teleworking as an Eco-Innovation for Sustainable Development: Assessing Collective Perceptions during
COVID-19. Sustainability 2021, 13, 4823. [CrossRef]
35. Madsen, S.R. The effects of home-based teleworking on work-family conflict. Hum. Resour. Dev. Q. 2003, 14, 35–58. [CrossRef]
36. Illegems, V.; Verbeke, A.; S’Jegers, R. The organizational context of teleworking implementation. Technol. Forecast. Soc. Chang.
2001, 68, 275–291. [CrossRef]
37. Arntz, M.; Ben-Yahmed, S.; Berlingieri, F. Working from home and COVID-19: The chances and risks for gender gaps. Intereco-
nomics 2020, 55, 381–386. [CrossRef]
38. Dingel, J.; Neiman, B. How Many Jobs Can Be Done at Home? NBER Work. Pap. 2020, 26948. [CrossRef]
39. Hensvik, L.; Le Barbanchon, T.; Rathelot, R. Which jobs are done from home? Evidence from the American time use survey.
Discuss. Pap. Ser. 2020, 13138, 1–17. [CrossRef]
40. European Commission. Telework in the EU before and after the COVID-19: Where We Were, Where We Head to. Available online:
https://ec.europa.eu/jrc/sites/jrcsh/files/jrc120945_policy_brief_-_covid_and_telework_final.pdf (accessed on 15 March 2021).
41. Avdiu, B.; Nayyar, G. When face-to-face interactions become an occupational hazard: Jobs in the time of COVID-19. Policy Res.
Work. Pap. 2020, 197, 109648.
42. Ray, T.K.; Pana-Cryan, R. Work Flexibility and Work-Related Well-Being. Int. J. Environ. Res. Public Health 2021, 18, 3254.
[CrossRef]
43. Cioca, L.-I.; Bratu, M.L. Sustainability of Youth Careers in Romania–Study on the Correlation of Students’ Personal Interests with
the Selected University Field of Study. Sustainability 2021, 13, 229.
44. Dodge, R.; Daly, A.; Huyton, J.; Sanders, L. The challenge of defining wellbeing. Int. J. Wellbeing 2012, 2, 222–235. [CrossRef]
45. Tov, W. Well-being concepts and components. In Handbook of Well-Being, 1st ed.; Diener, E., Oishi, S., Tay, L., Eds.; DEF Publishers:
Salt Lake City, UT, USA, 2018; pp. 1–15.
46. Magyar, J.L.; Keyes, C.L.M. Defining, measuring, and applying subjective well-being. In Positive Psychological Assessment: A
Handbook of Models and Measures; Gallagher, M.W., Lopez, S.J., Eds.; American Psychological Association: Washington, DC, USA,
2019; pp. 389–415.
47. Dogan, T.; Totan, T.; Sapmaz, F. The role of self-esteem, psychological well-being, emotional self-efficacy, and affect balance on
happiness: A path model. Eur. Sci. J. 2013, 9, 31–42.
48. Dictionary.com. Available online: https://www.dictionary.com/browse/education (accessed on 2 June 2021).You can also read