The Effects of Mobility as a Service and Autonomous Vehicles on People's Willingness to Own a Car in the Future
←
→
Page content transcription
If your browser does not render page correctly, please read the page content below
sustainability

Article
The Effects of Mobility as a Service and Autonomous Vehicles
on People’s Willingness to Own a Car in the Future
Timo Liljamo, Heikki Liimatainen *, Markus Pöllänen                          and Riku Viri

                                          Transport Research Centre Verne, Faculty of Built Environment, Tampere University, FI-33014 Tampere, Finland;
                                          timo.liljamo@tuni.fi (T.L.); markus.pollanen@tuni.fi (M.P.); riku.viri@tuni.fi (R.V.)
                                          * Correspondence: heikki.liimatainen@tuni.fi; Tel.: +358-408-490-320

                                          Abstract: Car ownership is one of the key factors affecting travel behaviour and thus also essential
                                          in terms of sustainable mobility. This study examines car ownership and how people’s willingness
                                          to own a car may change in the future, when considering the effects of public transport, Mobility
                                          as a Service (MaaS) and automated vehicles (AVs). Results of two citizen surveys conducted with
                                          representative samples (NAV-survey = 2036; NMaaS-survey = 1176) of Finns aged 18–64 are presented.
                                          The results show that 39% of respondents would not want or need to own a car if public transport
                                          connections were good enough, 58% if the described mobility service was available and 65% if all ve-
                                          hicles in traffic were automated. Hence, car ownership can decrease as a result of the implementation
                                          of AVs and MaaS, and higher public transport quality of service. Current mobility behaviour has
                                          a strong correlation to car ownership, as respondents who use public transport frequently feel less
                                          of a will or need to own a car than others. Generally, women and younger people feel less of a will
                                          or need to own a car, but factors such as educational level and residential location seem to have a
                                relatively low effect.


Citation: Liljamo, T.; Liimatainen, H.;   Keywords: car ownership; automated vehicles; Mobility as a Service; MaaS; survey
Pöllänen, M.; Viri, R. The Effects of
Mobility as a Service and
Autonomous Vehicles on People’s
Willingness to Own a Car in the
                                          1. Introduction
Future. Sustainability 2021, 13, 1962.
https://doi.org/10.3390/su13041962             Globally, increased congestion and urban space required by car traffic, together with
                                          transport emissions have resulted in the need and objective to reduce the number of
Academic Editor: Cristina Pronello        vehicles on the road, i.e., reduce vehicle mileage and the modal share of passenger cars.
                                          Research on transitions in energy and mobility sectors have found that the dominance of
Received: 18 December 2020                unsustainable technologies has been very stable despite a lot of innovation activities [1].
Accepted: 4 February 2021                 Banister [2] questioned the underlying principles of conventional transport planning and
Published: 11 February 2021               highlighted the need for a new sustainable mobility paradigm. More than a decade later,
                                          Bertolini [3] and Khalaj et al. [4] found that a paradigm shift has not yet taken place, but
Publisher’s Note: MDPI stays neutral      a radical approach may be needed soon due to climate change. Both Banister [2] and
with regard to jurisdictional claims in   Khalaj et al. [4] raise the issue of public acceptability as a necessary condition for change.
published maps and institutional affil-   Efforts to promote sustainable mobility must be tailored to individuals’ values to increase
iations.                                  acceptance and be effective [5]. As car ownership has a great influence on car use and
                                          mobility patterns [6], people’s car ownership and preparedness to use alternative modes of
                                          transport are essential factors in terms of the sustainability objectives. Generally speaking,
                                          car ownership and car use per capita have increased steadily, but many Western countries
Copyright: © 2021 by the authors.         have also exhibited signs of a decreasing trend in the 2000s, leading to the so-called Peak
Licensee MDPI, Basel, Switzerland.        car theory [7].
This article is an open access article         In the future digitalisation and automation can for their part impact the need to own a
distributed under the terms and           car significantly. Digitalisation has ushered in the creation of new transport services and
conditions of the Creative Commons        even an entirely new way of thinking about mobility. Digitalisation enables the offering
Attribution (CC BY) license (https://     of comprehensive mobility services, e.g., as in the concept of Mobility as a Service, MaaS.
creativecommons.org/licenses/by/
                                          The driving force behind MaaS is the seamless combination of modes of transport to offer
4.0/).

Sustainability 2021, 13, 1962. https://doi.org/10.3390/su13041962                                      https://www.mdpi.com/journal/sustainability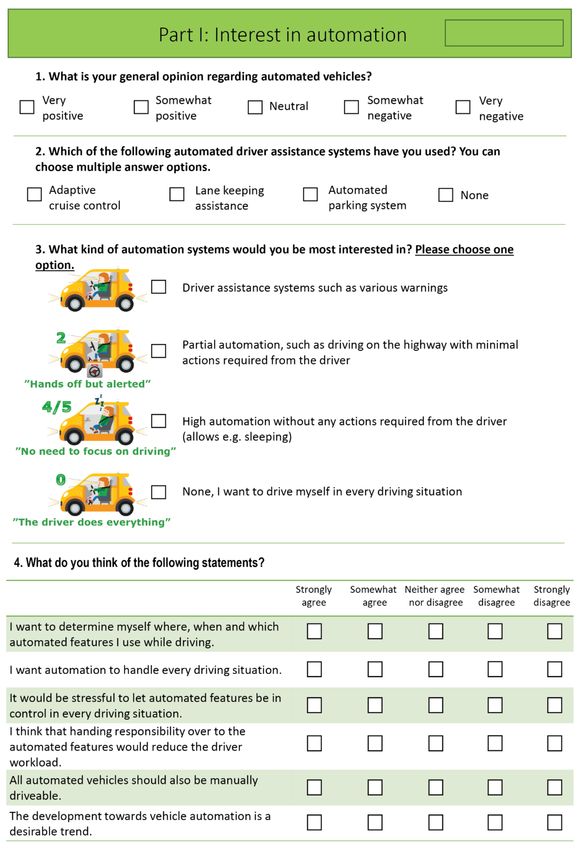
Sustainability 2021, 13, 1962                                                                                            2 of 28

                                customers a comprehensive service. MaaS has potential to become a significant part of the
                                transport system of the future [8].
                                     Automation, in turn, will enable the development of driverless cars. Automated cars
                                may influence people’s travel behaviour and need to own a car significantly [9]. This
                                study focuses on vehicles of high-level automation, or automation levels 4 and 5 (SAE [10]
                                standard J3016), that are able to move without a driver, at least in some environments.
                                On a general level, cars of a high automation level can be divided into private automated
                                vehicles (PAV) and shared automated vehicles (SAV).
                                     The purpose of this study is to examine how car ownership has changed and how it
                                may change in the future. This study focuses on three factors in particular: the effects of
                                public transport, MaaS and automated vehicles provision on people’s willingness and need
                                to own a car. As shown in the literature review below, there is a clear research gap in this
                                area, especially related to the user perspective. For the time being, there is a limited amount
                                of research on the effects of public transport, MaaS, and AV provision on the future of car
                                ownership, especially from the user perspective. Going forward, transport automation and
                                developed mobility services may, however, have a significant impact on car ownership.
                                Previous studies have approached the subject from various angles, but a comprehensive
                                survey representative of the whole population has not been conducted, and we do not
                                know how ready people are to forgo car ownership. The purpose of this study is to fill
                                the research gap on future car ownership as different mobility services, e.g., in the form
                                of MaaS, and high-level automated vehicles are expected to become more commonplace.
                                The study is implemented as two surveys with representative samples of the population,
                                which has not been done previously in this context.
                                     The primary goal of the study is to determine whether people are ready to forgo car
                                ownership in the future. The following secondary research questions also address the goal
                                of the study:
                                •    What kind of changes have occurred in car ownership?
                                •    How does the service level of public transport affect car ownership?
                                •    How can MaaS affect car ownership in the future?
                                •    How can automated vehicles affect car ownership in the future?
                                •    What are the differences between population groups in terms of willingness to own a
                                     car in the future?
                                     Next, the findings from previous studies regarding car ownership and especially
                                the effects of public transport, MaaS and automated vehicles on car ownership will be
                                discussed. Thereafter, Section 3 describes the methods and data of this study, and Section 4
                                presents the results. Sections 5 and 6 present the discussion and conclusions, respectively.

                                2. Literature Review
                                      In order to highlight the research gap mentioned above, we first analyse the current
                                situation of car ownership in various countries based on literature and in Finland based on
                                statistics. Then we look into the existing literature on the effects of public transport and
                                MaaS as well as automated vehicles on car ownership.

                                2.1. Current Situation Analysis
                                      Previous research has highlighted several factors that decrease people’s willingness
                                to own a car. Zong et al. [11] give urbanisation, the increased prevalence of available
                                competing modes of transport, the general increased unpopularity of cars among young
                                people and concerns about climate change as examples of these factors. Factors related
                                to life situation, such as living alone and childlessness, have a reducing impact on car
                                ownership and on having a driving licence [11].
                                      Some Western European countries, like the UK, the Netherlands, Sweden and Italy,
                                have already seen the peak car use during the first five years of the millennium, resulting
                                to a decline of car use after that point [12] and in the United States the growth halted in
                                2000 [13]. However, there is evidence of a continuing increase of total vehicle kilometres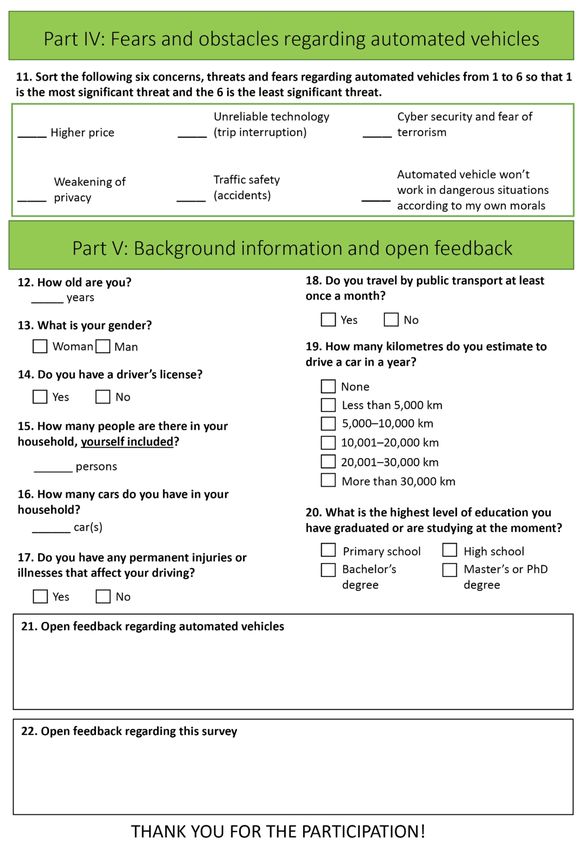
Sustainability 2021, 13, 1962                                                                                                 3 of 28

                                 again after 2009 is the USA [14]. In addition to this, many other developed countries,
                                 such as Germany, France, Norway, the UK and Japan show a clear stabilisation in annual
                                 kilometres driven, and the change in car use has been particularly apparent in the 20–29 age
                                 group [13].
                                       Getting a driving licence as a young person has also become less common, especially
                                 in larger cities in Finland [15] and Sweden [16], for example. Brandt & Lindeqvist [10]
                                 proposed that the reasons mentioned earlier would also apply to not having a driving
                                 licence, while observing that going to work and having a family were factors that con-
                                 tributed to the acquisition of a driving licence. Similar trends in terms of car ownership
                                 can also be observed in the UK, where the increase in the number of cars in proportion to
                                 the population has slowed down and started to decline in London, for example [17].
                                       In Finland, the number of passenger cars in proportion to the population has increased
                                 continuously for the last few decades, albeit the growth has slowed down and stabilised
                                 in recent years. Finland is one of the most motorized countries in Europe in terms of
                                 registered cars per population [18], which relates e.g., to the low population density and
                                 long distances in Finland. In Helsinki, the capital of Finland, the number of cars per capita
                                 has, however, started to decline in the past few years. The development of the passenger
                                 car stock in relation to population in Helsinki and elsewhere in Finland is illustrated in
                                 Figure 1. In the figure, the decline in the early 1990s is due to the economic recession, and
                                 the clear decrease in 2007 can be accounted for by the change in the manner of compiling
                                 statistics. After 2008, the global financial crisis led to an economic downturn in Finland,
                                 too, and is reflected in the development of the car stock. In 2018, there were 629 passenger
                                 cars registered per 1000 inhabitants in 2018 Finland, which can be compared to e.g., 567 and
                                 516 in Germany and Norway, respectively [18]. However, there were only 493 cars in traffic
                                 use per 1000 people in the end of 2018 in Finland [19,20]. The difference to the registered
                                 cars is due to cars, which have been decommissioned, but not officially deregistered from
                                 the car stock data.

      Figure 1. Passenger car stock per 1000 inhabitants in Helsinki and the rest of Finland in 1980–2017 [19–21]. Manner of
      compiling car stock statistics changed in 2007, when statistics started accounting for vehicles in traffic use instead of
      vehicles registered.

                                       As shown in Figure 1, motorization is clearly at a lower level in Helsinki when
                                 compared to the rest of Finland. The same is visible e.g., in Stockholm, Sweden, where
                                 there were 366 cars per 1000 inhabitants in 2019, and in London, UK, where were 302 cars
                                 per 1000 inhabitants in 2017, compared to 473 and 471 cars per 1000 inhabitants for whole
                                 Sweden and the UK, respectively [22–25].
                                       In Finland, car ownership varies greatly depending on gender, age and residential loca-
                                 tion. Table 1 illustrates the number of cars in traffic per 1000 people in different age groups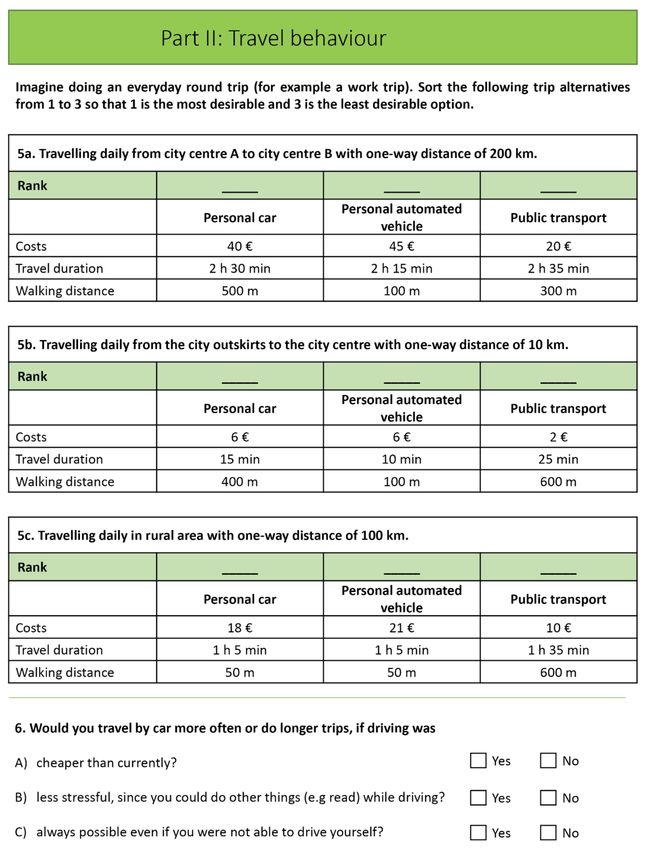
Sustainability 2021, 13, 1962                                                                                                     4 of 28

                                  and areas classified by urban-rural classification in Finland. Urban-rural classification is
                                  a seven-level classification created by Finnish Environment Institute [26]. For study pur-
                                  poses, the original seven-level classification was regrouped into three categories, namely (I)
                                  densely populated urban area (inner city and outer city areas in the original classification),
                                  (II) sparsely populated urban area (exurbs, local rural centres areas, and countryside near
                                  cities), and (III) sparsely populated rural area (rural heartland and sparsely populated
                                  countryside). It should be noted, however, that there are some uncertainties in this data in
                                  terms of age and gender. An important bias caused by the data is that the car is registered
                                  to one person in the family, but it may be also and even mostly used by other persons.

      Table 1. Car ownership by age group in a three-tier urban-rural classification in 2018 in Finland (cars registered in traffic
      per 1000 people in the age group). [26,27].

                                Densely Populated            Sparsely Populated           Sparsely Populated
        Age Groups                                                                                                      All Areas
                                   Urban Area                   Urban Area                    Rural Area
          18–24                         167                          275                          360                      247
          25–34                         349                          585                          663                      500
          35–44                         527                          769                          801                      695
          45–54                         616                          830                          824                      766
          55–64                         600                          758                          759                      716
          65–74                         525                          640                          657                      614
            75–                         335                          411                          410                      390
   All age groups (18–)                 449                          645                          662                      587

                                       According to Table 1, car ownership is most prevalent among the 35–64-year-olds
                                  and especially in sparsely populated areas. In terms of location, the differences are signifi-
                                  cant between densely populated urban areas and other areas, but the differences between
                                  sparsely populated urban areas and sparsely populated rural areas are small. Car own-
                                  ership in proportion to the population is most prevalent in rural areas and at the fringes
                                  of urban areas. Car usage (passenger mileage) in these areas is also greater compared to
                                  urban areas [28].
                                       When examining car ownership, it is essential to notice the difference between house-
                                  holds with no cars and households having fewer cars than adults. In the first group, car
                                  access cannot be assumed, but in the latter group, it is likely that all household adults have
                                  the possibility of using a car as about 82% of Finns aged 18 or older had a driving licence
                                  for passenger cars in the beginning of year 2020 [29,30]. According to Statistics Finland [31],
                                  73% of Finnish households owned a car in 2016. In the Helsinki metropolitan area, approxi-
                                  mately 64% of households own at least one car, whereas up to 83% of households own a
                                  car in the rest of Finland. It should also be noted that the average size of households in
                                  Finland is on the decline [32], and the number of households increases each year as there
                                  are more and more single-person households.

                                  2.2. Effects of Public Transport and MaaS on Car Ownership
                                        In addition to different behaviour of different age groups, the residential district
                                  and availability of public transport have been shown to have a significant impact on car
                                  ownership and use. Indeed, car usage is less prevalent in urban areas compared to rural
                                  areas [7,33]. Various studies have seen the level of service of public transport as a factor in
                                  reducing car ownership, but the estimates given for the scale of the impact vary. Studies
                                  show, for example, that the accessibility of the workplace by public transport [34] and the
                                  general level of service of public transport [35] reduce car ownership. According to Klein &
                                  Smart [36], geographical location and the accessibility of public transport only play a small
                                  role in terms of car ownership among young people. Yagi & Managi [37] also found that
                                  public transport only has a minor impact on car ownership. According to Lee & Senior [38],
                                  public transport availability does not necessarily reduce the share of households owning
                                  a car, but it may eliminate the need to acquire multiple cars. It should also be noted that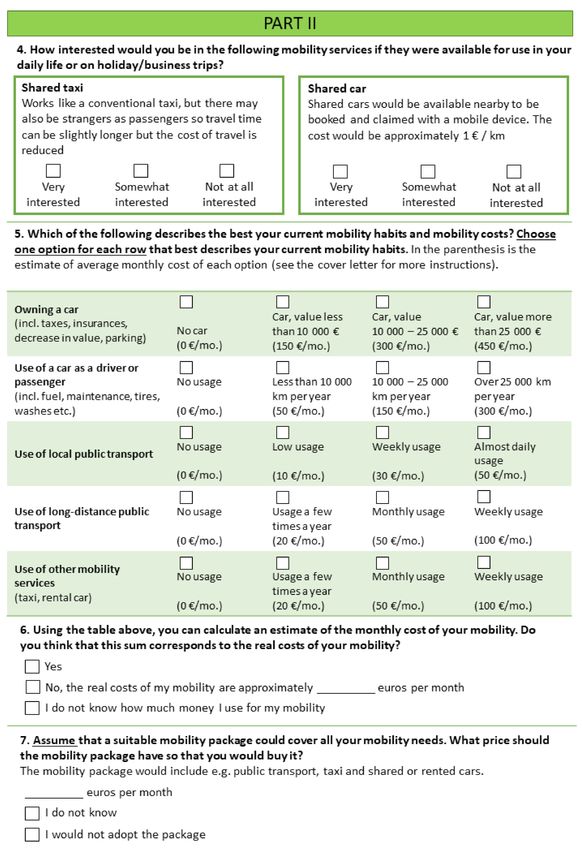
Sustainability 2021, 13, 1962                                                                                             5 of 28

                                car ownership does not necessarily correlate directly with car usage [37]. It may be that
                                the availability of public transport makes these residential areas more tempting for people
                                without cars to move in, thus creating areas with less car ownership [39].
                                     Mobility as a Service (MaaS) can be defined as a concept by which individual’s
                                mobility needs can be fulfilled effectively by integrating different mobility services to
                                seamless trips [40]. With MaaS, fulfilling daily mobility needs does not require owning a
                                car or a bike. Kamargianni et al. [41] studied the potential of MaaS in London and found
                                that MaaS can impact the behaviour of both car-owners and non-car-owners. On one hand,
                                33% of car-owners in London agreed that MaaS would help them depend less on their cars
                                and a quarter of car-owners would even be willing to give up their cars for unlimited access
                                to car sharing for the next couple of years. On the other hand, 36% of non-car-owning
                                participants stated that their car purchasing would be delayed and 40% stated that they
                                would not purchase a car at all if there would be a MaaS offering available. Based on
                                research by Kamargianni et al., there clearly is demand for MaaS in London, and MaaS also
                                shows potential in reducing the need to own a car. [41] Evidently, MaaS may impact both
                                car ownership behaviour and car owners’ car usage.
                                     Storme et al. [42] studied if people could replace or significantly reduce their car
                                use in return for a monthly mobility budget which they could spend on MaaS. Even
                                though the participants, a hundred car-owning Ghent University employees, were highly
                                motivated to reduce car use, they faced considerable difficulties in bypassing their personal
                                car, especially for leisure trips. Based on the findings, MaaS mainly complements car
                                ownership and car use [42].
                                     Currently, there is very little scientific research on the effects of MaaS on car ownership.
                                When developing the MaaS model, the subject of reducing car ownership and the potential
                                which MaaS has in reducing car traffic are often brought up. Indeed, many companies
                                operating in the field of MaaS have said that their objective is to develop the services so
                                that private car ownership and usage can be reduced (see e.g., [43]). Based on a MaaS
                                conference held in Finland in 2019, many researchers also expect MaaS to have a decreasing
                                effect on car ownership (e.g., [44–47]).

                                2.3. Effects of AVs on Car Ownership
                                      According to Litman [48], the costs per kilometre of shared AVs will be significantly
                                less than regular human-operated taxis or ride-hailing services (e.g., Lyft and Uber). There-
                                fore, SAVs will probably decrease households’ need to own cars. Sessa et al. [49], in turn,
                                reported results from a workshop in which most of the experts estimated that car ownership
                                will decrease somewhat (10–30%) as a result of automated vehicles. However, the same
                                experts also noted that if the shared use of automated vehicles becomes commonplace, car
                                ownership may reduce significantly more.
                                      Simulations done in several studies (e.g., [50–52]) show that current transport perfor-
                                mance (passenger kilometres) could be attained with as much as 90% less cars in larger
                                cities, if all vehicles were SAVs. A roughly similar estimate has also been obtained in a
                                simulation done in the Helsinki metropolitan area in Finland [53]. This would unlock a
                                significant business potential around shared automated vehicles, which in turn would
                                enable households to forgo car ownership, as the costs could be lower in comparison to
                                private car ownership. According to Zhang et al. [54], approximately 18% of the households
                                in the greater Atlanta area in the United States could reduce the number of cars owned by
                                households as a result of privately-owned automated cars, without changing any of the
                                mobility habits of the households. This would translate to a 9.5% reduction in the car stock
                                in the area in question.
                                      Pofuk [55] found that 84% of a sample of one hundred people could start using an
                                automated vehicle. Of these people, 71% would rather use a SAV than own one themselves.
                                On the other hand, according to a study by Bansal et al. [56], only 13% of respondents
                                (N = 347) in Austin, US, would forgo car ownership, if the costs of shared automated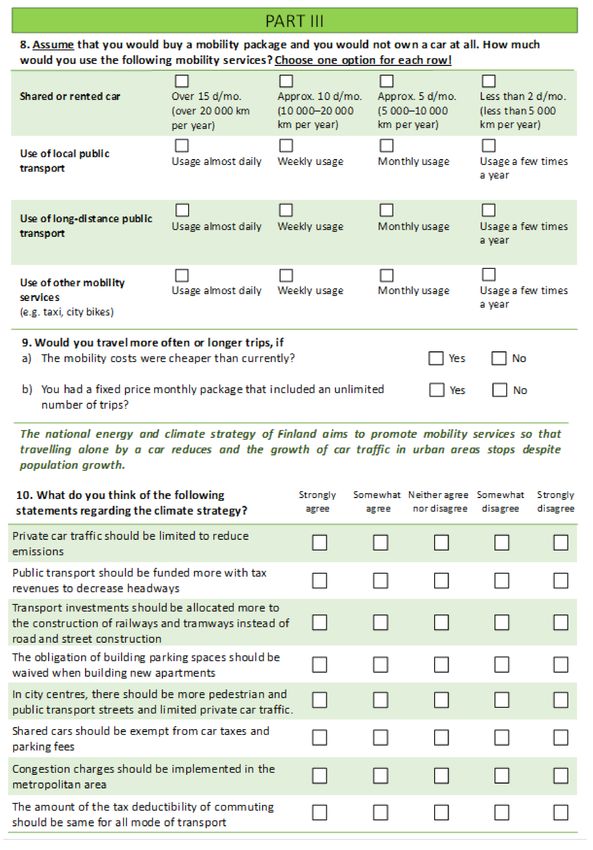
Sustainability 2021, 13, 1962 6 of 28
vehicles were $1/mile. According to Zhang et al. [54], there is still significant opposition to
SAVs and a large proportion of people may, at least in the coming years, prefer PAVs.
Menon’s [57] research (N = 1214) determined how likely it was for respondents to
forgo one of the cars of the household, if a SAV were available (in other words reducing
their household vehicle ownership level by one). More than half of the respondents found
it very unlikely or unlikely. Roughly a fifth of the respondents were unable to say, roughly
a fifth of the respondents thought that forgoing a vehicle was likely and only approximately
7% of the respondents thought it very likely that they might forgo a car in this scenario.
A study by Lavieri et al. [58] focused on the differences between different population
groups in terms of SAVs and PAVs. Respondents aged 18–24 were less interested in owning
an automated vehicle than older respondents. Men were more interested in both SAVs
and PAVs than women, but educational background, for example, was not a statistically
significant factor in terms of the responses. As expected, those living in densely populated
areas, owning fewer cars or with previous experience of shared vehicle services were more
interested than others in using SAVs.
3. Methods and Data
The study utilises data from two comprehensive questionnaire surveys in Finland.
The first survey in 2017 charted the opinions of Finns aged 18–64 on road traffic automation.
The sample of the study was 10,000 Finns. A total of 2036 respondents participated in the
survey, resulting to a total response rate of 20.4%. The second survey in 2018 charted the
opinions of Finns aged 18–64 on mobility services and MaaS. The sample of this study was
6000 Finns. A total of 1176 respondents responded to the survey, making the response rate
19.6%. The sample was limited to people aged 18 or older as the standard age of acquiring
a driving license in Finland is 18. The people aged 65 or older were excluded from the
survey sample as this is a typical age for retiring and thus the mobility patterns within the
population aged 18–64 are more alike. In both surveys the sample group for the survey was
randomly selected from the population register by age and gender group in proportion
to the population’s age and gender distribution. The sample was provided by Population
Register Centre of Finland per procuration. In the study, Finnish legislation, good academic
practices and the terms and conditions of the Centre regarding the sample were followed. In
both surveys all people, who were selected for the sample, were sent a postal questionnaire
with a cover letter. Responding was possible either on the internet with an identification
code or by sending the filled questionnaire back by mail (postage paid).
The questionnaire forms used in the survey and the instructions, background infor-
mation and definitions given to the respondents in the accompanying letter can be found
in Appendices A and B, translated from the original survey language of Finnish into En-
glish. Both questionnaires were piloted with a small number of respondents representing
different socio-economic groups. In the pilot survey, the survey questions were found to be
understandable and thus the actual questionnaires had the same format and questions as
in the pilot study.
This study utilises three of the questions and the respondents’ background information
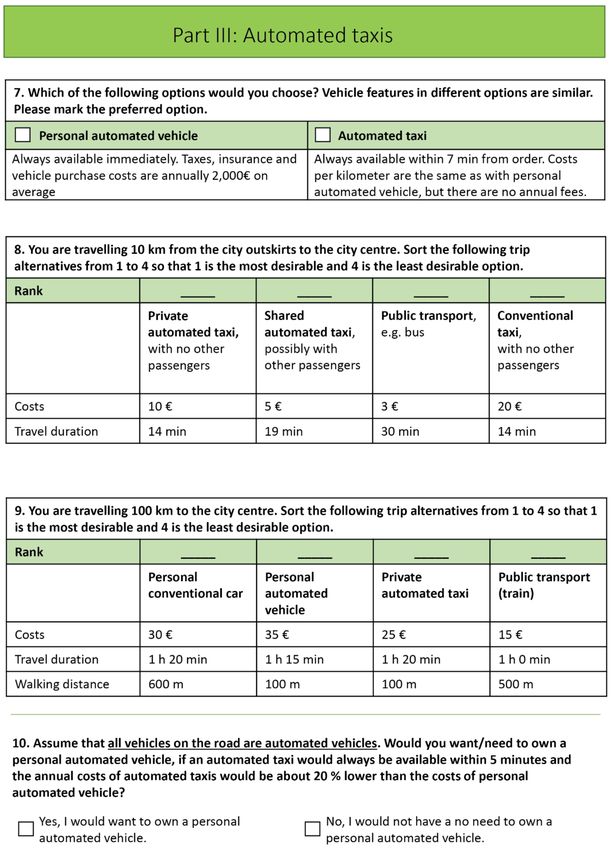
from the two surveys. We look at questions 11a and 11c from the MaaS questionnaire and
at question 10 from the AV questionnaire. The questions were answered with either yes or
no and posed as follows:
• (MaaS questionnaire, question 11a) Would you want or need to own a private car, if
public transport connections were good enough to fulfil your daily mobility needs?
• (MaaS questionnaire, question 11c) Would you want or need to own a private car, if
the annual cost of the mobility service (incl. e.g., public transport, shared taxis and
shared cars) was significantly lower than your own car and you could fulfil all your
mobility needs with it?
• (AV questionnaire, question 10) Assume that all vehicles on the road are automated
vehicles. Would you want/need to own a private automated vehicle, if an automated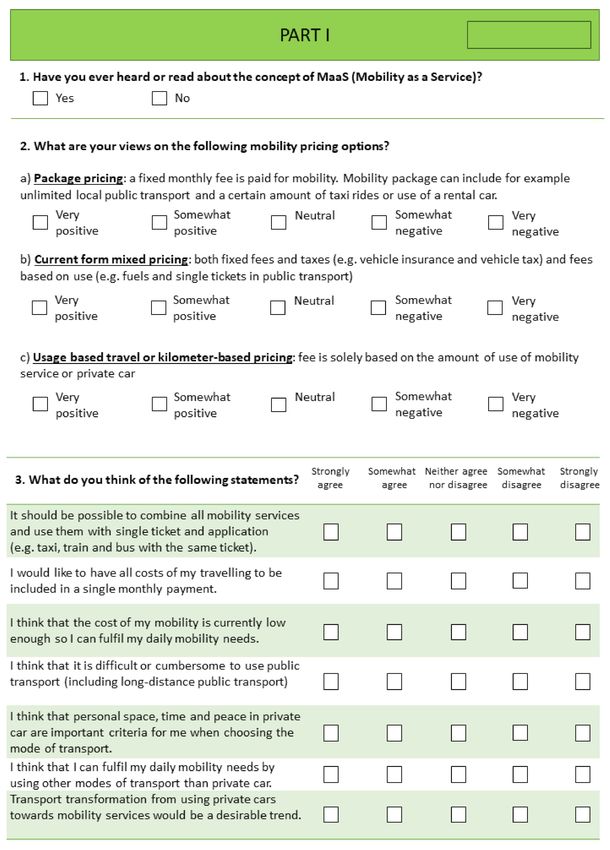
Sustainability 2021, 13, 1962                                                                                            7 of 28

                                     taxi (SAV) would always be available within 5 min and the annual costs of automated
                                     taxis would be about 20% lower than the costs of private automated vehicle?
                                       In the AV question, the 20% cost reduction is similar to the cost comparison of AV
                                taxis and AVs presented by Litman [48]. It should be noted, however, that there are still
                                great variation and large range on the cost level assumptions of AVs and therefore, this is
                                only an estimate implemented for study purposes.
                                       In the results section, we refer to these three above mentioned questions with the titles
                                public transport, MaaS, and automated vehicles, respectively. It is worth to note that even
                                if we refer to MaaS here in this study, the term MaaS was not used in the survey question as
                                it is not generally familiar to an average person in Finland as only 21% of the respondents
                                had heard or read about the concept of MaaS. Other questions of the surveys have been
                                reported in previously published articles [59–61].
                                       The survey results are analysed using IBM SPSS software. This study utilises a logistic
                                regression analysis and cross-tabulations that are used to examine which variables impact
                                the distribution of the responses and how. In order to analyse, how respondents’ different
                                background information affects the response distribution and what types of differences the
                                various population groups have in terms of willingness to own a car in the hypothetical
                                scenarios, logistic regression model was created using the Stepwise Forward LR method.
                                Logistic regression analysis can be used to analyze how different variables affect to the
                                binary choice (in this study whether the respondent want to own a car or not). Logistic
                                regression model takes into account dependencies between explanatory variables and
                                therefore, the model gives a more accurate perspective of the phenomenon than cross-
                                tabulation. In this study, logistic regression model was used to better understand which
                                variables affected the responses and how strongly. In Stepwise Forward LR method, the
                                variables are accepted to the model based on the significance of the score statistics. Variables
                                are added to the model one at a time and the variable to be added is the one that increases
                                the explanatory power of the model the most. New variables are added to the model as
                                long as the new variables statistically significantly improves the explanatory power of the
                                model.
                                       The variables tested for the logistic regression model were:
                                •    age (continuous),
                                •    gender (dummy),
                                •    location of residence (dummy, see explanatory text below),
                                •    number of cars in the household (0, 1, 2, 3 and 4 or more),
                                •    respondent’s use of a car in kilometres driven (see explanatory text on scales below),
                                •    education level (primary school, high school, bachelor’s degree, master’s degree),
                                •    use of public transport (dummy, see explanatory text below),
                                •    driving licence (dummy) and
                                •    gross income of the household (available only in the MaaS survey on a scale of less
                                     than €2000/mo.; €2000–4000/mo.; €4000–6000/mo.; and over €6000/mo.).
                                     The location of residence has been processed as a dummy variable in logistic regression
                                models: densely populated urban area versus other areas. The urban-rural classification
                                was described in Section 2.1. The research data originate from two separate questionnaires,
                                which is why the following determining variables in logistic regression models have some
                                differences. In the AV survey, kilometres driven have been determined based on how many
                                kilometres the respondent estimated they drive in their car per year on the following scale:
                                0 km; less than 5000 km; 5000–10,000 km; 10,001–20,000 km; 20,001–30,000 km; and more
                                than 30,000 km. In the MaaS survey, the respondent estimated their performance either as
                                a passenger or driver on a scale of 0 km; less than 10,000 km; 10,000–25,000 km; and more
                                than 25,000 km. In the AV survey, the use of public transport has been determined based on
                                whether the respondent uses public transport at least once a month. In the MaaS survey,
                                the definition relies on the use of local public transport (on a scale of no use, minor use,
                                weekly use, nearly daily use), which is then coded to make a dummy variable (no use—at
                                least minor use) in logistic regression models.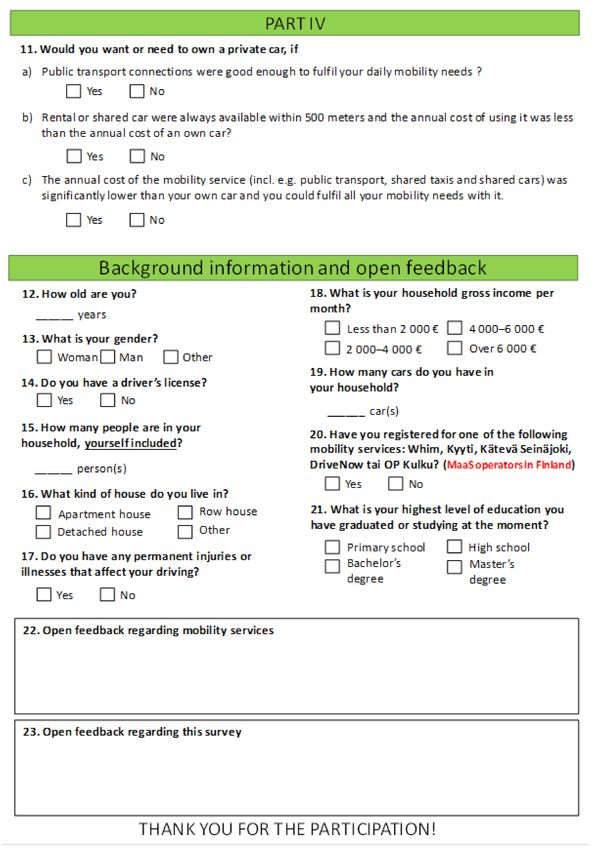
Sustainability 2021, 13, 1962                                                                                                   8 of 28

                                       4. Results
                                            The sample size, number of respondents and response rate by age group and gender
                                       for both surveys are presented in Tables 2 and 3.

                   Table 2. MaaS survey’s sample group, number of respondents and response rate by age and gender.

                                                    Men                                             Women
                                              Number of                                            Number of
   Age Groups             Sample Size                         Response Rate      Sample Size                         Response Rate
                                             Respondents                                          Respondents
        18–24                    415                 50           12.1%              397               59               14.9%
        25–34                    666                 86           12.9%              632              138               21.8%
        35–44                    662                107           16.2%              626              115               18.4%
        45–54                    635                111           17.5%              621              131               21.1%
        55–64                    663                176           26.6%              683              186               27.2%
       In total                 3041                530           17.4%             2959              629               21.3%

                     Table 3. AV survey’s sample group, number of respondents and response rate by age and gender.

                                                    Men                                             Women
                                              Number of                                            Number of
   Age Groups             Sample Size                         Response Rate      Sample Size                         Response Rate
                                             Respondents                                          Respondents
        18–24                    683                 80           11.7%              654               94               14.4%
        25–34                   1084                160           14.8%             1028               160              15.6%
        35–44                   1052                175           16.6%              995               189              19.0%
        45–54                   1056                235           22.3%             1036               236              22.8%
        55–64                   1185                345           29.1%             1227               362              29.5%
       In total                 5060                995           19.7%             4940              1041              21.1%

                                            The results of the surveys can be expanded to apply to all Finns aged 18–64 with the
                                       help of expansion factors. In order to expand the results to cover each age and gender
                                       group, expansion factors are created to calculate how many of the respondents’ peers in
                                       the age and gender group a single respondent corresponds to. This allows for the results to
                                       be viewed as representing the entire population.
                                            Table 4 presents the results of the three key questions on car ownership from the two
                                       surveys (MaaS and AV) described in previous section. The table presents the results (share
                                       of no-responses, i.e., indicating no will or need for car ownership) expanded to the whole
                                       Finnish population aged 18–64 as well as the results in the sample without considering the
                                       expansion factors.
                                            As can be seen from Table 4, expanding the sample to represent the entire population
                                       only has a minor effect on the response distribution. The values calculated using the
                                       expanded sample can be considered to represent the entire population (Finns aged 18–64),
                                       meaning that the results can be generalised to be representative of Finns. As Table 4 shows,
                                       39% of the Finns aged 18–64 would not want or need to own a car if public transport
                                       connections were good enough. Correspondingly 58% of the Finns would not feel the need
                                       to own a car if the described mobility service was available and 65% of the Finns would
                                       not feel the need to own a PAV in the future, when all vehicles in traffic are automated.
Sustainability 2021, 13, 1962 9 of 28
Table 4. The share of responses answering “no” to the three questions related to car ownership in different hypothetical
scenarios. Expanded results apply to the whole population aged 18–64 in Finland.
Share of Responses Answering “no”
Question
Expanded (Non-Expanded, Number of Respondents N)
Public transport: would you want or need to own a private car,
if public transport connections were good enough to fulfil your 39.2% (39.6%, N = 1172)
daily mobility needs?
MaaS: Would you want or need to own a private car, if the
annual cost of the mobility service (incl. e.g., public transport,
58.1% (57.9%, N = 1168)
shared taxis and shared cars) was significantly lower than your
own car and you could fulfil all your mobility needs with it
AV: Assume that all vehicles on the road are automated vehicles.
Would you want/need to own a private automated vehicle, if an
automated taxi would always be available within 5 min and the 64.6% (65.5%, N = 2010)
annual costs of automated taxis would be about 20% lower than
the costs of a private automated vehicle”.
Next, it is examined how respondents’ different background information affects the
response distribution and what types of differences the various population groups have in
terms of willingness to own a car in the hypothetical scenarios. During the examination,
each question receives an individual logistic regression model that can be used to determine
which different background data affect the responses and how. Tables 5–7 illustrate the
logistic regression models for each of the variables affecting the three discussed questions.
Table 5 illustrates the logistic regression model related to the effects of good enough public
transport connections to fulfil daily mobility needs on willingness or need for car ownership.
According to the table, gender, number of cars in the household, annual kilometres driven,
education level and having a driving licence impacted the willingness or need to own a
car if public transport connections were sufficient to meet the respondent’s mobility needs.
According to the model, women, people with fewer private cars, people who use cars
less, highly educated people and those without a driving licence are less willing to own
a car than others in this hypothetical scenario. The model’s coefficient of determination
(R2 = 0.28) is relatively small, which is why the model does not work very well, i.e., the
selected variables only account for some of the differences in the responses.
Table 5. Logistic regression model related to the effects of good enough public transport connections
to fulfil daily mobility needs on the willingness or need to own a car. Coefficient of determination
R2 = 0.28.
Variable B S.E. Wald df Sig. Exp(B)
Gender −0.716 0.144 24.775 1Sustainability 2021, 13, 1962 10 of 28
they could fulfil all their mobility needs with a MaaS solution. The model’s coefficient of
determination (R2 = 0.15) is small, meaning that the variables selected only account for
some of the differences in the responses.
Table 6. Logistic regression model related to the effects of a competitive MaaS offering on the
willingness or need to own a car. Coefficient of determination R2 = 0.15.
Variable B S.E. Wald df Sig. Exp(B)
Age −0.018 0.005 13.812 1Sustainability 2021, 13, 1962 11 of 28
Table 8. Cross-tabulation of background information’s impact on response distribution. The percentages indicate the share
of respondents who would not be willing to own or needing a car in the future. The results from the MaaS survey’s two
questions are on the left, AV survey results are on the right.
Survey MaaS survey AV survey
Question Public transport MaaS AV
Gender Women 49.7% 65.4% 70.5% Women
Men 27.6% 49.0% 60.4% Men
Age groups 18–24 44.0% 1 64.8% 59.5% 18–24
25–34 52.7% 1 70.3% 67.7% 25–34
35–44 38.7% 1 61.0% 62.3% 35–44
45–54 30.2% 1 52.7% 59.1% 45–54
55–64 37.2% 1 49.9% 72.0% 55–64
Level of
Primary school 43.8% 46.3% 65.8% Primary school
education
High school 34.1% 52.7% 61.3% High school
Bachelor’s Bachelor’s
36.8% 57.0% 67.4%
degree degree
Master’s degree 50.8% 70.9% 69.6% Master’s degree
0 80.5% 76.8% 84.9% 0
1 40.0% 59.6% 65.3% 1
Number of cars in 2 24.3% 49.5% 62.1% 2
a household
3 18.8% 50.8% 55.3% 3
4+ 12.0% 25.0% 47.5% 4+
Driving license Yes 37.1% 57.0% 1 64.1% 1 Yes
No 80.8% 72.6% 1 83.7% 1 No
Use of a car No usage 79.5% 79.5% 85.8% None
0–10k km 47.7% 64.7% 78.5% 0–5k km
67.0% 5–10k km
10–25k km 29.6% 49.9%
60.0% 10–20k km
57.6% 20–30k km
25k km + 21.6% 50.0%
49.2% 30k km+
Use of public
No usage 26.5% 2 47.6% 2 74.7% Less than once a month
transport
Low usage 41.2% 2 58.8% 2 59.7% At least once a month
Weekly usage 60.3% 2 77.7% 2
Almost daily usage 67.2% 2 77.4% 2
0–2k€ 57.1% 1 60.9%
Income of a 2–4k€ 43.8% 1 56.8% -
household per -
4–6k€ 32.0% 1 59.1%
month
6k€+ 29.2% 1 57.0%Sustainability 2021, 13, 1962 12 of 28
Table 8. Cont.
Survey MaaS survey AV survey
Question Public transport MaaS AV
Location of Densely populated Densely populated
45.9% 1,2 61.9% 1,2 69.0% 1,2
residence urban area urban area
Sparsely populated Sparsely populated
34.8% 1,2 56.8% 1,2 62.9% 1,2
urban area urban area
Sparsely populated Sparsely populated
30.3% 1,2 48.8% 1,2 60.5% 1,2
rural area rural area
1 = No statistically significant effect based on logistic regression model. 2 = Scale is different than in logistic regression model.
As illustrated in Table 8, there were differences in the response options related to the
use of private cars and use of public transport between the two surveys and household
income was gathered only in the MaaS survey. All of the cross-tabulations in the table
are statistically significant based on the Chi square test, even though according to the
logistic regression model, some of the variables (marked with 1 in Table 8) do not affect the
response distribution in a statistically significant way.
5. Discussion
Transport automation and developed mobility services may have a significant impact
on car ownership. Previous studies have approached the subject from various angles, but
a comprehensive survey representative of the whole population has not been conducted,
and we do not know how ready people are to forgo car ownership. The purpose of this
study was to fill this research gap.
5.1. Public Transport, MaaS and Car Ownership
Based on the results, approximately 39% of Finns would not feel the need or desire
to own a car in the future, if public transport connections were sufficient to meet all their
mobility needs. However, if people would be able to use a high quality and low-cost MaaS
offering, approximately 58% of Finns would not feel the need or want to own a car. It can
be concluded that public transport alone will not be enough for many, but combined with
other mobility services, the service becomes more attractive and, respectively, people’s
willingness and need to own a car is reduced slightly.
In terms of public transport, the results of this survey are fairly well in line with
actual choices people make. According to the literature review, we found that 73% of
Finnish households own at least one car [31]. Nonetheless, in the metropolitan area only
approximately 64% of households own a car. Given that location does not have a great
impact on the professed willingness or need to own a car, it can be stated that the results of
this study are in keeping with actual choices in terms of scale.
The literature did not provide comparable data on MaaS concerning car ownership.
Based on the literature, MaaS is considered to have significant potential in reducing car
ownership (see Section 2.2). The results of this study also support this assumption, because
when MaaS serving all mobility needs would be available, people would feel significantly
less of a will or need to own a car compared to only having sufficient public transport
connections. The interpretation of the results is, however, hindered by the fact that the
content of the mobility service was not specified in more detail in this study, meaning that
we cannot know what type of MaaS offering people were thinking of when they responded
to this survey. Even though public transport is generally thought to be at the core of MaaS,
the respondents may have envisioned themselves primarily using other mobility services
than public transport as part of the MaaS offering.
Furthermore, it was not defined, how much lower the annual cost of the mobility
service was, because people’s willingness to pay for MaaS was studied with other questions
of the survey. Currently, people’s awareness of MaaS as a concept is still low and people areSustainability 2021, 13, 1962 13 of 28
not willing to pay very much for MaaS on average (e.g., only 64% of the respondents’ cur-
rent mobility costs [59,62]), which means that MaaS should generate significant economic
benefits for people to want to adopt it.
5.2. Automated Vehicles and Car Ownership
When it comes to automated vehicles, 65% of Finns would not feel the need to own
a car in the future, if all cars were automated, as long as the level of service were high
in shared vehicles (available within 5 min as presented in this survey) and using them
generated significant financial savings (annual costs 20% less in this survey) compared to
owning a car. It should be noted, however, that in case of automated vehicles, the lower car
ownership does not necessarily mean lower use of passenger cars, if the shared automated
vehicles will be used as the private cars are used nowadays or the higher comfort and
improved quality lead to higher use of passenger cars as Pakusch et al. and Palevicius
et al. [63,64] suggest.
Some research on the impact of automated vehicles on car ownership exists in the
literature. However, the research frames of the studies differ from each other slightly,
making them difficult to compare. This study came to examine a situation where all cars
are automated, i.e., the choice is made between SAV and PAV. This was done because people
have very different attitudes towards automated vehicles and many people have prejudices
against automated vehicles [60]. This allows for more precise information to be gained on
people’s willingness to own a car, when the choice is made purely based on willingness to
own a car and not based on a willingness to adopt new technology. A somewhat similar
research frame comparing the attraction of PAV and SAV can be found in Pofuk’s [55] study,
in which 84% of a sample of one hundred people could start using an automated vehicle,
and of those, 71% would rather start using a SAV than an automated vehicle of their own.
Even though the sample in Pofuk’s study is rather small, the results are similar with this
study. Other studies tended to compare the use of automated vehicles to the use of the
respondent’s own current car, making the interest in shared use significantly lower. These
studies do not, however, observe the fact that people have no real way of comparing these
alternatives, as automated cars have not entered the market. This allows prejudices and
attitudes to impact responses to a great degree.
5.3. Effects of Individual, Household and Area Characteristics on Car Ownership
The background information of the respondents had a minor impact on the attitudes
towards owning a car. The most pronounced differences in the response distribution in
terms of percentages were caused by current mobility preferences and related features,
i.e., the number of cars in the household, having a driving licence, private car travel
performance and use of public transport. There were also clear distinctions between
genders as women felt significantly less of a will or need to own a car than men in all
questions analysed. In terms of age groups, the differences were less pronounced, but
we can observe that younger people felt less of a will or need to own a car than older
respondents. The results are similar to the literature review, which found that today,
generally speaking, younger people and women own fewer cars and use private cars less
than men [6,15,16]. Interestingly, we also noted that 15–23% of respondents without a car in
a household nowadays would want or need to own a car in future in the three hypothetical
scenarios. Most of these respondents are young, indicating that they might have a desire to
own a car, even though they have not yet acquired one.
When it comes to education level, highly educated people felt slightly less of a will
or need to own a car, whereas those who earned more money were more eager to own a
car. The former relates to higher awareness and interest towards MaaS and AVs among the
ones with a higher education [59,60], whereas the latter is partly explained by people with
higher income also having higher travel performance and owning cars more frequently [6].
Even though location of residence has a significant impact on car ownership today
(e.g., [28]), current residential location did not play a major role in people’s attitudesSustainability 2021, 13, 1962 14 of 28
towards future car ownership. According to the logistic regression models, location of
residence had no effect on the responses, but based on the cross-tabulations, respondents
in more densely populated areas felt slightly less of a need to own a car. It is worth noting,
however, that in general, the differences between the different variables were quite small
and the coefficients of determination of the logistic regression models were low (public
transport R2 = 0.28, MaaS R2 = 0.15 and AV R2 = 0.09).
Low coefficiency of determination of the regression models related to car ownership
are not unique to this study. Clark [65] noted that global estimates on income and spatial
context are unlikely to predict local changes in car ownership well. Klein & Smart [36]
found that the geographical location and the accessibility of public transport only play a
small role in terms of car ownership of young people. Oakil et al. [66] had low model fits
(R2 between 0.09 and 0.37) and note that research should focus on the interplay between
demographic transitions, residential choices and mobility patterns. Furthermore, Clark
et al. [67] note that the variation in car ownership is partly explained by household income
and spatial context but the low model fit (R2 = 0.34) imply that other factors, such as
life-style preferences or attitudes have an important role. We have already identified
many trends that decrease car ownership, such as increasingly eco-friendly thought, less
interest in car ownership among younger generations, population aging and the smaller
size of future households. (e.g., [11,13,15,16]). Hence, it is not surprising that the models
concerning hypothetical future mobility services (MaaS and AVs) as alternatives to car
ownership resulted in low coefficiencies of determination as respondents’ individual
attitudes towards new technology have an important role in their answers.
6. Conclusions
This study examined people’s willingness to own a car in terms of three different
phenomena possibly affecting future car ownership. The survey questionnaires were
implemented on a comprehensive sample representative of the population, which had
not been done in previous research. According to the study, new mobility services can
decrease people’s willingness to own a car significantly, given that the services cover
people’s mobility needs and provide economic benefits. In terms of public transport,
the results seem to be in line with people’s actual choices, meaning that in areas with
comprehensive public transport connections, households’ car ownership corresponds to
the survey responses at present. Respondents who do not currently own or use a car, feel
less of a need to acquire or will to use cars in future than others. However, 15–23% of
these respondents would want to own a car in future in all scenarios. Correspondingly,
respondents who use public transport frequently feel less of a will or need to own a car
than others. Generally, women and younger people feel less of a will or need to own a car,
but factors such as educational level and residential location seem to have a relatively low
effect on the willingness to own a car.
As implications for transport policy, mobility services open new possibilities for urban
development and enable decreasing the amount of parking space, if the availability and
sufficient coverage of mobility services meeting the user needs can be guaranteed. If affecting
car ownership is seen as a tool to influence car use and strive for more sustainable mobility,
policies should acknowledge the potential which is embedded with high level of service in
public transport, competitive MaaS solutions and shared autonomous vehicles, while also
considering the social, economic, technical and regulatory aspects (see e.g., [68–70]). The
visions of MaaS focus on the possibility to offer seamless and effortless, instant accessibility
that is smarter, faster and greener than using a private car [71]. The possibility to offer
better freedom of mobility through MaaS is largely dependent on the cities offering high
quality public transport services that are the backbone of MaaS [72]. By promoting public
transport use, sustainability gains are likely, but sustainability of public transport is also
somewhat questionable in areas where and when demand is low. Transport planning
policies must still promote complementary modes such as walking, cycling and public
transport so that the sustainable outcome can be achieved [71]. The alternatives for carSustainability 2021, 13, 1962 15 of 28
ownership and use should also be priced attractively and offer a service level competitive
with car use. This could be achieved e.g., with different types of incentives for the new
services as well as taxing and collecting fees for car ownership and use.
The study also highlighted several themes for further research. In the future, we
should determine the opportunities different areas have of offering various and compre-
hensive mobility services in more detail, allowing us to assess the need to own a car and
potential for reducing the number of cars by area. On the other hand, people over the age
of 65 were excluded from this study, and their will and need to own a car should be gauged.
Future car ownership should also be examined from the point of view of households,
as this study focused on individuals. Besides giving up vehicle ownership entirely, the
potential of reducing the number of households’ vehicles should be studied. Additionally,
as this study approached both the willingness and need for car ownership simultaneously
in the questionnaires, future studies should seek on further understanding on both of these
issues separately as these might differ among population, and this could be one important
aspect in seeking to affect car ownership e.g., with sustainability-driven transport policies.
Concerning the reliability of the results, the extensive samples used in the study to
represent the population increase the reliability of the results. The response rate for both
studies was approximately 20%, which is rather low, making the results somewhat less
reliable in terms of generalisation, although the response rates are similar to other surveys
conducted in Finland [73]. However, a significant source of uncertainty is found in the
definitions of mobility services and automated vehicles within the study. In the questions, it
was assumed that alternative means of mobility could meet all of the respondent’s mobility
needs and do so with lower costs than car ownership, which is not plausible for many
respondents, because the services cannot be offered cost-efficiently in areas with a low
population density. Indeed, this study focuses more on the respondents’ attitudes towards
future car ownership and not on how car ownership is actually going to change. The survey
utilised imaginary choices (stated preferences), that do not always reflect respondents’
actual choices [74], which also contributes to the uncertainties of the study. If the intention
would be to forecast actual changes in car ownership, the operating prerequisites of the
services must be assessed separately in different areas. Finally, even though Finland
is culturally much like other European countries, costs related to owning and using a
passenger car are relatively high in Finland compared to many other Western countries [75].
This may affect people’s willingness to own a car to some extent, but the findings of this
results can be considered relatively applicable to other developed countries and to Europe
in particular.
Author Contributions: Conceptualization, T.L. and H.L.; methodology, T.L.; software, T.L.; valida-
tion, T.L., H.L., M.P. and R.V.; formal analysis, T.L.; investigation, T.L.; resources, H.L.; data curation,
T.L.; writing—original draft preparation, T.L.; writing—review and editing, T.L., H.L., M.P. and
R.V.; visualization, T.L.; supervision, H.L.; project administration, T.L.; funding acquisition, H.L. All
authors have read and agreed to the published version of the manuscript.
Funding: This work was supported by the Kone Foundation (grant number b4b919).
Institutional Review Board Statement: Not applicable.
Informed Consent Statement: Informed consent was obtained from all subjects involved in the study.
Data Availability Statement: Data available upon request.
Conflicts of Interest: The authors declare no conflict of interest. The funders had no role in the design
of the study; in the collection, analyses, or interpretation of data; in the writing of the manuscript, or
in the decision to publish the results.Sustainability 2021, 13, 1962 16 of 28
Appendix A. Automated Vehicle Survey Questionnaire
Instructions given in cover letter (in addition to the general introduction of the topic
and the survey)
Terminology and instructions on how to complete the survey:
• For the sake of clarity, it is assumed that all of the trips connected to the survey are
taken alone, i.e., not with family members or friends.
• The ordering tasks in the survey assume that autonomous cars and automated systems
have been found to be safe, reliable and functional.
• Automated vehicles always refer to vehicles of automation level 4 (automation levels
were also explained to the respondents in plain language), in which the driver does
not steer the car themselves, but the driving is completely automated. This allows the
driver to sleep during the drive, for example. Autonomous cars shorten travel time,
when there is no need to park the car and less time is spent walking.
• Automated taxis refer to vehicles of automation level 4 that operate much like any
current ordinary taxis, but are completely automated and do not have drivers.
• Shared automated taxis refer to taxis that combine rides, so that people who do not
know each other ride in the same taxi. Because there are several passengers, the price
of the trip per customer is less than in a conventional autonomous taxi (question 8).
• In this survey, costs include all costs, such as fuel, parking and car maintenance (e.g.,
servicing, taxes and insurance).
• Travel time refers to the time it takes to travel from “door to door”, meaning that it
includes walking, driving, looking for a parking space, waiting for the transport, etc.
• Walking includes all walking “door to door”.Sustainability 2021, 13, 1962 17 of 28
Figure A1. Cont.Sustainability 2021, 13, 1962 18 of 28
Figure A1. Cont.Sustainability 2021, 13, 1962 19 of 28
Figure A1. Cont.Sustainability 2021, 13, 1962 20 of 28
Figure A1. AV Survey Questionnaire.
Appendix B. MaaS Survey Questionnaire
Instructions given in cover letter (in addition to the general introduction of the topic
and the survey).
Instructions for filling the questionnaire.
Current transport system is approaching a point, when mobility turns more into a
service. Transport is developed to be more seamless and an easier wholeness by the means
of developing services. This can mean simplicity, e.g., a passenger can purchase the trip
from door to door with one payment and one ticket. The compilation on mobility services
are often referred to with the term MaaS, which comes from English words Mobility as
a Service.Sustainability 2021, 13, 1962 21 of 28
Terms related to filling the questionnaire (you may take this page close to you when
filling the questionnaire):
• A mobility service refers to a service, by which one can travel with many transport
modes by using one service or one application.
• A mobility package refers to a mobility service, in which one pays a fixed monthly pay-
ment for a mobility package, which includes a certain number of trips with different
transport modes.
• A shared car refers to a car, which is owned by a company or community and which
can be used by the customers of the company or the members of the community. A
shared car differs from traditional car rental in that it can be booked also for a short
period of time and the booking is done with a mobile device or other smart device.
• Long-haul public transport refers to trips over 30km in this survey. Trips shorter than
this are referred to as local public transport.
Instructions for different questions:
• In question 5 the right alternative is selected according to the current use. If you own
more than one car, answer to the question related to car ownership on the grounds of
the car, which you use the most.
The figure in the brackets describes how much each option causes costs on average
in a month. For example, if your car is currently worth 10,000–25,000 euros, it causes
about 300 euros of costs a month, when taxes, insurances, depreciation, parking, etc. are
considered.
We wish to have answers from all, regardless of owning a driving licence or an own
car. If you find that none of the alternatives offered in a question is not appropriate, you
may choose the alternative which is the least bad. When needed, you may elaborate on the
answers in the open comment fields in the end of the questionnaire.Sustainability 2021, 13, 1962 22 of 28
Figure A2. Cont.Sustainability 2021, 13, 1962 23 of 28
Figure A2. Cont.Sustainability 2021, 13, 1962 24 of 28
Figure A2. Cont.You can also read