The effect of droplet coalescence on drag in turbulent channel flows - Department of Mechanics | KTH
←
→
Page content transcription
If your browser does not render page correctly, please read the page content below
Physics of Fluids                                                                                 ARTICLE            scitation.org/journal/phf

    The effect of droplet coalescence on drag
    in turbulent channel flows
    Cite as: Phys. Fluids 33, 085112 (2021); doi: 10.1063/5.0058632
    Submitted: 1 June 2021 . Accepted: 17 July 2021 .
    Published Online: 4 August 2021

    Ianto Cannon,1             Daulet Izbassarov,2       Outi Tammisola,3          Luca Brandt,3         and Marco E. Rosti1,a)

    AFFILIATIONS
    1
        Complex Fluids and Flows Unit, Okinawa Institute of Science and Technology Graduate University, 1919-1 Tancha, Onna-son,
        Okinawa 904-0495, Japan
    2
        Department of Mechanical Engineering, Aalto University, FI-00076 Aalto, Finland
    3
        KTH Department of Engineering Mechanics, Linne Flow Centre and SeRC (Swedish e-Science Research Centre),
        SE 100 44 Stockholm, Sweden

    a)
         Author to whom correspondence should be addressed: marco.rosti@oist.jp

    ABSTRACT
    We study the effect of droplet coalescence on turbulent wall-bounded flows by means of direct numerical simulations. In particular, the
    volume-of-fluid and front-tracking methods are used to simulate turbulent channel flows containing coalescing and non-coalescing droplets,
    respectively. We find that coalescing droplets have a negligible effect on the drag, whereas the non-coalescing ones steadily increase drag as
    the volume fraction of the dispersed phase increases: indeed, at 10% volume fraction, the non-coalescing droplets show a 30% increase in
    drag, whereas the coalescing droplets show less than 4% increase. We explain this by looking at the wall-normal location of droplets in the
    channel and show that non-coalescing droplets enter the viscous sublayer, generating an interfacial shear stress, which reduces the budget for
    viscous stress in the channel. On the other hand, coalescing droplets migrate toward the bulk of the channel forming large aggregates, which
    hardly affect the viscous shear stress while damping the Reynolds shear stress. We prove this by relating the mean viscous shear stress inte-
    grated in the wall-normal direction to the centerline velocity.
    C 2021 Author(s). All article content, except where otherwise noted, is licensed under a Creative Commons Attribution (CC BY) license (http://
    V
    creativecommons.org/licenses/by/4.0/). https://doi.org/10.1063/5.0058632

    I. INTRODUCTION                                                              he showed that coalescence is prevented when the surfactant concen-
          Two-fluid turbulent flows are found in many cases in industry            tration is above a critical value. As well as preventing coalescence, sur-
    and nature (Balachandar and Eaton, 2010), such as human arteries,            factants produce other effects on bubbles, such as clustering (Takagi
    industrial pipelines, and the injection of bubbles to enable drag reduc-     et al., 2008), reduction in rising velocity (Frumkin and Levich, 1947;
    tion in ships (Ceccio, 2010). In all of these cases, surfactants are known   Levich, 1962), and reduction in shear-induced lift forces (Takagi and
    to have dramatic effects on the flow, often by preventing coalescence         Matsumoto, 2011). Since all these effects can happen at the same time,
    (Takagi and Matsumoto, 2011). However, due to the multi-scale                the effect of different coalescence rates is difficult to highlight; on the
    nature of the problems, the mechanisms by which coalescence affects          other hand, simulations allow us to eliminate these effects and solely
    drag are not fully known and understood yet. Thus, the objective of          focus on the impact of coalescence.
    this work is to explain how coalescence affects drag in wall-bounded               The majority of numerical multiphase flow studies have been
    flows.                                                                        made using interface-tracking methods, such as the front-tracking
          Many experimental studies of surfactants in multiphase flow             (FT) method (Unverdi and Tryggvason, 1992). Front-tracking simula-
    have been made. Frumkin and Levich (1947) were the first to describe          tions of homogeneous-isotropic flows (Druzhinin and Elghobashi,
    the mechanism by which the rising speed of bubbles in water is               1998) are well suited for investigating the effect of droplet size on the
    reduced by surfactants (see Levich, 1962 for English version).               turbulent length scales, such as bubble arrays (Esmaeeli and
    Descamps et al. (2008) measured the wall shear stress in pipe flows of        Tryggvason, 1998, 1999) or channel flows (Lu et al., 2006; Dabiri et al.,
    air bubbles in water and found that larger bubbles produced less drag.       2013; Tryggvason and Lu, 2015; Tryggvason et al., 2016; Lu et al.,
    Duineveld (1997) studied pairs of bubbles rising in a vertical channel;      2017; Ahmed et al., 2020). An advantage of shear flow and

Phys. Fluids 33, 085112 (2021); doi: 10.1063/5.0058632                                                                                           33, 085112-1
C Author(s) 2021
V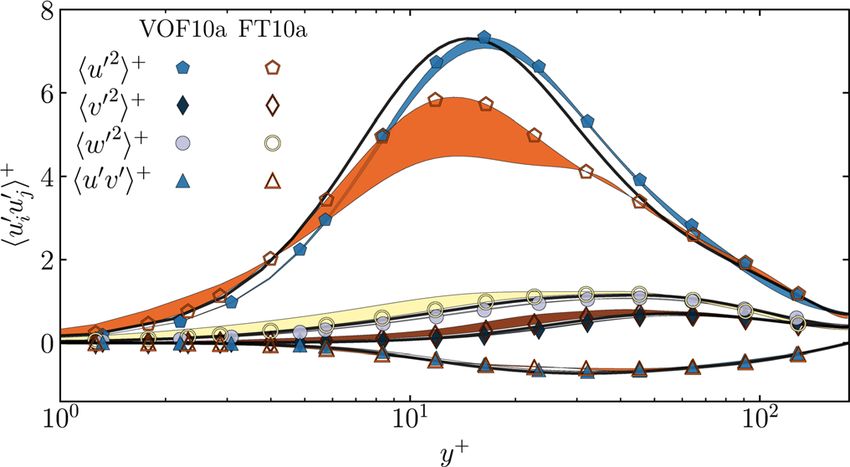
Physics of Fluids                                                                                     ARTICLE               scitation.org/journal/phf

    channel-flow simulations is the ability to measure the effective viscos-      II. GOVERNING EQUATIONS AND FLOW GEOMETRY
    ity and flow rate, which can then be compared with experiments. In                  We consider turbulent channel flows, such as those shown in
    the case of interface-tracking simulations of channel flows, Lu et al.        Fig. 1. The numerical domain has size Lx  Ly  Lz ¼ 6L  2L  3L,
    (2006) simulated laminar bubbly upflows and downflows, Dabiri et al.           where L is the half-height of the channel. The flow is laden with an
    (2013) showed that more deformable bubbles produced lower drag, Lu           ensemble of N droplets, initially spherical with radius R ¼ L=8 and
    et al. (2017) modeled bubbles with insoluble surfactant, and                 randomly arranged. We impose periodic boundary conditions in the
    Ahmed et al. (2020) with soluble surfactant showed their main                streamwise (x) and spanwise (z) directions, while the non-slip and
    effects. However, none of the interface-tracking studies cited here          non-penetration boundary conditions are enforced at the two walls
    includes a model for the breakup or coalescence of droplets, with            y ¼ 0 and y ¼ 2L. An imposed pressure gradient G, uniform through-
    only a few recent works tackling these phenomena (Lu and                     out the domain and constant in time, sustains the flow in the x direc-
    Tryggvason, 2018, 2019).                                                     tion. Balancing the forces on the fluid in the x direction, we obtain an
          Interface-capturing methods, such as the volume-of-fluid (VOF)          expression for the shear stress s at the wall, sw  hsjy¼0 ixz ¼ GL,
    method (Noh and Woodward, 1976), naturally allow coalescence and             showing that sw remains constant in time. Note that, here and in the
    breakup of droplets (Elghobashi, 2019). Interface-capturing simula-          rest of the manuscript, we use angled brackets to represent an average
    tions of homogenous isotropic turbulence (Dodd and Ferrante, 2016;           over the subscripted directions.
    Perlekar et al., 2012; Komrakova et al., 2015; Bolotnov, 2013) and                 The Cartesian components of the fluid velocity field ðu1 ; u2 ; u3 Þ
    shear flows (De Vita et al., 2019; Rosti et al., 2019) have shed some          ðu; v; wÞ are found by solving the incompressible multiphase
    light on the effect of coalescence on turbulence. Notably, Dodd and          Navier–Stokes equations at each location x,
    Ferrante (2016) and Maxey (2017) showed that coalescence is a source
    of turbulent kinetic energy, while breakup is a sink. Scarbolo et al.         ðqui Þ;t þ ðqui uj Þ;j ¼ ðlui;j þ luj;i Þ;j  p;i þ G di1 þ cjni dS ðxÞ; (1)
    (2015) investigated the effect of Weber number on breakup and coa-                                                 ui;i ¼ 0;                                    (2)
    lescence, Soligo et al. (2019) modeled surfactant laden drops in turbu-
    lent channel flows, while Bolotnov et al. (2011) used the level-set           where i; j 2 f1; 2; 3g. Throughout this article, we use Einstein nota-
    method to simulate bubbly channel flows. Roccon et al. (2017) investi-        tion (Einstein, 1916) where repeated indices are summed over, and the
    gated the coalescence and breakup of large droplets in the channel           subscript comma denotes partial differentiation, i.e., F;i  @F
                                                                                                                                               @xi . The
    flow using the phase field method. Interface capturing methods are             scalar p is the pressure field used to enforce the incompressibility
    known to over-predict coalescence rates, because numerical coales-           constraint stated in Eq. (2). The density q and dynamic viscosity l are
    cence occurs whenever the film thickness is less than the numerical           the local weighted averages among the two phases, i.e., q ¼ /qd
    grid spacing. In contrast, in real fluids film rupture occurs at molecular     þð1  /Þqc and l ¼ /ld þ ð1  /Þlc , where subscripts d and c
    length-scales, which are in the tens of nanometers, orders of magni-         denote properties of the dispersed and continuum phases, respectively.
    tude smaller than the Kolmogorov length (Tryggvason et al., 2013;            In the above, / represents the volume fraction of the dispersed phase
    Soligo et al., 2019). A number of methods have been used to reduce           in each computational cell of the domain, with / ¼ 1 in the dispersed
    the coalescence rate of interface capturing methods, such as adaptive
    grid refinement (Innocenti et al., 2021), film drainage models
    (Thomas et al., 2010), coupling to molecular dynamics simulations
    (Chen et al., 2004), and artificial forces (De Vita et al., 2019).
          In this paper, we use the front-tracking method to make simula-
    tions of droplets, which cannot break up or coalesce, and we use the
    volume-of-fluid method to make simulations of droplets that easily
    break up and coalesce. As we are interested in the effects of coales-
    cence, we do not use any methods to reduce the volume-of-fluid coa-
    lescence rate. The two methods give idealized models of a mixture
    saturated with surfactants (FT), and completely clean mixture
    (VOF). Aside from coalescence and breakup, the physical proper-
    ties (surface tension, viscosity, density, etc.) of the fluids in the two
    methods are identical. To the authors’ knowledge, this is the first
    direct comparison of coalescing and non-coalescing droplets in a
    turbulent channel flow.
          The manuscript is organized as follows. First, in Sec. II, we
    describe the mathematical model governing the problem at hand and
    the numerical techniques used to numerically solve them. In particu-
    lar, we describe our chosen interface-tracking and interface-capturing
    methods in more detail. Section III reports the values of the parame-        FIG. 1. A snapshot of the simulation domain for a 10% suspension of droplets sim-
                                                                                 ulated with (a) the front-tracking method (run FT10a in Table I), and with (b) the vol-
    ters explored in our simulations. In Sec. IV, we present statistics of the
                                                                                 ume-of-fluid method (run VOF10a). The orange and blue surfaces show the
    flow to elucidate how coalescence is affecting drag in the channel.           interface between fluid phases. The droplets in (b) can breakup and coalesce, giv-
    Finally, Sec. V gives conclusions and places them in the context of the      ing rise to a range of sizes, whereas those in (a) cannot, thus remaining
    current literature.                                                          monodisperse.

Phys. Fluids 33, 085112 (2021); doi: 10.1063/5.0058632                                                                                                      33, 085112-2
C Author(s) 2021
V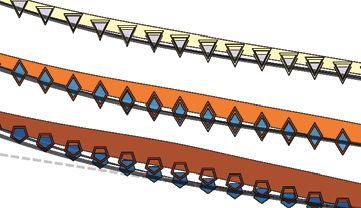
Physics of Fluids                                                                                   ARTICLE             scitation.org/journal/phf

    phase and / ¼ 0 in the continuum phase. The Kronecker delta dij is            (2019) for a detailed description of the volume-of-fluid code employed
    used to ensure that the pressure gradient is imposed in the x direction.      in this work, and in several other works (Rosti et al., 2019; De Vita
    The last term on the right hand side of Eq. (1) is the volumetric formu-      et al., 2019). See Ii et al. (2012) and De Vita et al. (2020) for validations
    lation of the surface tension (Popinet, 2018); it is the product of the       against numerical benchmarks and experiments.
    surface tension coefficient c, the interface local curvature j, and the
    unit normal to the interface ni . Note that we used dS ðxÞ in Eq. (1) to      C. Front-tracking method
    represent the surface delta function, which is zero everywhere except
    for the surface S at the interface between the two phases. dS ðxÞ has               We use the front-tracking (FT) method to simulate droplets that
    dimensions of inverse length.                                                 can deform, but cannot break up or coalesce. This is an
                                                                                  Eulerian–Lagrangian scheme in which the interface between the
                                                                                  phases is tracked by a “front,” composed of triangular elements. The
    A. Discretization of the Navier–Stokes equations
                                                                                  method was introduced by Unverdi and Tryggvason (1992), with
           For simulations of coalescing and non-coalescing droplets, we          many refinements over the past 30 years (Tryggvason et al., 2001;
    use near-identical numerical methods to solve the momentum and                Tryggvason et al., 2011), including techniques to correct for errors in
    continuity equations [Eqs. (1) and (2)]. This ensures that any differ-        volume conservation of the phases (Takeuchi and Tryggvason, 2020).
    ence in our results is due to the droplets, not the integration scheme.       The surface tension force acting on the Lth element is a volume inte-
           Equations (1) and (2) are numerically solved using a finite differ-     gral of the surface tension force from Eq. (1),
    ence method on a fixed Eulerian grid with a staggered arrangement,                                 ððð                      ðð
    i.e., fluid velocities are located on the cell faces and all other variables
                                                                                                FL ¼         cjn dAL ðxÞ dV ¼         cjn dA
    (pressure, density, viscosity, volume-of-fluid, etc.) are located at the                                V                       A
    cell centers. All the spatial derivatives appearing in the equations are                          ðð                          þ L
    discretized with second-order central differences, except for the con-                         ¼        cðn  rÞ  n dA ¼ ct  n ds;              (4)
                                                                                                         AL                         sL
    vective terms in the FT simulations where the QUICK scheme
    (Leonard, 1979) is used instead. In the single-phase (SP) and VOF             where AL and sL are the area and perimeter of the Lth element and t is
    simulations, time integration is performed with the Adams–Bashforth           the tangent to the perimeter. The force is then interpolated onto the
    method. In the FT simulations, time integration is performed with a           Eulerian grid by means of a conservative weighting function and used
    predictor–corrector method, in which the first-order solution (Euler           to update the fluid velocity, which, in turn, is used to update the posi-
    method) serves as a predictor, which is then corrected by the trapezoi-       tion of the interface. As the interface evolves, the unstructured grid
    dal rule (Tryggvason et al., 2001; Farooqi et al., 2019). Both schemes        can greatly deform, resulting in a non-uniform grid. Thus, periodical
    are second order in time. Finally, in regard to the pressure solver, the      restructuring of the Lagrangian grid is performed to maintain a nearly
    fractional step technique (Kim and Moin, 1985) presented by Dong              uniform size, comparable to the Eulerian grid size. See Muradoglu and
    and Shen (2012) and Dodd and Ferrante (2014) is adopted, allowing             Tryggvason (2014) for a detailed description and validation of the
    for the direct solution of a constant-coefficient Poisson equation using       front-tracking code employed in this work, which used in several other
    an FFT-based solver, even in the presence of density differences              works (Izbassarov and Muradoglu, 2015; Lu et al., 2017; Ahmed et al.,
    among the carrier and dispersed phases.                                       2020). Extensive tests of the front tracking method are shown in
                                                                                  Tryggvason et al. (2001).
    B. Volume-of-fluid method
                                                                                  III. SETUP
         We use the volume-of-fluid (VOF) method to simulate droplets
    undergoing topological changes, i.e., coalescence and breakup. This is               Due to the different nature of the numerical schemes used to
    an Eulerian–Eulerian technique in which the fluid phases are tracked           describe the presence of the interface, the numerical domain is discre-
    using the local volume fraction scalar field /. Since Noh and                  tized on two different sets of grids, both verified to provide grid-
    Woodward (1976), a number of variants of the VOF method have                  independent results. The non-coalescing-droplet simulations use a
    been developed (Youngs, 1982, 1984; Puckett et al., 1997; Rider and           uniform grid in the homogenous directions and a non-uniform grid in
    Kothe, 1998; Xiao et al., 2005; Yokoi, 2007). Here, we use the multi-         the wall-normal direction, with minimum spacing DYFT ¼ 3L  103
    dimensional tangent of hyperbola for the interface capturing                  at the channel wall. The minimum spacing in wall units is
                                                                                       þ
    (MTHINC) method, developed by Ii et al. (2012). In this method, we            DYFT     us DYFT = ¼ 0:5, where us and  are defined later in this sec-
    use a smooth hyperbolic tangent function to approximate the interface         tion. Overall, the grid size for the non-coalescing droplet simulations
                                                                                  (FT) is Nx  Ny  Nz ¼ 576  240  288, which is comparable to
                                  1 1                                             that used in Dabiri and Tryggvason (2015), and gives around 24
                   H ð X; Y; Z Þ ¼ þ tanhðbðPð X; Y; Z Þ þ dÞÞ;            (3)
                                  2 2                                             Eulerian grid points per droplet diameter. Due to periodic restructur-
    where b is a parameter controlling the sharpness
                                                Ð Ð Ð of the interface and d      ing, we also have around 24 Lagrangian grid points per droplet diame-
    is a normalization parameter to enforce           H dX dY dZ ¼ / in           ter. The single-phase and coalescing-droplet simulations (VOF) use a
                                                                                                                              þ
    each cell. P is a three-dimensional function in the cell, with the same       cubic uniform grid with spacing DYVOF           ¼ 0:8, and total size
    normal and curvature as the interface. Normals are evaluated using            Nx  Ny  Nz ¼ 1296  432  648. This grid has 108 points per ini-
    the Youngs approach (Youngs, 1982), while the surface tension force           tial droplet diameter. We use more grid points in the VOF simulations
    appearing in momentum Eq. (1) is computed using the continuum                 in order to accurately resolve breakup and coalescence events through-
    surface force (CSF) approach (Brackbill et al., 1992). See Rosti et al.       out the domain.

Phys. Fluids 33, 085112 (2021); doi: 10.1063/5.0058632                                                                                              33, 085112-3
C Author(s) 2021
V
Physics of Fluids ARTICLE scitation.org/journal/phf
TABLE I. Details of each turbulent channel flow simulation performed in the present study. The first column gives a unique name to each run for ease of reference, and the sec-
ond describes the colors and markers that are used in the following figures. Input variables are shown in the subsequent columns in the middle, and output statistics are shown
in the three rightmost columns.
Run Marker Method Coalescence U (%) Ca0 Wes N Reb uþ
cen Web
SP0 N/A N/A 0 N/A N/A 0 2836 18.38 N/A
FT3a FT No 2.5 0.10 1.14 110 2813 18.24 279.0
FT3b FT No 2.5 0.05 0.57 110 2661 17.19 124.8
FT5a FT No 5 0.10 1.14 220 2827 18.50 281.8
FT5b FT No 5 0.05 0.57 220 2602 16.93 119.4
FT10a FT No 10 0.10 1.14 440 2815 18.46 279.4
FT10b FT No 10 0.05 0.57 440 2524 16.54 112.3
VOF3a VOF Yes 2.5 0.10 1.14 110 2803 18.21 277.1
VOF3b VOF Yes 2.5 0.05 0.57 110 2818 18.15 140.0
VOF5a VOF Yes 5 0.10 1.14 220 2764 18.26 269.4
VOF5b VOF Yes 5 0.05 0.57 220 2778 18.07 136.1
VOF10a VOF Yes 10 0.10 1.14 440 2689 18.31 254.9
VOF10b VOF Yes 10 0.05 0.57 440 2685 17.78 127.1
The values of the non-dimensional parameters used in the simu- a slight reduction in uþ toward the center, whereas the runs with non-
lations are shown in Table I. We consider a total volume fraction of coalescing droplets (FT) show a significant reduction in uþ, which
the dispersed phase in the range 0% U 10%, with the continuum becomes more pronounced as U increases. Also, in the coalescing
phase being denser and more viscous than the droplet phase, as the droplets runs, variation of the capillary number produces little change
density ratio is fixed equal to qc =qd ¼ 50 and the dynamic viscosity to in uþ, while in the non-coalescing runs, the change in uþ with Ca0 is
lc =ld ¼ 50 for all runs. Thus, the kinematic viscosity l=q has much more substantial.
the ratio c = d ¼ 1 for all runs. The problem approaches the density This is quantified in the inset of Fig. 2, which shows the bulk
and viscosity ratios of air in water (qwater =qair 830; lwater =lair velocity in wall units uþ
b huixyzt =us on the left axis, and the skin-
55) while still being numerically tractable. The friction Reynolds
pffiffiffiffiffiffiffiffiffiffiffiffi friction coefficient Cf 2sw =qc u2b on the right axis. We see that, rela-
number Res us L= is set to 180 for all runs, where us sw =qc is tive to the single-phase run, the coalescing droplets produce a
the friction velocity. We define the capillary number as Ca0 lc u0 =c
(where u0 is the bulk velocity of the single-phase channel flow) for
which two values are considered, Ca0 ¼ 0:05 and 0.10. Based on these
capillary numbers, the friction Weber number Wes qc u2s L=c
assumes that values are smaller or larger than unity. Finally, N is the
number of droplets at the start of the simulation, which are initially
identical spheres in a random arrangement.
The three rightmost columns in Table I report three output sta-
tistics: the bulk Reynolds number, Reb ub L=, where ub huixyzt is
the bulk velocity; the bulk Weber number, Web qc u2b L=c; and the
centerline velocity in plus units uþ cen hujy¼L ixzt =us . In Sec. IV, we
present these and other statistics of the channel flows and discuss their
implications.
IV. RESULTS
FIG. 2. Main: streamwise velocity profile in wall units uþ, against distance y from
We consider turbulent channel flows, in which droplets can coa-
the channel wall. The single-phase run (SP0) is shown as a black line. The profiles
lesce, and compare the results with a configuration where coalescence are symmetric about the centerline (y ¼ L), so we have plotted runs with non-
is not allowed. The flow is driven by a constant pressure drop; thus, an coalescing (FT), and coalescing (VOF) droplets on the left and right, respectively.
increase in the flow rate or bulk velocity indicates drag reduction, Each Ca0 ¼ 0:1 run is plotted using the marker listed in Table I, while the regions
while its reduction is evidence for drag increase. We start by consider- between uþ for Ca0 ¼ 0:1 and Ca0 ¼ 0:05 are shaded in color. Inset: dependence
ing the profile of the streamwise velocity uþ in the channel, reported of bulk velocity uþ
b on the total volume fraction of droplets U. The skin-friction coef-
ficient Cf is shown on the right axis. Runs with coalescing droplets (VOF) are
in Fig. 2. The single-phase run SP0 shows the typical velocity profile of
shown in blue, while runs with non-coalescing droplets (FT) are shown in orange.
a turbulent channel flow, with regions of high shear at the walls and a Both plots show that drag increases with U and reduces with Ca0 for all non-
flattened profile in the channel center. The runs with coalescing drop- coalescing droplet runs, while very limited changes are observable for the coalesc-
lets (VOF) mostly collapse onto the single-phase profile, showing only ing droplet runs.
Phys. Fluids 33, 085112 (2021); doi: 10.1063/5.0058632 33, 085112-4
C Author(s) 2021
VPhysics of Fluids ARTICLE scitation.org/journal/phf
maximum increase in 4% in Cf, whereas the non-coalescing droplets law region of the channel is affected by the volume fraction U and
produce a maximum increase in 30%. In the case of non-coalescing capillary number Ca0 for the different cases. Again, we see relatively
droplets, the drag is highly dependent on Ca0. The high Ca0 (i.e., more small shifts for simulations with coalescing droplets, and large shifts
deformable droplets) runs show little change in Cf, whereas the low for simulations with non-coalescing droplets. In particular, Duþ grows
Ca0 (i.e., less deformable droplets) runs show a 30% increase in Cf. in magnitude with U, especially for the case with Ca0 ¼ 0:05. This
Notably similar drag increases have been measured for rigid particles reinforces our observations of the bulk streamwise velocity shown in
in channel flows by Picano et al. (2015) and Rosti and Brandt (2020). the inset of Fig. 2 that the less-deformable, non-coalescing droplets
Clearly, the coalescence of droplets in the channel has a profound produce a significant drag increase.
effect on the flow. Throughout this section, we present additional sta- To understand what generates the differences observed for con-
tistics of the flows in order to shed light on the mechanisms of this figurations of coalescing and non-coalescing droplets, we focus our
effect. attention on the total surface area of the droplets. The total interface
Figure 3 shows the velocity profile again, this time on a semi-log area is responsible for the overall surface tension stress and impacts
scale in wall units uþ u=us , and yþ y=d , where d =us is how droplets disperse across the channel. Figure 4 shows how the total
the viscous length scale (Pope, 2000). Away from the wall and the interface area at steady state hSixyzt depends on the total volume frac-
channel center d y L, i.e., the length scales affecting the flow tion U of the dispersed phase. The figure shows that the non-
are separated, and the single phase flow profile is approximately paral- coalescing droplets of the FT runs exhibit only 1% increase in area,
lel to a line with constant slope (the dashed line). This is a manifesta- due to deformation from their initial spherical shape. On the other
tion of the log-law for turbulent channel flows (von Karman, 1930), hand, the coalescing droplets of the VOF runs show more than 80%
þ
which can be derived by assuming that the quantity yþ du reduction in interface area, as droplets coalesce and grow in size. In
dyþ has no
þ
dependence on y or y/L (complete similarity). The flow profiles with particular, when the volume fraction is large, droplets have a higher
coalescing droplets in Fig. 3 are in excellent agreement with the log- likelihood of colliding, and hence more coalescence, leading to a
law, suggesting that coalescing droplets do not break the scale separa- smaller value of hSixyzt =S0 .
tion. However, the flow profiles with non-coalescing droplets are not For the coalescing droplets, the interface area hSixyzt =S0 shows no
in such good agreement, because these droplets have constant size R, dependence on capillary number, differently from what was observed
and y R, so scale separation is prevented; hence, yþ du
þ
by Lu and Tryggvason (2018) and Rosti et al. (2019), who found that
dyþ shows a
dependence on y/R. that as Ca0 decreases, surface tension increases, the droplets become
To further quantify the effect of coalescence on the flow, we fit a more stable to perturbations, hence larger, thus leading to a smaller
log-law function to each flow profile in the region 30 < yþ < 100. interface area hSixyzt =S0 . However, in this case, Ca0 1, and the coa-
Our log law function has the form lescing droplets are limited in size by the channel height, not surface
tension. Figure 1(b) supports this hypothesis, as the coalescing droplets
ln yþ are comparable in size to the channel height.
uþ ¼ þ 5:89 þ Duþ ; (5)
0:41 The inset of Fig. 4 reports the time history of the interface area:
the cases with non-coalescing droplets (FT) rapidly converge to a sta-
where 5.89 is the uþ intercept for run SP0 and Duþ is the shift relative
tistically steady-state, whereas for the coalescing droplets, convergence
to SP0. The inset of Fig. 3 shows how the vertical shift Duþ in the log-
is reached long after, at about t þ 8000. Interestingly, we observe
FIG. 3. Main: velocity profiles in wall units uþ and yþ. Each run is plotted using the FIG. 4. Main: dependence of the total interface area of the droplets hSixyzt on the
marker listed in Table I. For ease of comparison, we have moved the U ¼ 5% and total volume fraction U. We have normalized each area by the total initial surface
U ¼ 10% volume fraction profiles upward by uþ ¼ 5 and uþ ¼ 10, respectively. area S0 of the droplets. The VOF runs (blue) show a major reduction in surface
In the region 30 < y þ < 100 shaded in gray, we fit a log-law equation area due to coalescence, whereas the FT runs (orange) show a slight increase,
yþ
uþ ¼ ln0:41 þ 5:89 þ Duþ (gray dashed line). Inset: the vertical shift Duþ for each due to droplet deformation. Inset: time history of the total interface area. Each run
run. Runs with coalescing droplets (VOF) are shown in blue, while runs with non- is plotted according to the colors and markers listed in Table I. Note how the
coalescing droplets (FT) are shown in orange. Runs with coalescing droplets show coalescing droplets (VOF) reach statistical equilibrium after t þ 8000, while the
only small shifts, whereas the runs with non-coalescing, less deformable droplets non-coalescing droplets (FT) very rapidly converge because of the absence of
show significant drag increase. topological changes.
Phys. Fluids 33, 085112 (2021); doi: 10.1063/5.0058632 33, 085112-5
C Author(s) 2021
VPhysics of Fluids ARTICLE scitation.org/journal/phf
that the coalescing droplet runs with larger capillary number (VOFa) We are now ready to investigate how droplets affect the turbulent
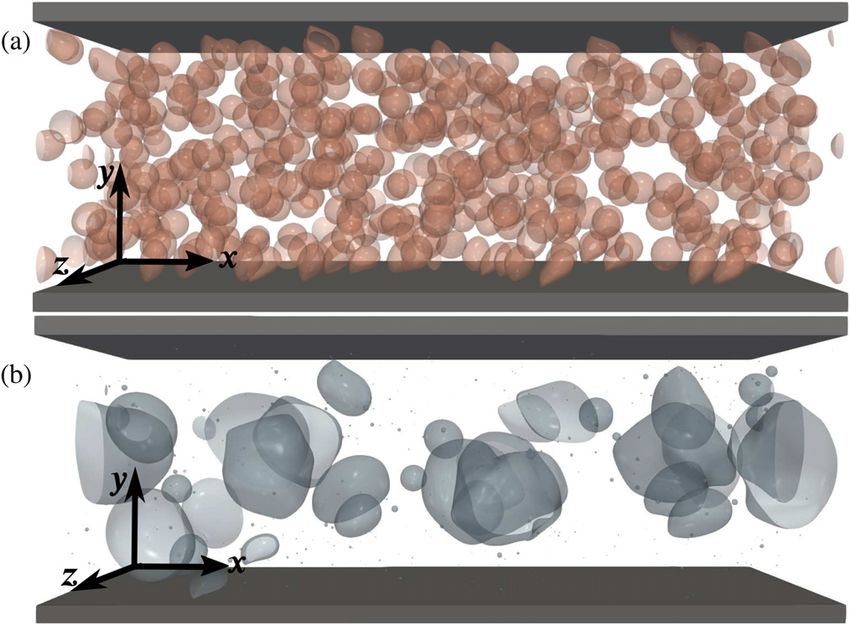
converge to steady-state more rapidly than the smaller capillary num- flow, and we start by analyzing the second-order statistics of the flow,
ber runs (VOFb), i.e., the larger Ca0 runs show a higher rate of coales- which tell us how momentum is transferred across different parts of
cence, although the steady-state areas are roughly the same. This is in the channel. Figure 6 shows four of the six unique components of the
contrast with simulations of droplet coalescence in simple shear flow Reynolds stress tensor in wall units hu0i u0j iþ hu0i u0j ixzt =u2s , with the
in laminar condition by Shardt et al. (2013), which show droplet coa- single-phase (SP0) Reynolds stresses shown in black as reference. The
lescence occurring only below a critical Ca0. However, as we shall dis- coalescing droplets simulations (VOF) show little change in stresses
cuss in the next paragraph, the Ca0 ¼ 0:1 droplets are more tightly relative to single-phase flow. Going from single phase to the non-
confined in the channel center than the Ca0 ¼ 0:05 droplets, thus coalescing droplets, however, we see a reduction in the streamwise
leading to a higher rate of coalescence. velocity fluctuations hu02 iþ , and an increase in the wall-normal hv02 iþ
Figure 5 shows how the volume fraction of the dispersed phase / and spanwise hw02 iþ velocity fluctuations. This shows that the isotropy
depends on the distance y from the channel walls. The coalescing of the turbulent flow has increased due to the presence of non-
droplet profiles (VOF) clearly show a single peak at the channel center, coalescing droplets. A similar effect has been observed for particle-
y ¼ L: this peak arises as the droplets are driven toward the region of laden turbulent channel flows, see, e.g., Picano et al. (2015), in which
lowest shear (y ¼ L) by a “deformation-induced lift force” (Raffiee particles redistribute energy to a “more isotropic state,” inducing an
et al., 2017; Hadikhani et al., 2018; Alghalibi et al., 2019). Confinement overall drag increase growing with the volume fraction of the dispersed
in the channel center leads to coalescence and the formation of large phase. We infer that non-coalescing droplets have a back-reaction on
droplets, as seen in Fig. 1(b). the flow comparable to that of rigid particles, producing an increase in
The FT droplets cannot coalesce, and the droplet–droplet interac- isotropy, which correlates with an increase in drag. On the other hand,
tion produces a volume effect, which forces them to spread across the coalescing droplets produce a weaker back reaction on the flow, which
channel: this manifests as an almost flat volume fraction in the region shows little change in isotropy or drag.
0:5L < y < L in Fig. 5. Also, we see that the volume fraction tends to When compared to the other components of the Reynolds
zero for y < R ¼ L=8, as surface tension preserves the droplet radius stresses, the shear stress hu0 v0 iþ shows only a small change due to the
R, and prevents the droplets from fully conforming with the flat chan- presence of droplets. However, as we shall see next, this shear stress
nel walls. For all but one of the non-coalescing droplet runs plotted in opposes the pressure gradient in the channel, producing a profound
Fig. 5, h/ixzt has a local maximum near the wall, in the region impact on the drag. The full shear stress balance for the multiphase
0:15L < y < 0:3L. This phenomenon is due to the “shear-gradient lift problem under investigation can be obtained as follows. We start by
force,” which is known to act on particles in curved velocity profiles taking average of the streamwise (i ¼ 1) component of Eq. (1),
(Ho and Leal, 1974; Martel and Toner, 2014; Hadikhani et al., 2018;
Alghalibi et al., 2019). Due to the curvature of the velocity profiles hðqu1 Þ;t þ ðqu1 uj Þ;j Þixzt ¼ hðqu1;j þ quj;1 Þ;j ixzt hp;1 ixzt
shown in Fig. 2, the droplets experience different flow velocities on þ hGd11 ixzt þ hcjn1 dS ðxÞixzt : (6)
each side, resulting in a lift force toward the wall. From Fig. 5, we also
notice that the more deformable droplets (FT3a, FT5a, and FT10a) In fully developed turbulent channel flows, most of these terms aver-
produce a maximum, which is further from the wall: this is mainly age to zero, and the equation simplifies to
due to (i) an increase in the deformation-induced lift force, and to (ii) hqu0 v0 ixzt;y ¼ hqu;y ixzt;y þ G þ hcjn1 dS ðxÞixzt ; (7)
a greater elongation of the droplets in the shear direction, producing a
wider wall layer. where we have moved from the index notation ðu1 ; u2 ; u3 Þ to (u, v, w)
for the sake of clarity. Hereafter, for brevity we omit the subscripts xzt
FIG. 5. Dependence of the mean volume fraction of droplets h/ixzt on the distance
y from the channel wall. Each run is plotted using the color and marker listed in
Table I. The profiles are symmetric about the centerline (y ¼ L), so we have plotted FIG. 6. Variation of Reynolds stresses with the distance yþ from the channel walls.
runs with non-coalescing (FT), and coalescing (VOF) droplets on the left and right, Stresses for run SP0 are shown by solid black lines. For runs with droplets, the dif-
respectively. Note that for the runs with coalescing droplets, h/ixzt peaks in the ference between the Ca0 ¼ 0:1 and Ca0 ¼ 0:05 stress is shaded in color. The
channel center, whereas for the non-coalescing droplet runs, h/ixzt shows a peak Reynolds stress components exhibit higher isotropy in the non-coalescing droplet
near the wall. runs (FT) than in the coalescing runs (VOF).
Phys. Fluids 33, 085112 (2021); doi: 10.1063/5.0058632 33, 085112-6
C Author(s) 2021
VPhysics of Fluids ARTICLE scitation.org/journal/phf
on angled brackets. Integrating from the wall y ¼ 0, to y ¼ n, we
obtain
ðn
y¼n
Gn ¼ hlu;y i hqu0 v0 i y¼0 þ hcjn1 dS ðxÞidy: (8)
0
The non-penetration boundary conditions at the walls enforce v0 ¼ 0
and with n1 ¼ 0 at the wall, the lower limit of the right hand side is
hlu;y ijy¼0 ¼ sw ¼ GL by the definition of the wall shear stress. We
relabel y ¼ n and obtain
ðy
GðL yÞ ¼ hlu;y i hqu0 v0 i þ hcjn1 dS ðxÞidy: (9)
0
By dividing the equation by sw, we obtain the following dimensionless
expression for the shear stress budget in the channel,
1 y=L ¼ sþ þ þ
þ sRe þ sr ; (10)
where
sþ
hlu;y i=sw ; (11)
sþ
Re
0 0
hqu v i=sw ; and (12)
ðy
þ FIG. 7. (a) The balance of shear stresses as a function of the distance y from the
sr hcjn1 dS ðxÞidy=sw (13) channel wall. The dashed line is the total stress budget. Stresses for run SP0 are
0 shown by solid black lines. The differences between VOF10a and VOF10b stresses
are shown in shades of blue, whereas the differences between FT10a and FT10b
are the viscous, Reynolds, and interfacial shear stresses, respectively. stresses are shown in shades of orange. We see that sþ r peaks near the wall for
Here, we calculate the viscous stress and Reynolds stress using the runs with non-coalescing droplets (FT), but is spread across the channel for the
Eqs. (11) and (12), while the interfacial stress is calculated as the coalescing runs (VOF). The different stress distributions across the channel ulti-
remaining part of the total budget in Eq. (10). (Assuming that the mately lead to different values of drag for coalescing and non-coalescing droplets.
þ
(b) Mean shear stresses for all runs. The stacked bars are hsþ iy ; hsRe iy , and
volume fraction / is uncorrelated with the flow, we can separate hsþr iy from bottom to top.
the averages of the material properties and the flow velocity. To test
our assumption, we measured the correlations hqu;y i hqihui; y
and hqu0 v0 i hqihu0 v0 i for each of the FT runs and found that the
error in shear stress was always less than 3.5% of sw.) and kinetic energy generation. The enhanced sþ r close to the wall is
Figure 7(a) shows the balance of shear stresses from the channel compensated in the budget by a reduction in sþ for the cases of non-
wall (y ¼ 0) to the center (y ¼ L). In agreement with previous works coalescing droplets.
(Pope, 2000), the single-phase run (SP0) produces a viscous stress sþ ,
The averaged stresses are shown for all runs in Fig. 7(b). The
þ
which is the highest near the wall where the shear rate is maximum, mean stresses are calculated by integrating sþ þ
; sRe , and sr in the wall-
and a Reynolds stress sþ Re dominates for y > 0:1L, where turbulent
normal direction y from 0 to L, for example,
fluctuations abound. ð
1 L þ
The coalescing droplet runs (VOF) in Fig. 7(a) have an interfacial hsþ i
y s dy: (14)
stress sþ L 0
r , which peaks around y ¼ 0:5L. This stress occurs due to the
droplet interfaces, which resist the deforming effects of turbulent fluc- þ
tuations, at the detriment of the Reynolds stress. Note that sþ The averaged form of Eq. (10) is 0:5 ¼ hsþ þ
iy þ hsRe iy þ hsr iy , show-
r is larger
for the smaller capillary number case (VOF10b compared to ing the averaged stresses are also in balance with the wall stress budget.
VOF10a), because the surface tension coefficient c is larger, so surface We observe that for coalescing droplets, the dispersed fluid produces
tension forces are larger. an interfacial stress hsþ iy , which is entirely compensated by a reduc-
The non-coalescing droplet runs (FT) in Fig. 7(a), on the other tion in Reynolds stress hsþ Re iy , with very little change in the viscous
hand, have very little interfacial stress sþ stress hsþ
iy . However, in the case of non-coalescing droplets the
r above y > 0.5: instead, the
peak of sþ increase in interfacial stress hsþ r iy is compensated by a reduction in
r occurs at roughly the same wall-normal location y as the
peak in the volume fraction h/ixzt seen in Fig. 5. In both Figs. 5 and 7, both the Reynolds stress hsþ þ
Re iy , and the viscous stress hs iy .
the peak moves away from the wall when capillary number increases. For the single-phase case, the dynamic viscosity l is constant
A similar trend is also observed for the location of the maximum tur- throughout the channel, so the mean viscous stress is proportional to
bulent kinetic energy production (not shown here). The correlation of the centerline velocity,
y locations for these three statistics suggests that the “wall layering” ðL
and “shear-gradient lift forces” discussed above, which produce a peak 1 l dhuixzt l y¼L l
hsþ
iy ¼ dy ¼ huixzt y¼0 ¼ ucen ; (15)
in h/ixzt near the channel wall, are also responsible for sþ L sw dy Lsw Lsw
r generation 0
Phys. Fluids 33, 085112 (2021); doi: 10.1063/5.0058632 33, 085112-7
C Author(s) 2021
VPhysics of Fluids ARTICLE scitation.org/journal/phf
and hence, the variation of hsþ iy can be used to quantify drag in the Our findings can help to better understand and control multi-
channel, with a larger/smaller hsþ iy corresponding to drag reduction/ phase flows in a variety of applications, such as arteries, pipelines, or
increase. For the multiphase problem, dynamic viscosity is different ships. Through numerical experiments, we have been able to fully
for the carrier phase and dispersed phases, and we should integrate characterize the effect of coalescence alone, without the interference of
dhluixzt =dy to the centerline, so the relationship between centerline other mechanisms, which often arise in experiments with surfactants.
velocity and hsþ iy is not exactly linear. However, due to the low vol-
How these results are affected by surfactant concentrations will be the
ume fraction and low changes in viscosity, we found that considering topic of future research.
the variation of the material properties (q, l) and variation of the fluid
velocity as independent produces only small changes in the averaged ACKNOWLEDGMENTS
statistics. Hence, we can still relate the viscous stress to the centerline
velocity and, thus, to the drag changes in the multiphase simulations. The authors acknowledge computer time provided by the
Indeed, the three runs with the smallest bulk velocity uþ Swedish National Infrastructure for Computing (SNIC) and by the
b in the inset of
Fig. 2 are FT10b, FT5b, and FT3b, and the three runs with the smallest Scientific Computing Section of Research Support Division at
mean viscous stress hsþ OIST. M.E.R. was supported by the JSPS KAKENHI Grant No.
iy are also FT10b, FT5b, and FT3b [Fig. 7(b)].
Based on the above discussion, we can now relate the increased drag JP20K22402. O.T. was supported by Swedish Research Council
for non-coalescing droplets to the wall normal location of the droplets: Grant No. VR 2017–0489.
the non-coalescing droplets in runs FT10b, FT5b, and FT3b encroach DATA AVAILABILITY
into the viscous wall region and oppose the shearing flow, reducing The data that support the findings of this study are openly avail-
the viscous shear stress and thereby increasing drag. able in OIST at https://groups.oist.jp/cffu/cannon2021pof, Cannon
V. CONCLUSIONS et al. (2021).
We perform direct numerical simulations of coalescing and non-
coalescing droplets in turbulent channel flows to single out the effect REFERENCES
of coalescence. Coalescing droplets are simulated using the volume-of- Ahmed, Z., Izbassarov, D., Costa, P., Muradoglu, M., and Tammisola, O.,
fluid method, and non-coalescing droplets with the front-tracking “Turbulent bubbly channel flows: Effects of soluble surfactant and
viscoelasticity,” Comput. Fluids 212, 104717 (2020).
method. We find that the droplets that are non-coalescing and less
Alghalibi, D., Rosti, M. E., and Brandt, L., “Inertial migration of a deformable
deformable produce an increase in drag, whereas the other droplets do particle in pipe flow,” Phys. Rev. Fluids 4, 104201 (2019).
not. We explained this by looking at the wall-normal location of drop- Balachandar, S., and Eaton, J. K., “Turbulent Dispersed Multiphase Flow,” Annu.
lets in the channel: the coalescing droplets experience a deformation- Rev. Fluid Mech. 42, 111–133 (2010).
induced lift force, which drives them away from the shearing flow near Bolotnov, I. A., “Influence of bubbles on the turbulence anisotropy,” J. Fluids
the wall, out of the viscous sublayer; this is possible due to the coales- Eng. 135, 051301 (2013).
Bolotnov, I. A., Jansen, K. E., Drew, D. A., Oberai, A. A., Lahey, R. T., and
cence, which allows droplets to accumulate at the centerline. On the Podowski, M. Z., “Detached direct numerical simulations of turbulent two-
other hand, the non-coalescing droplets do not; indeed, non- phase bubbly channel flow,” Int. J. Multiphase Flow 37, 647–659 (2011).
coalescing droplets roughly behave as particles, uniformly distributing Brackbill, J. U., Kothe, D. B., and Zemach, C., “A continuum method for model-
across the channel, forming a wall layer, and increasing the isotropy of ing surface tension,” J. Comput. Phys. 100, 335–354 (1992).
the flow. In this case, droplets remain in the viscous sublayer, generat- Cannon, I., Izbassarov, D., Tammisola, O., Brandt, L., and Rosti, M. E., “The
effect of droplet coalescence on drag in turbulent channel flows,” in
ing an interfacial shear stress, which reduces the budget for viscous
Cannon2021POF (OIST, 2021).
shear stress in the channel. From Eq. (15), we relate a reduction in the Ceccio, S. L., “Friction drag reduction of external flows with bubble and gas
viscous shear stress to a reduction in the centerline velocity and ulti- injection,” Annu. Rev. Fluid Mech. 42, 183–203 (2010).
mately to an increase in drag. Chen, N., Kuhl, T., Tadmor, R., Lin, Q., and Israelachvili, J., “Large deformations
Our results agree well with the experiments carried out by during the coalescence of fluid interfaces,” Phys. Rev. Lett. 92, 024501 (2004).
Descamps et al. (2008), who found that larger bubbles produce less Dabiri, S., Lu, J., and Tryggvason, G., “Transition between regimes of a vertical
channel bubbly upflow due to bubble deformability,” Phys. Fluids 25, 102110
drag; in our study, large droplets are obtained through coalescence
(2013).
and, indeed, produce less drag. Our proposed mechanism for drag Dabiri, S., and Tryggvason, G., “Heat transfer in turbulent bubbly flow in vertical
increase is also similar to that proposed by Dabiri et al. (2013), who channels,” Chem. Eng. Sci. 122, 106–113 (2015).
showed that less deformable bubbles enter the viscous sublayer, lead- Descamps, M. N., Oliemans, R. V. A., Ooms, G., and Mudde, R. F., “Air–water
ing to an increase in viscous dissipation and an increase in drag. We flow in a vertical pipe: Experimental study of air bubbles in the vicinity of the
offer two main developments. First, we extend the study to coalescing wall,” Experiments Fluids 45, 357–370 (2008).
De Vita, F., Rosti, M. E., Caserta, S., and Brandt, L., “On the effect of coalescence
droplets. Second, we believe that viscous shear stress is a better predic- on the rheology of emulsions,” J. Fluid Mech. 880, 969–991 (2019).
tor of drag than viscous dissipation, as the proportionality between the De Vita, F., Rosti, M. E., Caserta, S., and Brandt, L., “Numerical simulations of vor-
mean viscous shear stress and centerline velocity [Eq. (15)] is exact for ticity banding of emulsions in shear flows,” Soft Matter 16, 2854–2863 (2020).
single-phase channel flows and only slightly affected by the change in Dodd, M., and Ferrante, A., “A fast pressure-correction method for incompress-
material properties. Although we made simulations at a density ratio ible two-fluid flows,” J. Comput. Phys. 273, 416–434 (2014).
Dodd, M. S., and Ferrante, A., “On the interaction of Taylor length scale size
of qc =qd ¼ 50, which is greater than that of oil in water (qwater =qoil
droplets and isotropic turbulence,” J. Fluid Mech. 806, 356–412 (2016).
1:5), but less than that of air in water (qwater =qair 830), compari- Dong, S., and Shen, J., “A time-stepping scheme involving constant coefficient
son with the experimental literature suggests that our current qualita- matrices for phase-field simulations of two-phase incompressible flows with
tive conclusions still hold for these flows. large density ratios,” J. Comput. Phys. 231, 5788–5804 (2012).
Phys. Fluids 33, 085112 (2021); doi: 10.1063/5.0058632 33, 085112-8
C Author(s) 2021
VPhysics of Fluids ARTICLE scitation.org/journal/phf
Druzhinin, O. A., and Elghobashi, S., “Direct numerical simulations of bubble- Perlekar, P., Biferale, L., Sbragaglia, M., Srivastava, S., and Toschi, F., “Droplet
laden turbulent flows using the two-fluid formulation,” Phys. Fluids 10, size distribution in homogeneous isotropic turbulence,” Phys. Fluids 24,
685–697 (1998). 065101 (2012).
Duineveld, P., “Bouncing and coalescence of bubble pairs rising at high Reynolds Picano, F., Breugem, W.-P., and Brandt, L., “Turbulent channel flow of dense sus-
number in pure water or aqueous surfactant solutions,” Appl. Sci. Res. 58, pensions of neutrally buoyant spheres,” J. Fluid Mech. 764, 463–487 (2015).
409–439 (1997). Pope, S. B., Turbulent Flows (Cambridge University Press, 2000).
Einstein, A., “Die Grundlage der allgemeinen Relativit€atstheorie,” Ann. Phys. Popinet, S., “Numerical models of surface tension,” Annu. Rev. Fluid Mech. 50,
354, 769–822 (1916). 49–75 (2018).
Elghobashi, S., “Direct numerical simulation of turbulent flows laden with drop- Puckett, E. G., Almgren, A. S., Bell, J. B., Marcus, D. L., and Rider, W. J., “A high-
lets or bubbles,” Annu. Rev. Fluid Mech. 51, 217–244 (2019). order projection method for tracking fluid interfaces in variable density incom-
Esmaeeli, A., and Tryggvason, G., “Direct numerical simulations of bubbly flows. pressible flows,” J. Comput. Phys. 130, 269–282 (1997).
Part 1. Low Reynolds number arrays,” J. Fluid Mech. 377, 313–345 (1998). Raffiee, A. H., Dabiri, S., and Ardekani, A. M., “Elasto-inertial migration of
Esmaeeli, A., and Tryggvason, G., “Direct numerical simulations of bubbly flows deformable capsules in a microchannel,” Biomicrofluidics 11, 064113 (2017).
Part 2. Moderate Reynolds number arrays,” J. Fluid Mech. 385, 325–358 Rider, W. J., and Kothe, D. B., “Reconstructing volume tracking,” J. Comput.
(1999). Phys. 141, 112–152 (1998).
Farooqi, M. N., Izbassarov, D., Muradoglu, M., and Unat, D., “Communication Roccon, A., De Paoli, M., Zonta, F., and Soldati, A., “Viscosity-modulated
analysis and optimization of 3D front tracking method for multiphase flow breakup and coalescence of large drops in bounded turbulence,” Phys. Rev.
simulations,” Int. J. High Perform. Comput. Appl. 33, 67–80 (2019). Fluids 2, 083603 (2017).
Frumkin, A., and Levich, V. G., “On surfactants and interfacial motion,” Z. Fiz. Rosti, M. E., and Brandt, L., “Increase of turbulent drag by polymers in particle
Khim. 21, 1183–1204 (1947) (in Russian), see https://ci.nii.ac.jp/naid/ suspensions,” Phys. Rev. Fluids 5, 041301 (2020).
10028205328/. Rosti, M. E., De Vita, F., and Brandt, L., “Numerical simulations of emulsions in
Hadikhani, P., Hashemi, S. M. H., Balestra, G., Zhu, L., Modestino, M. A., shear flows,” Acta Mech. 230, 667–682 (2019).
Gallaire, F., and Psaltis, D., “Inertial manipulation of bubbles in rectangular Rosti, M. E., Ge, Z., Jain, S. S., Dodd, M. S., and Brandt, L., “Droplets in homoge-
microfluidic channels,” Lab Chip 18, 1035–1046 (2018). neous shear turbulence,” J. Fluid Mech. 876, 962–984 (2019).
Ho, B. P., and Leal, L. G., “Inertial migration of rigid spheres in two-dimensional Scarbolo, L., Bianco, F., and Soldati, A., “Coalescence and breakup of large drop-
unidirectional flows,” J. Fluid Mech. 65, 365–400 (1974). lets in turbulent channel flow,” Phys. Fluids 27, 073302 (2015).
Ii, S., Sugiyama, K., Takeuchi, S., Takagi, S., Matsumoto, Y., and Xiao, F., “An Shardt, O., Derksen, J. J., and Mitra, S. K., “Simulations of droplet coalescence in
interface capturing method with a continuous function: The THINC method
simple shear flow,” Langmuir 29, 6201–6212 (2013).
with multi-dimensional reconstruction,” J. Comput. Phys. 231, 2328–2358
Soligo, G., Roccon, A., and Soldati, A., “Breakage, coalescence and size distribution of
(2012).
surfactant-laden droplets in turbulent flow,” J. Fluid Mech. 881, 244–282 (2019).
Innocenti, A., Jaccod, A., Popinet, S., and Chibbaro, S., “Direct numerical simula-
Takagi, S., and Matsumoto, Y., “Surfactant effects on bubble motion and bubbly
tion of bubble-induced turbulence,” J. Fluid Mech. 918, A23 (2021).
flows,” Annu. Rev. Fluid Mech. 43, 615–636 (2011).
Izbassarov, D., and Muradoglu, M., “A front-tracking method for computational
Takagi, S., Ogasawara, T., and Matsumoto, Y., “The effects of surfactant on the mul-
modeling of viscoelastic two-phase flow systems,” J. Non-Newtonian Fluid
tiscale structure of bubbly flows,” Philos. Trans. R. Soc. A 366, 2117–2129 (2008).
Mech. 223, 122–140 (2015).
Takeuchi, S., and Tryggvason, G., “Volume conservation method for the three-
Kim, J., and Moin, P., “Application of a fractional-step method to incompressible
dimensional front-tracking method,” Mech. Eng. Lett. 6, 20 (2020).
Navier-Stokes equations,” J. Comput. Phys. 59, 308–323 (1985).
Thomas, S., Esmaeeli, A., and Tryggvason, G., “Multiscale computations of thin
Komrakova, A. E., Eskin, D., and Derksen, J. J., “Numerical study of turbulent
films in multiphase flows,” Int. J. Multiphase Flow 36, 71–77 (2010).
liquid-liquid dispersions,” AIChE J. 61, 2618–2633 (2015).
Tryggvason, G., Bunner, B., Esmaeeli, A., Juric, D., Al-Rawahi, N., Tauber, W.,
Leonard, B. P., “A stable and accurate convective modelling procedure based on
quadratic upstream interpolation,” Comput. Methods Appl. Mech. Eng. 19, Han, J., Nas, S., and Jan, Y. J., “A front-tracking method for the computations
59– 98 (1979). of multiphase flow,” J. Comput. Phys. 169, 708–759 (2001).
Levich, V. G., Physicochemical Hydrodynamics (Prentice-Hall, Englewood Cliffs, Tryggvason, G., Dabiri, S., Aboulhasanzadeh, B., and Lu, J., “Multiscale consider-
New Jersy, 1962). ations in direct numerical simulations of multiphase flows,” Phys. Fluids 25,
Lu, J., Biswas, S., and Tryggvason, G., “A DNS study of laminar bubbly flows in a 031302 (2013).
vertical channel,” Int. J. Multiphase Flow 32, 643–660 (2006). Tryggvason, G., and Lu, J., “Direct numerical simulations of bubbly flows,” Mech.
Lu, J., Muradoglu, M., and Tryggvason, G., “Effect of insoluble surfactant on tur- Eng. Rev. 2, 15 (2015).
bulent bubbly flows in vertical channels,” Int. J. Multiphase Flow 95, 135–143 Tryggvason, G., Ma, M., and Lu, J., “DNS–Assisted modeling of bubbly flows in
(2017). vertical channels,” Nucl. Sci. Eng. 184, 312–320 (2016).
Lu, J., and Tryggvason, G., “Direct numerical simulations of multifluid flows in a Tryggvason, G., Scardovelli, R., and Zaleski, S., Direct Numerical Simulations of
vertical channel undergoing topology changes,” Phys. Rev. Fluids 3, 084401 Gas-Liquid Multiphase Flows (Cambridge University Press, Cambridge, UK, 2011).
(2018). Unverdi, S. O., and Tryggvason, G., “A front-tracking method for viscous, incom-
Lu, J., and Tryggvason, G., “Multifluid flows in a vertical channel undergoing pressible, multi-fluid flows,” J. Comput. Phys. 100, 25–37 (1992).
topology changes: Effect of void fraction,” Phys. Rev. Fluids 4, 084301 (2019). von Karman, T., “Mechanische Ahnlichkeit und Turbulenz,” Math. Phys. Klasse
Martel, J. M., and Toner, M., “Inertial focusing in microfluidics,” Annu. Rev. 5, 58–76 (1930).
Biomed. Eng. 16, 371–396 (2014). Xiao, F., Honma, Y., and Kono, T., “A simple algebraic interface capturing
Maxey, M. R., “Droplets in turbulence: A new perspective,” J. Fluid Mech. 816, scheme using hyperbolic tangent function,” Int. J. Numer. Methods Fluids 48,
1–4 (2017). 1023–1040 (2005).
Muradoglu, M., and Tryggvason, G., “Simulations of soluble surfactants in 3D Yokoi, K., “Efficient implementation of THINC scheme: A simple and practical
multiphase flow,” J. Comput. Phys. 274, 737–757 (2014). smoothed VOF algorithm,” J. Comput. Phys. 226, 1985–2002 (2007).
Noh, W. F., and Woodward, P., “SLIC (simple line interface calculation),” in Youngs, D. L., “Time-dependent multi-material flow with large fluid distortion,”
Proceedings of the Fifth International Conference on Numerical Methods in in Numerical Methods for Fluid Dynamics, edited by K. W. Morton and M. J.
Fluid Dynamics, Twente University, Enschede, 28 June–2 July 1976, Lecture Baines (Academic Press, New York, 1982), pp. 273–285.
Notes in Physics, edited by A. I. van de Vooren and P. J. Zandbergen (Springer, Youngs, D., “An interface tracking method for a 3D Eulerian hydrodynamics
Berlin, Heidelberg, 1976), pp. 330–340. code,” Technical Report No. 44/92/35 (AWRE, 1984).
Phys. Fluids 33, 085112 (2021); doi: 10.1063/5.0058632 33, 085112-9
C Author(s) 2021
VYou can also read