The effect of COVID certicates on vaccine uptake, health outcomes, and the economy
←
→
Page content transcription
If your browser does not render page correctly, please read the page content below
The effect of COVID certi cates on vaccine uptake, health outcomes, and the economy Miquel Oliu-Barton ( oliubart@gmail.com ) Bary SR Pradelski ( bary.pradelski@cnrs.fr ) Nicolas Woloszko Lionel Guetta-Jeanrenaud Philippe Aghion Patrick Artus Arnaud Fontanet Philippe Martin Guntram B Wolff Research Article Keywords: COVID-19, COVID certi cates, health policy Posted Date: January 18th, 2022 DOI: https://doi.org/10.21203/rs.3.rs-1242919/v2 License: This work is licensed under a Creative Commons Attribution 4.0 International License. Read Full License
The effect of COVID certificates on vaccine uptake, health outcomes, and the
economy a

Miquel Oliu-Barton b,c, Bary S.R. Pradelski d, Nicolas Woloszko e, with data analysis from Lionel Guetta-
Jeanrenaudc and guidance from Philippe Aghion f, Patrick Artus g, Arnaud Fontanet h, Philippe Martin i,
and Guntram B. Wolffc

Abstract. In the COVID-19 pandemic, governments have, among other measures,1,2 mandated the
use of COVID certificates to prove vaccination, recovery, or a recent negative test, and have required
them to access shops, restaurants, schools, universities, or workplaces.3 While arguments for and
against COVID certificates have focused on reducing transmission and ethical concerns,4,5 the
incentive effect of COVID certificates on vaccine uptake, health outcomes, and the economy has not
yet been investigated. To estimate this effect, we construct counterfactuals based on innovation
diffusion theory6 for France, Germany, and Italy. We estimate that the announcement of COVID
certificates during summer 2021 led to increased vaccine uptake in France of 13.0 (95% CI 9.7–14.9)
percentage points (p.p.) of the total population up to the end of the year, in Germany 6.2 (2.6–6.9)
p.p., and in Italy 9.7 (5.4–12.3) p.p. Further, this averted an additional 3,979 (3,453–4,298) deaths in
France, 1,133 (-312–1,358) in Germany, and 1,331 (502–1,794) in Italy; and prevented gross
domestic product (GDP) losses of €6.0 (5.9–6.1) billion in France, €1.4 (1.3–1.5) billion in Germany,
and €2.1 (2.0–2.2) billion in Italy. Notably, the application of COVID certificates substantially reduced
the pressure on intensive care units (ICUs) and, in France, averted occupancy levels being exceeded
where prior lockdowns were instated. Varying government communication efforts and restrictions
associated with COVID certificates may explain country differences, such as the smaller effect in
Germany. Overall, our findings are more sizeable than predicted.7 This analysis may help inform
decisions about when and how to employ COVID certificates to increase vaccine uptake and thus
avoid stringent interventions, such as closures, curfews, and lockdowns, with major social and
economic consequences.

Introduction

The COVID-19 pandemic has forced many governments to implement previously unthinkable policies.
Initially, while some countries aimed to eliminate the virus, others aimed to slow its spread to protect
health systems and to gain time until vaccines or treatment became widely available.8,9 Public health
measures intended to reduce transmissions have included public venue closures, limitations on social
contacts, and travel restrictions. These measures are informed by mathematical simulations10-12 and
by analyses estimating their causal effects on the dynamics of the epidemic.13,14 COVID certificates –
certifying vaccination, recovery, or a recent negative test – enable, through digitisation, targeted
interventions dependent on an individual’s risk of transmitting the virus or experiencing a severe form
of the disease. As with other policy choices, the use of COVID certificates has often been questioned
for ethical and political reasons,4,5 while advocates have mainly focused on the potential to help
control the spread of the virus.15 We argue that their incentive effect on vaccine uptake may be most
critical. As vaccines are increasingly available, hesitancy and refusal to be vaccinated have become
the main obstacles to high vaccine coverage in many parts of the world.16-18 Historically, policy-
makers have considered several options to increase vaccine uptake, ranging from communication and

a Preprint: doi:10.21203/rs.3.rs-1242919/v1.
b Université Paris-Dauphine, France.
c Bruegel, Belgium.
d National Centre for Scientific Research (CNRS), France, and Oxford-Man Institute of Quantitative Finance

(University of Oxford), UK.
e OECD.
f Collège de France and INSEAD, France.
g Natixis and Paris School of Economics, France.
h Institut Pasteur and Conservatoire National des Arts et Métiers, France.
i Sciences Po and CEPR, France.

 1
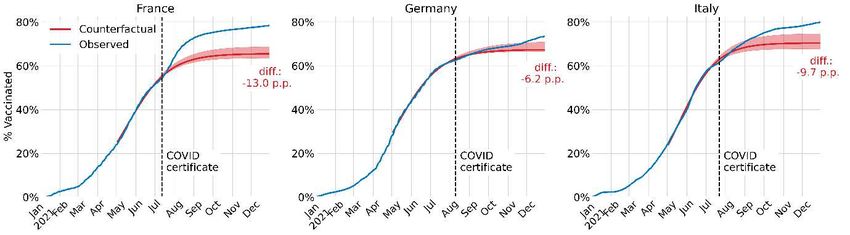
outreach strategies to monetary (dis)incentives and mandates.19 The impact of COVID certificates on
vaccine uptake, health outcomes, and the economy has not yet been investigated.

In Europe, the use of COVID certificates for travel was agreed upon within the European Union (EU)
in June 2021.20 Several member states, including France, Germany, and Italy, subsequently adopted
COVID certificates for many domestic activities. We focus on these countries as they introduced
COVID certificates at similar times to regulate entry to public venues, restaurants, cafes, bars, shops,
etc. (on 12 July 2021, 10 August 2021, and 22 July 2021, respectively; Methods A). The three
countries also have comparable per-capita vaccine supply21, demographics, health infrastructure, and
economies. Our objective is to measure how much the widespread use of COVID certificates
incentivised vaccine uptake, reduced adverse health outcomes, and strengthened the economy. This
study may thus help to inform decision-making on whether, when, and how to employ COVID
certificates.

COVID certificates spur vaccination

We estimate the COVID certificate’s contribution to vaccine uptake in France, Germany, and Italy by
constructing counterfactuals (i.e., by modelling vaccine uptake without this intervention), using
innovation diffusion theory.6 Innovation diffusion theory was introduced to model how new ideas and
technologies spread6 and, among other applications, has been used to study the uptake of medical
innovations,22 in particular vaccines.23 The theory captures the way in which an innovation – the
vaccine – is gradually taken up by a population, with early adopters subsequently joined by
followers.24 Mathematically, the model relies on growth theory with capacity limits and two critical
parameters. On the one hand, the ‘coefficient of innovation’ is the instantaneous rate at which a non-
vaccinated person opts to get vaccinated, independent of how many people are already vaccinated.
On the other hand, the ‘coefficient of imitation’ is the rate at which a non-vaccinated person is
influenced by the share of vaccinated people in their decision to get vaccinated. This micro-founded
model has been widely used due to its tractability and interpretability (Methods B).25

Findings. The effects of COVID certificates on vaccine uptake turned out to be sizeable (Fig. 1). On
the day of their announcements, in France, 53.8% of the population had received at least one dose of
a COVID-19 vaccine, in Germany 62.5%, and in Italy 61.6%. By the end of 2021, the first-dose
vaccine uptake had risen to 78.2%, 73.5%, and 80.1%, respectively. How much of this increase can
be attributed to COVID certificates? To answer this question, we estimate the counterfactual without
COVID certificates to be approximately 65.2% in France, 67.3% in Germany, and 70.4% in Italy
(Methods B). More precisely, we attribute 13.0 (95% CI 9.7–14.9) percentage points (p.p.) of vaccine
uptake for France, 6.2 (2.6–6.9) p.p. for Germany, and 9.7 (5.4–12.3) p.p. for Italy to the incentives
created by COVID certificates. All three countries further extended the use of COVID certificates in
the months following their adoption, ranging from their requirement in workplaces to the integration of
a booster dose. Our estimates include the incentives created by these additional extensions. The
overall effect is significant in France and Italy, but only from end of November 2021 onwards in
Germany, when the use of COVID certificates was extended to workplaces (Fig. 1). The results are in
line with studies analysing the immediate period after the intervention in various countries using cross-
country or state comparisons26-29, and are overall more substantial than previously predicted.7

 2
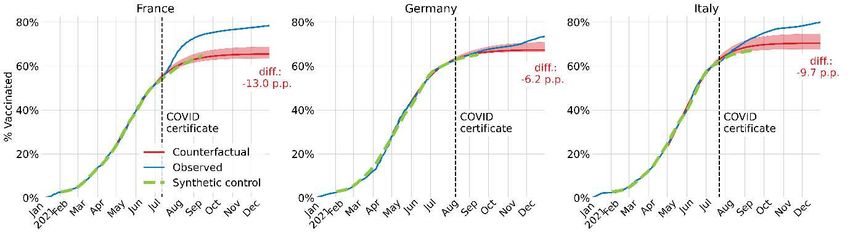
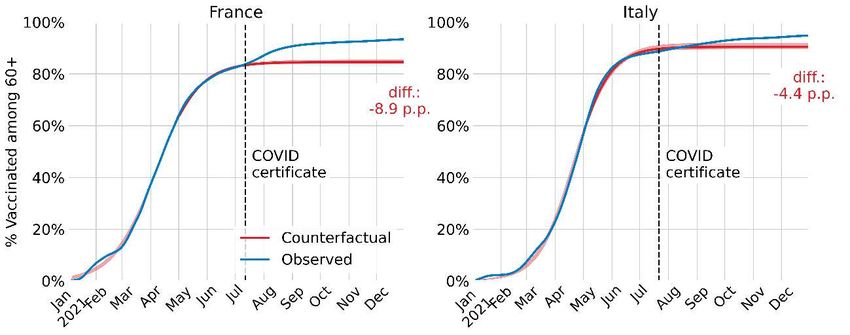
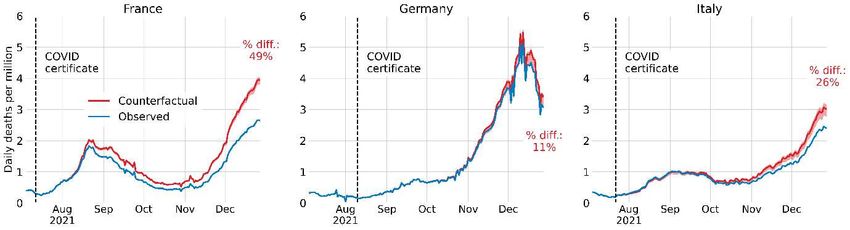
Figure 1: Estimated vaccine uptake with and without COVID certificates.

The cumulative share of the population who received at least one COVID-19 vaccine dose in the actual intervention deployment
(blue) and in the no-intervention counterfactual scenario (red). The red shaded area is the 95% confidence interval. The black
dashed vertical line is the date of the announcement of the COVID certificate.

Importantly, the effect of COVID certificates on vaccine uptake was also sizeable among the older
population. By the end of 2021, we attribute for France 8.9 (8.0–9.4) p.p. to the incentives created by
COVID certificates among the population over 60 years old, and for Italy 4.4 (2.9–5.2) p.p. (Methods
B). Germany did not publish age-dependent vaccine uptake statistics until mid-September 2021, so
we cannot build a counterfactual for vaccine uptake among the older population in Germany.

Our results are supported by the well-established econometric method of synthetic control.30 We
construct counterfactuals for each treated country based on a weighted average of countries that did
not implement the COVID certificate and find consistent trajectories for the time period where this
method is feasible, i.e., until the end of September 2021 (Methods B). Synthetic control offers a
valuable robustness check but has limitations in our context. The method requires a sufficiently large
control group, which becomes infeasible as more and more countries have adopted COVID
certificates. Further, synthetic control requires that the countries in the control group are not affected
by interventions in other countries, which is questionable given the interdependence of COVID-related
policies, and cross-border travel.

Impact of COVID certificates on health outcomes

The effectiveness of COVID-19 vaccines against hospitalisation, ICU admission, and death has been
well documented, including for the Delta variant, which was prevalent throughout the period of study.
We estimate the average effectiveness, considering the various vaccines and waning immunity, at
81% after one dose and 92% after two doses (Methods C).31-35 We focus on the direct protection
provided by vaccines, but omit the contribution of vaccines to reducing overall transmission and the
fact that COVID certificates may alter epidemic dynamics.

To estimate the impact of vaccine uptake on health outcomes, we construct counterfactuals for
second-dose vaccine uptake based on the observed lag between the first and second doses. Booster
uptake does not factor in our model, as, during the period under consideration, these were not
available to individuals who were not fully vaccinated before the announcement of the COVID
certificate. We consider age-stratified uptake estimates when available; in particular, this is the case
for France and Italy for deaths and for France for hospital admissions (Methods C).

Findings. We estimate the number of hospital admissions and deaths that would have occurred from
the announcement of COVID certificates until the end of 2021 (Methods C and Fig. 2). In France, an
additional 32,065 (26,566–35,306) hospital admissions would have occurred, in Germany 5,229 (-
1,774–6,822), and in Italy 8,735 (2,999–12,261). Additional deaths in France would have been 3,979
(3,453–4,298), in Germany 1,133 (-312–1358), and in Italy 1,331 (502–1,794). Thus, from the
introduction until the end of 2021, the expected number of hospital admissions (and deaths) would
have been 31.3% (31.7%) higher in France, 5.0% (5.6%) higher in Germany, and 15.5% (14.0%)

 3
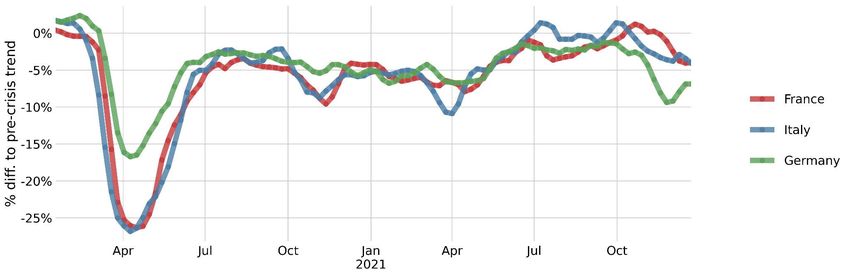
higher in Italy. Notably, the impact of additional vaccine uptake compounds over time, and while the
effect is significant for France and Italy over the entire period, it only becomes significant for Germany
by the end of November. In the last week of 2021, without the accumulated difference in vaccine
uptake, there would have been approximately 46% (49%) more hospital admissions (deaths) in
France, 14% (11%) more in Germany, and 29% (26%) more in Italy (Fig. 2).

Figure 2: Estimated hospital admissions and deaths with and without COVID certificates.

Daily hospital admissions (top row) and deaths (bottom row) per million (7-day rolling average) in the actual intervention
deployment (blue) and in the no-intervention counterfactual scenario (red). The red shaded area is the 95% confidence interval.
The daily death counterfactuals for France and Italy and the daily hospital admissions counterfactual for France are computed
using an age-stratified model. The other counterfactuals are not based on age-stratified models due to unavailable data. The
black dashed vertical line is the date of the announcement of the COVID certificate.

Impact of COVID certificates on economic activity

COVID certificates may spur economic recovery in the short run, as newly vaccinated people can
safely resume in-person economic activities, including working on-site, and consuming goods as well
as services in brick-and-mortar businesses (direct effect). Furthermore, an indirect effect results from
avoiding restrictions, through public health measures, on social, education, and economic activities.
Here, we conduct a quantitative analysis of the overall economic effect of COVID certificates based
on the weekly GDP estimates provided by the OECD Weekly Tracker.36 Resorting to a high-frequency
indicator of economic activity is necessary to exploit the weekly variations in vaccination rates to
identify the effect of vaccine uptake on economic activity. This paper innovates compared to previous
analyses,37 as the use of a high-frequency GDP proxy allows quantitative estimates of the economic
impact of variations in vaccination rates.

The impact of COVID certificates on the economy is modelled through its effect on vaccine uptake
and the elasticity of the latter to weekly GDP, using data from all OECD and G20 member countries
as used by the OECD Weekly Tracker (Methods D). The average effect of vaccination on GDP is
estimated using a closed-form model in which weekly GDP is regressed on first-dose vaccination,
lagged by a month to account for the time between first and second dose and time to full
effectiveness. In addition, health outcomes, also lagged by a month, are controlled for, as they may be
confounding factors influencing both vaccine uptake and GDP. Furthermore, we control for
vaccination and health outcomes of the main trade partners to avoid the possible confounding effect
of trade and other economic spillovers,37 and for average weekly temperature, which influences virus
diffusion.38 Finally, we add week and country fixed effects to control for any common seasonal effects

 4
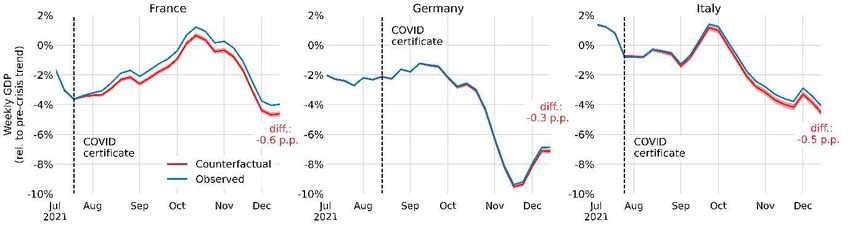
and any country-specific but time-invariant effects, such as demographic or geographical
characteristics.

Findings. The average effect of a 1 p.p. increase in the share of vaccinated people on weekly GDP
one month later is 0.052 (0.042–0.061) p.p. A complete vaccination roll-out would thus drive GDP up
by 5.2 p.p., which corresponds to approximately 85% of the loss observed in 2020. We estimate
counterfactual weekly GDP trajectories for France, Germany, and Italy based on estimated
counterfactual vaccine uptake (Fig. 3). By the end of 2021, without the policy intervention, weekly
GDP would have been 0.6 (0.5–0.8) % lower in France, 0.3 (0.1–0.4) % lower in Germany, and 0.5
(0.3 – 0.6) % lower in Italy, amounting to GDP losses across the second half of 2021 of €6.0 (5.9 –
6.1) billion in France, €1.4 (1.3–1.5) billion in Germany, and €2.1 (2.0–2.2) billion in Italy
(Methods D).

We corroborate our findings with robustness checks regarding the statistical method, the choice of lag
between vaccination and GDP, and the modelling assumption that the vaccine-GDP relationship did
not vary substantially across the considered time period (Methods D).

Figure 3: Estimated weekly GDP with and without COVID certificates.

Weekly GDP (3-week rolling average) in the actual intervention deployment (blue) and in the no-intervention counterfactual
scenario (red). The red shaded area is the 95% confidence interval. The black dashed vertical line is the date of the
announcement of the COVID certificate.

COVID certificates may have prevented lockdowns

By increasing vaccine uptake, COVID certificates reduced the number of patients in ICUs and thus
contributed to reducing the likelihood of stricter public measures, including lockdowns. While such
decisions are ultimately made by governments, their anticipation and perceived uncertainty are
harmful to the economy, also in the mid- and long-term.39 It is thus instructive to consider the evolution
of ICU patients over time and to use levels of previous lockdowns as benchmarks. We exclude the
first lockdowns from the analysis, as they represent unrealistic benchmarks for future government
action due to unprecedented uncertainty. In France, the number of COVID-19 patients in ICUs per
million was 44.9 when the second lockdown was announced (28 October 2020) and 74.8 when the
third lockdown was announced (31 March 2021). In Germany, it was 54.3 (second lockdown, 13
December 2020), in Italy 53.0 (second lockdown, 12 December 2020) and 60.2 (third lockdown, 27
March 2021).

Findings. By the end of 2021, in France, the number of COVID-19 patients in ICUs was 52.4 per
million. We estimate it would have been 76.1 (72.4–78.3) without the introduction of COVID
certificates, i.e., for the central estimate, an increase of 45% (Methods C). The policy intervention may
thus have been instrumental in preventing the high pressure on ICUs that prompted previous
lockdowns (Fig. 4). By contrast, the additional vaccine uptake in Germany was not sufficient to avert
high pressure on ICUs. Consequently, more stringent measures were adopted. Finally, COVID
certificates did not play a decisive role in Italy during the period under investigation, as the pressure
on ICUs would have remained at low levels even without the policy intervention.

 5
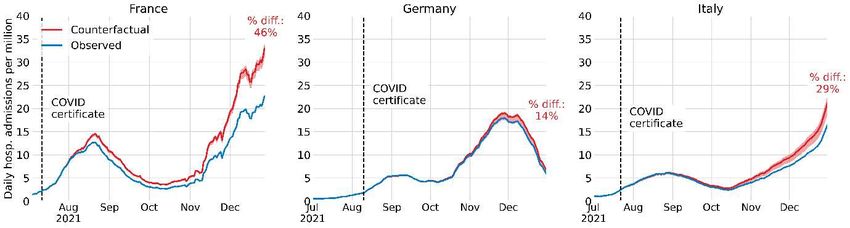
Figure 4: Estimated ICU patients with and without COVID certificates.

Daily COVID-19 patients in ICUs per million (7-day rolling average) in the actual intervention deployment (blue) and in the no-
intervention counterfactual scenario (red). The red shaded area is the 95% confidence interval. The counterfactual for France is
based on an age-stratified model. The other counterfactuals are not based on age-stratified models due to unavailable data.
Green horizontal lines indicate levels at which previous lockdowns were instated. The black dotted vertical line is the date of the
announcement of the COVID certificate.

Discussion

COVID certificates have had a sizeable, robust positive effect on vaccination rates, health
outcomes, and the economy in France, Germany, and Italy. In our analysis, we aimed to make
prudent assumptions on model inputs such as vaccine effectiveness and lags between infection
and health outcomes. In addition to the evaluated temporary effect, the incentives created by
COVID certificates may be lasting, as parts of the population might have remained unvaccinated
without the intervention.

Even though COVID certificates were introduced in similar contexts – i.e., the three largest EU
countries, at a time when vaccination campaigns were slowing down, and infections were
increasing rapidly – the magnitude of the impact varies significantly from one country to the other
and reversed previous trends associated with vaccine hesitancy, and lack of trust in science and
government.16-18, Understanding these differences deserves attention. Factors could be the various
ways in which COVID certificates were announced and the extent of their use. For example, the
announcements in France and Italy were particularly striking, as they were made by the central
governments and backed by clear and consistent communication, with COVID certificates being
required in most public venues all over the country. By contrast, COVID certificates were introduced
more gradually in Germany with different rules and enforcement levels across its federal states.
Further studies should complement our work by assessing the broader effect of COVID certificates
on the development of the epidemic. Additionally, long-term social and economic costs and benefits
need to be considered as more data will become available.

COVID certificates appear to be an attractive, more inclusive alternative to vaccine mandates,
focusing on the added benefits of getting vaccinated or tested rather than on punitive measures for
not doing so. As countries grapple with the highly contagious Omicron variant, COVID certificates
might play a decisive role in increasing and maintaining vaccine-induced protection. Nevertheless,
governments’ policy decisions on COVID certificates should also consider additional factors,
including supply of vaccines and tests, political trust, and accessibility for marginalised groups, in
order not to threaten social cohesion or exacerbate already existing inequities.4,40,41 Finally,
international coordination and mutual acceptance of COVID certificates are crucial to prevent
deepening the divide between different regions.3

Author contributions. MOB, BP, and NW designed the study, built the model, collected data,
finalised the analysis, interpreted the findings, and wrote the manuscript. LGJ collected and
analysed data. PAg, PAr, AF, PM, and GBW provided guidance, interpreted the findings, and
commented on and revised previous versions of this manuscript. All authors read and approved the

 6
final manuscript. The corresponding authors had full access to all the data used in the study and
had final responsibility for the decision to submit for publication.

Competing interests. AF is a member of the French COVID-19 Scientific Council and a member
of the French COVID-19 Vaccine Strategy Committee. PM chairs the French Council of Economic
Analysis, an independent council attached to the Prime Minister. GBW is a member of the G20
High Level Independent Panel on Financing the Global Commons for Pandemic Preparedness and
Response. The authors declare no other competing interests.

Methods
 A. Data sources
All data were retrieved in the first week of January 2022.

Health data. For all OECD and EU countries, the share of the population who received one dose of a
COVID-19 vaccine, two doses of a COVID-19 vaccine, hospital admissions per 1 million, daily ICU
patients per 1 million, daily deaths per 1 million, and population estimates have been retrieved from
Our World In Data.42 For France age-stratified data on hospital admissions, ICU patients, and deaths
was retrieved from official government sources j and deaths outside hospitals from the French Institute
for Demographic Studies (INED). k For Italy age-stratified data on deaths was also retrieved from
INED. l

Age-stratified vaccine uptake statistics for France and Italy were both retrieved from the European
Centre of Disease Prevention and Control (note that such data is not available for Germany). m

The share of different vaccines used until the end of 2021 in France, Germany, and Italy (made by
BioNTech/Pfizer, Moderna, AstraZeneca, Janssen Pharmaceutica NV) have been retrieved from the
official government sources. n

OECD Weekly Tracker. The OECD Weekly Tracker (short ‘Tracker’) provides weekly estimates of
economic activity based on Google Trends data and performs well across the 46 OECD and G20
countries in forecast simulations. The Tracker’s methodology36 relies on a machine learning algorithm,
which extracts signals from search intensities related to approximately 250 categories of search
keywords to infer a timely picture of the economy. It is trained on official GDP series to predict weekly
GDP from the weekly Google Trends series. It provides estimates of weekly GDP relative to the pre-
crisis trend.

The Tracker is based on several Google Trends variables that were hand-picked to cover a wide
range of aspects of economic activity. Importantly, for our analysis, the Tracker only uses search
behaviour on economic variables and not health variables. Data about search behaviours can be
informative about consumption (e.g., related to searches for “vehicles”, “household appliances”),
labour markets (e.g., “unemployment benefits”), housing (e.g., “real estate agency”, “mortgage”),
business services (e.g., “venture capital”, “bankruptcy”), industrial activity (e.g., “maritime transport”,
“agricultural equipment”) and economic sentiment (e.g., “recession”), and poverty (e.g., “food bank”).
Signals about multiple facets of the economy can be aggregated to infer a timely picture of the
macroeconomy.

j https://www.data.gouv.fr/fr/datasets/synthese-des-indicateurs-de-suivi-de-lepidemie-covid-19/
k https://dc-covid.site.ined.fr/en/data/france/
l https://dc-covid.site.ined.fr/en/data/italy/
m https://vaccinetracker.ecdc.europa.eu/public/extensions/COVID-19/vaccine-tracker.html#age-group-

tab
n France: https://covidtracker.fr/vaccintracker/, Germany: https://impfdashboard.de/, Italy:

https://www.governo.it/it/cscovid19/report-vaccini/

 7
The relationship between the search volume indices and GDP, , is learnt at the quarterly frequency
using official quarterly GDP series and quarterly aggregates of the search indices. It is then used to
disaggregate GDP growth at the weekly frequency by applying to the weekly search indices. The
relationship between Google Trends variables and GDP growth is fitted using a neural network. It is
trained using a dataset comprising the whole panel of observations from 46 countries.

The Tracker measures the percentage difference in GDP relative to a pandemic-free counterfactual,
where the counterfactual is taken to be the OECD Economic Outlook projection published in
November 2019.43 Formally, the Tracker is defined as

 = −1,

where is weekly GDP in week , and is weekly GDP in a no-COVID counterfactual, proxied by
a twelfth of quarterly GDP projected by the OECD Economic Outlook prior to the crisis. The Tracker
thus measures weekly GDP relative to the pre-crisis trend (Fig. 5).

Figure 5: The OECD Weekly Tracker is a proxy of weekly GDP relative to the pre-crisis trend.

Figure 6: OECD Weekly Tracker for France, Germany, and Italy.36

Vaccine acceptance is taken from the University of Maryland Social Data Science Center “Global
COVID-19 Trends and Impact Survey” in partnership with Facebook. The survey is administered to a
representative sample of Facebook users daily and includes questions on symptoms, social
distancing behaviour, vaccine acceptance, mental health issues, and financial constraints. The
acceptance rates used in this paper are built as the quarterly average of the proportion of respondents
that said to ‘definitely’ or ‘probably’ choosing to get vaccinated if a COVID-19 vaccine was offered to
them over the first quarter of 2021. For the United States, acceptance rates were complemented

 8
using data from the Johns Hopkins Center for Communication Programs. The acceptance rate for
Malta was imputed using the median across countries.

Mobility. A mobility index is built from the Google Mobility reports, o which document mobility per type
of destination relative to the pre-crisis levels at a daily frequency. The mobility index used in this paper
is the simple average of mobility towards workplaces and places of retail and recreation.

Temperature. Daily temperature series for the 46 OECD and G20 countries across 2020 and 2021
were collected from the National Oceanic and Atmospheric Administration’s National Centers for
Environmental Information. The Global Historical Climatology Network daily (GHCNd) provides daily
climate summaries from land surface stations across the globe. Temperature data for each station
were averaged at the country level.

Policy interventions. For each country, we consider the date when COVID certificates for day-to-day
use were announced, see Table 1.

Table 1: COVID certificates: announcement date and regulations for France, Germany, and
Italy.

 Country Announcement Places where COVID certificates are required
 France 12 July 2021 p Places of entertainment and leisure (e.g., cinemas, festivals, museums,
 sports, conferences, game rooms, amusement parks, cruise ships), places
 of social gathering (e.g., bars, cafés, restaurants, clubs), interregional
 public transport (e.g., domestic flights, trains, and coaches), and
 department stores and shopping centres with a surface greater than
 20,000 square metres. q
 Germany 10 August 2021 r Health care places (e.g., hospitals, care homes), hospitality venues,
 events, indoor parties, and sports, and for the use of body- related
 services (e.g., hairdresser, massages, etc.). Mandatory in areas with over
 35 COVID cases per 100,000 inhabitants per week. s
 t
 Italy 22 July 2021 Places of entertainment and leisure (e.g., cinemas, festivals, museums,
 indoor sports, conferences, game rooms, amusement parks, cruise ships),
 places of social gathering (e.g., hospitality venues, bars, cafés,
 restaurants, clubs), interregional public transport (e.g., airports, train
 stations). u
The extension to workplaces was announced on 15 October 2021 in Italy v and on 23 November 2021 in
Germany. w

OECD and EU countries that announced the use of COVID certificates before 22 September
2021. Austria, Chile, Colombia, Croatia, Cyprus, Denmark, Estonia, Finland, France, Germany,
Greece, Ireland, Israel, Italy, Latvia, Lithuania, Luxembourg, Mexico, Portugal, Romania, Slovakia,
Slovenia, Spain, Switzerland, the United States.

o https://www.google.com/covid19/mobility/
p Macron E. Adresse aux Français - 12 juillet 2021. https://www.elysee.fr/emmanuel-
macron/2021/07/12/adresse-aux-francais-12-juillet-2021
q https://www.covidpasscertificate.com/france-covid-pass-reopen-vaccinated-tourists/
r Die Bundesregierung. Videoschaltkonferenz der Bundeskanzlerin mit den Regierungschefinnen und
Regierungschefs der Länder am 10. August 2021.
https://www.bundesregierung.de/resource/blob/974430/1949532/d3f1da493b643492b6313e8e6ac64966/2021-
08-10-mpk-data.pdf?download=1
s https://www.bundesregierung.de/breg-en/news/federal-regional-consultation-coronavirus-1949666
t Presidenza del Consiglio dei Ministri. Comunicato stampa del Consiglio dei Ministri n. 30. 22 July 2021.
https://www.governo.it/it/articolo/comunicato-stampa-del-consiglio-dei-ministri-n-30/17514
u https://www.euronews.com/2021/07/23/italy-to-roll-out-covid-health-pass-for-bars-restaurants-and-museums
v
 https://www.reuters.com/world/europe/italys-mandatory-covid-health-pass-work-sees-untroubled-launch-2021-
10-15/
w
 https://www.bundesgesundheitsministerium.de/ministerium/gesetze-und-verordnungen/guv-20-lp/ifsg-aend.html

 9
Remaining OECD and EU countries. Australia, Belgium, Bulgaria, Costa Rica, Czech Republic,
Hungary, Iceland, Japan, Malta, the Netherlands, New Zealand, Norway, Poland, South Korea,
Sweden, Turkey, the United Kingdom.

Donor pool countries for synthetic control. x Australia, Belgium, Czech Republic, Hungary, Japan,
Malta, the Netherlands, New Zealand, Norway, Poland, South Korea, Sweden, Turkey, the United
Kingdom.

Table 2: Use of COVID certificates in OECD and EU countries (N/A = not before November
2021).

 Country Announcement Source
 date
 Australia N/A https://www.theguardian.com/australia-news/2021/oct/11/victoria-covid-update-vaccine-passports-trialled-
 as-pfizer-offered-to-all-age-groups
 Austria 19/05/2021 https://www.thelocal.com/20210728/europe-how-does-use-of-health-passes-compare-in-europe-2/

 Belgium 23/09/2021 https://www.rtbf.be/info/societe/detail_pass-sanitaire-au-restaurant-ou-dans-les-salles-de-sport-en-
 wallonie-des-avis-partages?id=10847152
 Bulgaria 20/10/2021 https://www.euractiv.com/section/politics/short_news/bulgaria-introduces-green-covid-19-pass/

 Chile 25/05/2021 https://www.efe.com/efe/espana/sociedad/chile-anuncia-un-pase-de-movilidad-que-otorga-mas-libertades-
 a-vacunados/10004-4543838
 Colombia 25/07/2021 https://labsnews.com/en/notes/colombia-is-working-on-an-electronic-covid-19-vaccination-pass/

 Costa Rica 13/10/2021 https://qcostarica.com/as-of-december-1-a-vaccination-certificate-will-be-mandatory-in-costa-rica/

 Croatia 01/07/2021 https://www.garda.com/crisis24/news-alerts/496766/croatia-amendments-to-covid-19-countermeasures-
 will-be-implemented-from-july-1-update-28
 Cyprus 09/07/2021 https://www.dw.com/en/cyprus-vaccine-drive-safepass-mandatory-no-more-free-covid-tests/a-58249253

 Czech 21/10/2021 https://www.expats.cz/czech-news/article/coronavirus-update-oct-21-2021

 Republic
 Denmark 14/04/2021 https://www.healthcareitnews.com/news/emea/denmark-launches-covid-19-passport-coronapas

 Estonia 26/08/2021 https://www.ecb.ee/news/new-coronavirus-restrictions-from-august-26/

 Finland 06/08/2021 https://www.helsinkitimes.fi/finland/finland-news/domestic/19724-finnish-government-shows-green-light-to-
 coronavirus-pass.html
 France 12/07/2021 https://www.elysee.fr/emmanuel-macron/2021/07/12/adresse-aux-francais-12-juillet-2021

 Germany 10/08/2021 https://www.bundesregierung.de/breg-en/news/federal-regional-consultation-coronavirus-1949666

 Greece 16/07/2021 https://www.reuters.com/world/europe/no-vaccines-no-dinner-indoor-greek-restaurants-accept-only-
 inoculated-customers-2021-07-16/
 Hungary N/A https://www.euronews.com/travel/2021/10/12/green-pass-which-countries-in-europe-do-you-need-one-for

 Iceland N/A https://www.euronews.com/travel/2021/10/12/green-pass-which-countries-in-europe-do-you-need-one-for

 Ireland 29/06/2021 https://www.bbc.com/news/world-europe-57649546

 Israel 07/03/2021 https://www.france24.com/en/middle-east/20210307-israel-opens-restaurants-and-bars-to-customers-
 vaccinated-against-covid-19
 Italy 22/07/2021 https://www.governo.it/it/articolo/comunicato-stampa-del-consiglio-dei-ministri-n-30/17514

 Japan N/A https://www.japantimes.co.jp/news/2021/12/14/national/japan-start-using-digital-vaccination-certificates-
 dec-20-via-smartphone-app/

 Latvia 10/06/2021 https://www.laprensalatina.com/latvia-to-reopen-indoor-restaurants-to-vaccinated-people/

 Lithuania 13/09/2021 https://www.roedl.com/insights/covid-19/lithuania-corona-covid-pass-vaccinated-national-certificate

 Luxembourg 02/06/2021 https://www.wort.lu/fr/luxembourg/la-liberte-passera-par-le-covid-check-60b79a27de135b92362283bb

 Malta N/A https://www.euronews.com/travel/2021/10/12/green-pass-which-countries-in-europe-do-you-need-one-for

 Mexico 13/08/2021 https://www.covidpasscertificate.com/mexico-covid-passports/

 Netherlands 16/11/2021 https://www.usnews.com/news/health-news/articles/2021-11-16/positive-virus-tests-reach-weekly-high-in-
 the-netherlands
 New Zealand N/A https://www.reuters.com/world/asia-pacific/new-zealand-use-vaccine-certificates-delta-persists-2021-10-
 05/
 Norway N/A https://www.euronews.com/travel/2021/10/12/green-pass-which-countries-in-europe-do-you-need-one-for

 Poland N/A https://www.euronews.com/travel/2021/10/12/green-pass-which-countries-in-europe-do-you-need-one-for

 Portugal 08/07/2021 https://www.lci.fr/sante/covid-19-le-portugal-elargit-l-usage-du-pass-sanitaire-aux-hotels-et-restaurants-
 2191149.html
 Romania 17/09/2021 https://www.romania-insider.com/romania-green-pass-regulations-economy

 Slovakia 17/07/2021 https://www.slovensko.sk/en/news/_digital-covid-pass

 Slovenia 12/09/2021 https://www.total-slovenia-news.com/politics/8872-slovenia-tightens-covid-pass-restrictions

 South Korea 01/12/2021 https://en.yna.co.kr/view/AEN20211213005851315

 Spain Various y https://www.thelocal.se/20211209/swedens-new-vaccine-pass-plan-for-restaurants-and-long-distance-
 trains/
 Sweden 09/12/2021 https://www.thelocal.se/20211209/swedens-new-vaccine-pass-plan-for-restaurants-and-long-distance-
 trains/
 Switzerland 25/08/2021 https://www.thelocal.ch/20210825/breaking-switzerland-proposes-covid-certificates-indoors-in-bars-
 restaurants-and-gyms/
 Turkey 06/09/2021 https://www.gov.uk/foreign-travel-advice/turkey/coronavirus

x Costa Rica, and Iceland have been removed from the donor pool used for the synthetic control method due to
lack of data for covariates. Bulgaria has been removed from the donor pool due to lack of vaccination coverage
data over most of the analysed period.
y By 22 September 2021, COVID certificates were in place in several parts of the country.

 10
UK 08/12/2021 https://www.gov.uk/government/news/prime-minister-confirms-move-to-plan-b-in-england
USA Variousy https://www.covidpasscertificate.com/us-covid-passports/
B. Estimation of vaccine uptake
The impact of COVID certificates on vaccination uptake is estimated using innovation diffusion theory
and validated by the synthetic control method.
Innovation diffusion theory6,24,25 attempts to formalise the way in which an innovation is gradually
taken up by a population, where early adopters are then joined by followers. The model relies on
growth models with capacity limits, i.e., logistic curves. In our context, vaccines are the innovation that
every (eligible) person may choose to adopt.
Denote by t0 the date when the vaccine is introduced and by x(t) ∈ [0,1] the cumulative fraction of the
population who has received at least one dose at date t. Thus, by assumption, x(t) ∈ [0,1] for all t, the
function x(t) is nondecreasing, and x(t)=0 for all t ≤ t0. The innovation diffusion model depends on
three additional parameters: p > 0 is the ‘coefficient of innovation’, i.e., the instantaneous rate at which
a non-vaccinated person opts to get vaccinated, independent of how many people are already
vaccinated; q > 0 is the ‘coefficient of imitation', i.e., the rate at which a non-vaccinated person is
influenced by the fraction of vaccinated people; and 0< K ≤ 1 is the capacity, i.e., the fraction of the
population that is eventually eligible and willing to get vaccinated.
Mathematically, the innovation diffusion model is described by the ordinary differential equation
( )
′( ) = (1 − )( + ( )), ≥ 0 ′( ) = 0 ℎ .
The unique solution to the latter differential equation is given by:
1− −( + )( − 0 )
( ) = , ≥ 0 ( ) = 0 ℎ .
1+ −( + )( − 0 )
Logistic functions model the diffusion of an innovation in the absence of major shocks, including
supply shortages or policy interventions. While this is the case over the time period considered (i.e.,
date of announcement of COVID certificate to 31 December 2021), an extension to 2022 may be less
appropriate due to the exogenous shock caused by the Omicron variant becoming dominant in
France, Germany, and Italy.
Parameters 0 , , , and are estimated using the least-square method to fit the data on vaccine
uptake. The fit is computed three months before the announcement of a country’s COVID certificate
and then extended to the end of the year; the start date is chosen because by then the majority of the
adult population was eligible for vaccination. We use the function ‘curve_fit’ from Python’s package
‘scipy.optimize’ over vaccine uptake and synthetic counterfactuals. We use block bootstrap to account
for time dependence in the data with 1,000 iterations and 30 non-overlapping blocks.44 The 95%
confidence intervals are shown and reported throughout.
Counterfactual vaccine uptakes. For each country, denote by ( ) for ∈ {0,1,2} the proportion of
the population having received doses at time . For the first dose, the counterfactual is denoted by
� (1) and is obtained from the estimation described above. Let 0 denote the date when COVID
certificates are announced in each country and 1 be 31 December 2021. Then, � (1) is equal to
(1) for all ≤ 0 and is equal to the estimate obtained through the innovation diffusion model for all
∈ [ 0 , 1 ]. To obtain a counterfactual for fully vaccinated individuals, we consider the same ratio
between first and second doses between the counterfactual and realised scenarios three weeks prior,
i.e.:
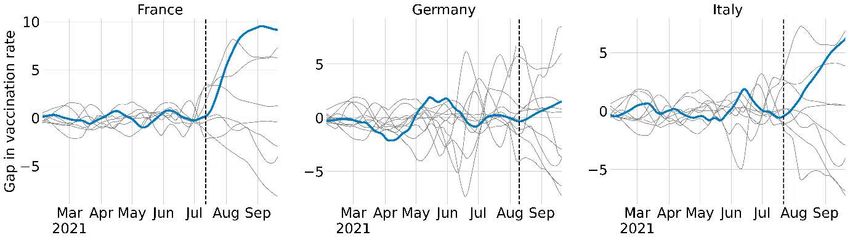
11(2) � (2) = � −21 (1) ⋅ . −21 (1) Three weeks is chosen as this is the minimum gap required between the two vaccine doses. Finally, � (0) = 1 − � (1) − � (2). We do not consider a counterfactual scenario for boosters. Age-stratified vaccine uptake. To estimate age-stratified vaccine uptake, we consider the population aged 60 and over (60+) and the rest separately. This is particularly relevant, as health outcomes are generally more severe for the elderly population. As age-stratified data are not available for Germany before mid-September 2021 it cannot be included in this analysis. We use the innovation diffusion model to construct a counterfactual for the 60+ group for France and Italy. For all vaccination statuses , the realised vaccination uptake for 60+ is denoted by 60+ ( ), and the counterfactual is denoted by � 60+ ( ). To ensure consistency with our overall estimates, we set counterfactual vaccine uptake for the 59 years old and below as the difference between the overall and the 60+ estimates. For the population aged 60 years and older, the fit is computed from the start of 2021 to the date of the announcement of the COVID certificate and then extended to the end of the year; the start date is chosen because by then the majority of the 60+ population was eligible for vaccination (Fig. 7). We use the function ‘curve_fit’ from Python’s package ‘scipy.optimize’ over the vaccine uptake counterfactuals. We use block bootstrap to account for time dependence in the data with 1,000 iterations and 30 non-overlapping blocks.44 The 95% confidence intervals are shown and reported throughout. Figure 7: Realised and counterfactual vaccination rates for the population over age 60. Model validation via synthetic control. Fig. 8 shows the estimated vaccination uptake via synthetic control for France, Germany, and Italy. Its computation is described below. The synthetic control for each country falls within the 95% confidence interval of the counterfactual based on innovation diffusion theory. This gives additional validation for the model choice and findings. 12
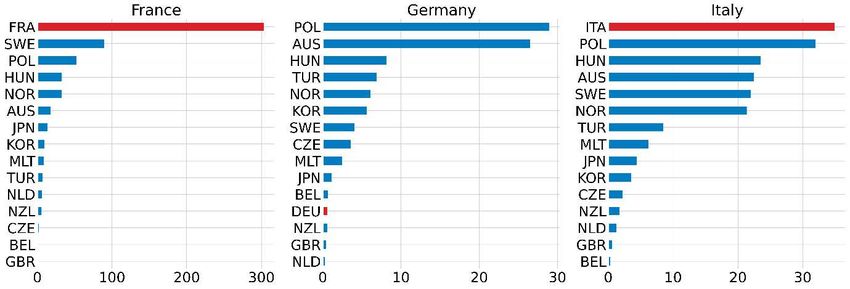
Figure 8: Estimated vaccine uptake via synthetic control and innovation diffusion theory with
and without COVID certificates.

Synthetic Control30,45,46 provides a counterfactual based on the evolution of nontreated countries,
i.e., countries that did not implement COVID certificates. This counterfactual is computed as a
weighted average of the nontreated units. To this end, we define the control group as the OECD and
EU countries that did not resort to COVID certificates during this period. This choice is motivated by
broad socioeconomic resemblance and sufficient vaccine supply. The weights applied to the
nontreated units are chosen to minimise the error of the synthetic control in the pre-treatment period.
The impact of COVID certificates on vaccination is thus estimated as the difference between
vaccination after the implementation of the policy and the counterfactual –14 countries feature in the
donor pool of nontreated countries and include OECD and EU countries that did not implement
COVID mandates before 22 September 2021 and have sufficient data availability (see list above). We
posit that after this date the synthetic control method is no longer feasible due to an insufficient donor
pool.

For each treated country (France, Germany, Italy), the synthetic first-dose vaccination rate ( , ) is
computed as a weighted average of the vaccination rates in the donor countries:

 , = ∑ = 1 , ,

where = 14 is the number of countries in the donor pool, and is the weight associated with , and
the vaccination rate in country . The weights are in the interval [0,1] and sum to one to avoid
extrapolation.30 They are chosen to minimise the error prior to the treatment, which occurs in 0 :

 2
 ∑ 0= 1[( , − ∑ = 1 , )2 + ∑
 =1 ( , − ∑ = 1 , ) ] .

The weights are chosen to minimise a composite loss function that includes, on the left, the mean
squared prediction error of the pre-treatment outcome, and, on the right, the mean squared prediction
errors of covariates, whose respective importance is weighed by the coefficients for between 1
and . The covariates are selected on the basis of their predictive power of vaccination, and include
annual GDP per capita, the average fatalities and cases over the pre-treatment period, the share of
the population aged over 65, the average Mobility Index over 2020, and average vaccine acceptance
over the first quarter of 2021. The covariate weights are assumed to be constant (i.e., = for all
 ), and the weight applied to all the covariates is optimised using five-fold cross-validation.

 13
The country weights used for building the synthetic vaccination rates for France, Germany, and Italy
are shown in Fig. 9. The three synthetic vaccination rates are built as averages of the vaccination
rates from European countries, except for Japan and South Korea, which each account for less than
10% of the French synthetic vaccination rate. All three feature the Czech Republic and Belgium.

Figure 9: Country weights for synthetic control for France, Germany, and Italy.

Figure 10: Placebos for France, Germany, and Italy.

 ( − )
 = .
 ( − )

A -value for the inferential procedure based on the permutation distribution of is given by the rank
of the treated country’s ratio divided by the size of the donor pool. The ratios and their
permutation distributions for the synthetic vaccination rates in France, Germany, and Italy are shown
in Fig. 11. The causal estimates for France and Italy are statistically significant with a -value equal to
0.071 (= 1/14), while the estimates for Germany are not significant.

 14
Figure 11: RMSPE ratios for France, Germany, and Italy.

 ( − − )
 .
 ( − )

For placebos, the ratio of the post-treatment and pre-treatment is simply a ratio of the
 taken out-of-sample over the measured in-sample, given that the optimal weights are
computed using the pre-treatment observations. This ratio is classically understood as a measure of
overfitting. If the model overfits, its out-of-sample prediction error is large compared to its in-sample
prediction error. As a result, overfitting synthetic control models yields spurious results whose validity
is rejected by permutation tests. In the present case, overfitting is limited using several covariates in
the fit as well as the resort of cross-validation to select the weights attributed to these covariates.

 C. Impact on health outcomes
Vaccine effectiveness. We compute vaccine effectiveness against hospitalisation, ICU admission,
and deaths between one week and six months after inoculation when infected with the Delta variant—
the dominant strain of SARS-CoV-2 in France, Germany, and Italy over the considered time period—
by taking the weighted average over the different types of vaccines (see Table 3).

Table 3. Distribution of the different types of vaccines in France, Germany, and Italy by 31
December 2021.

 France Germany Italy
 BioNTech/Pfizer 79.5% 72.0% 70.1%
 Moderna 11.7% 16.5% 18.2%
 AstraZeneca 7.7% 8.4% 10.1%
 Janssen Pharmaceutica NV 1.1% 3.1% 1.6%

For mRNA vaccines (BioNTech/Pfizer and Moderna), conservative estimates for the effectiveness are
80%31 after one dose and 93% after two doses.32-34 The second estimate integrates the effect of
waning immunity, as the protection against severe outcomes is higher than 95% up to 14 weeks after
inoculation and above 90% thereafter.34 For AstraZeneca’s vaccine, comparable estimates are 90%
after one dose and 85% after two doses.34 Here, waning immunity explains the lower effectiveness of
two AstraZeneca doses versus one. Finally, for Janssen Pharmaceutica NV, the effectiveness after
the single dose is estimated at 85%.35

 15
The overall vaccine effectiveness against hospital admissions, ICU admissions, and deaths
is approximately the same and is also similar across France, Germany, and Italy, namely 81%
protection after one dose and 92% after two doses. We do not include the additional protection
provided by boosters, as the calculations we perform are only concerned with individuals who were
not fully vaccinated before the COVID certificate; therefore, they were not eligible for a booster shot
over the period of study.
Realised health outcomes by vaccine status. Let denote the realised health outcome (i.e.,
hospital admissions and patients, ICU admissions and patients, and deaths, for a given country) at
time , and let ( ) denote the same outcome by vaccine status ∈ {0,1,2}. When the data by
vaccine status are not available, we can derive them from Bayes’ rule and the level of protection
against the health outcome by vaccine status, ( ). The ( )’s satisfy the following linear system:
( ) (0)
= ( ) ⋅ , ∈ {0,1,2}, (0) + (1) + (2) = .
− ( ) − (0)
This system admits a unique solution, given by
− ( )
( )
− (0)
( ) = ⋅ , ∈ {0,1,2}.
− ( ′)
∑2 ′=0 ( ′)
− (0)
Note that vaccine uptake has been lagged by days to account for the lag between infection and the
health outcome, ℎ , , and ℎ , the lag between vaccination and full effectiveness, , and
the duration of the health hazard, ℎ and , which are only relevant for hospital
admissions and ICU patients. For example, for a patient who is in an ICU at time , on average, their
admission occurred at time − , their infection at time − − , and at that time
− − − (2), people were fully protected by vaccination.
Counterfactual health outcomes by vaccine status. Similarly, let � ( ) denote the counterfactual
health outcome (number of hospital admissions, ICU patients, or deaths, for a given country) at time ,
with vaccine status ∈ {0,1,2}. Then,
�
� ( ) = ( ) ⋅ − ,
( )
− ( )
where is the lag that was introduced in the previous paragraph. The estimated counterfactual
number of a given health outcome at time for a given country is given by:
� = � (0) + � (1) + � (2).
Finally, the overall realised and counterfactual of a given health outcome, from the announcement of
COVID certificates in the country until the end of 2021, are estimated respectively by
= ∑ =
1
and � = ∑ =
0
1
� .
0
1
The difference � − = ∑ = 0
( � − ) is attributed to the adoption of COVID certificates.
Age-stratified health outcomes. When the data are available, we analogously compute age-
stratified (i.e., 60 years old and above, and the rest of the population) health outcomes, as well as the
corresponding counterfactuals. The total numbers are obtained by summing over all age groups.
The lag parameters.47 We assume the lag between vaccination and full effectiveness is = 7
days, the lag between infection and hospital admission is ℎ = 7 days, the lag between infection
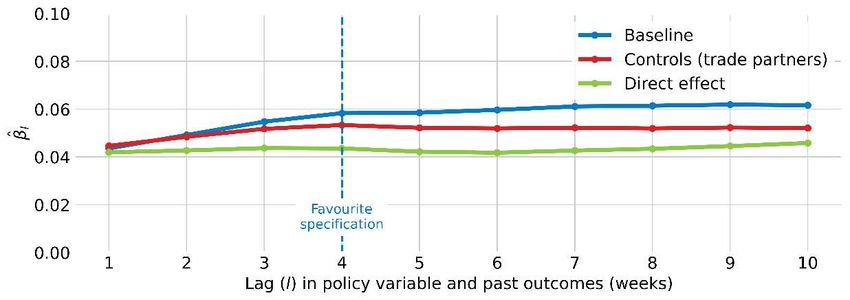
16and ICU admission is = 10 days, the total number of days in ICU is 8, so that an ICU patient has been admitted = 4 earlier, and the average lag between infection and death is ℎ = 14 days. Thus, for hospital admissions, the total lag is + ℎ = 14; for ICU patients, the total lag is + + = 21; and for deaths, the total lag is + ℎ = 21. D. Impact on the economy We estimate the average impact of a marginal increase in vaccination rates on economic activity using two-way fixed-effect regressions. The measure of economic activity used in this paper is the OECD Weekly Tracker, a proxy of weekly GDP relative to the pre-crisis trend, which is available for 46 countries with no publication delay (Methods A). It is regressed on vaccination rates along with controls as well as country and week fixed effects. To estimate the average total effect of vaccination on GDP, we use the following closed-form model: , = , − + , − + , + , + + + , . Weekly GDP is proxied by the Tracker , and is regressed on the share of vaccinated people lagged by weeks ( = 4), , − , as well as three vectors of controls, week, and country dummies. The first controls vector , − includes lagged cases, deaths, reproduction rate, and mobility index, which may have impacted both past vaccine uptake decisions and present weekly GDP.48 The model also averts confounding effects that could emerge from trade and other spillovers due to the relative synchronicity of vaccination campaigns across countries by controlling for vaccination and deaths in the main trading partners ( , ). The vector , is the weighted average of vaccination rates and deaths in country ’s main 10 trading partners, i.e., , = ∑10 = 1 , , , where , is the vaccination rate in trading partner and , is the share of exports from country to trade partner in total exports from country . The same formula is used to build the vector of weighted average death rates in trading partners. Last, the model includes the vector of average weekly temperatures , , which can influence virus transmission.38 The model is estimated using data from 46 OECD and G20 countries (see Table 4). Denote by * < 0.1, ** < 0.05, and *** < 0.01. The average effect of a 1 p.p. increase in the share of vaccinated people after a month is 0.052*** p.p. in weekly GDP. This order of magnitude seems plausible and implies, if the impact was permanent, that 100% vaccination uptake would increase GDP by 5.2 p.p., which broadly corresponds to 85% of the average GDP loss suffered in 2020 by the countries in the sample. This is consistent with the notion that a complete vaccination would not be sufficient to a return to pre-crisis trends due to partial vaccine effectiveness and the waning-out of vaccine-provided immunity. Adding controls for deaths and vaccination in trade partners decreases the main estimate from 0.054*** to 0.052*** by partialling out the confounding effect of trade spillovers. Finally, the third column models the direct effect by controlling for current cases, deaths, and reproduction rates. This indicates that 83% of the total economic effect of vaccination is through the direct effect on individual behaviour, while the remaining 17% is related to the effect through the impact on virus circulation. Note, however, that we do not estimate the indirect effects independently, as we do not estimate a policy response function. 17
Table 4: Regression results for vaccination-GDP elasticity.
 Baseline Controls (trade partners) Direct effect
 Vaccinated people 0.054*** 0.052*** 0.043***
 (per 100) (0.044, 0.064) (0.042, 0.061) (0.033, 0.052)
 Cases (lag) 0.001** 0.001*** 0.002***
 Deaths (lag) -0.068*** -0.041*** -0.049***
 Reproduction rate -1.606*** -1.305*** -0.883***
 (lag)
 Mobility Index (lag) 0.057*** 0.048*** 0.054***
 Stringency Index (lag) 0.014*** 0.013*** 0.007*
 Temperature 0.052*** 0.008 -0.014
 Vaccination of trade -0.093*** -0.090***
 partners
 Deaths in trade -0.461*** -0.453***
 partners
 Cases in partners 0.001 0.003***
 GDP of partners 0.861*** 0.732***
 Cases -0.002***
 Deaths -0.086***
 Reproduction rate -1.667***
 Country dummies Yes Yes Yes
 Week dummies Yes Yes Yes
 Observations 4204 4204 4204
 R2 0.774 0.794 0.807
 Adjusted R2 0.766 0.787 0.800
 Residual Std. Error 2.497 (df=4059) 2.384 (df=4055) 2.309 (df=4052)

 F Statistic 96.581*** (df=144; 4059) 105.695*** (df=148; 4055) 112.311*** (df=151; 4052)

* < 0.1 , ** < 0.05, and *** < 0.01

The model is used to derive estimates of the counterfactual weekly GDPs without COVID certificates
by subtracting the model-based estimation of the impact of COVID certificates on weekly GDP, say
 , , from the observed weekly GDP series:

 �
 , = , − ,
 with , = β( , − − � , − ),

where � , is the counterfactual tracker and � , − is the counterfactual vaccine uptake. Confidence
intervals for counterfactual weekly GDP are derived from the fact that the estimate of the causal
impact of COVID certificate on weekly GDP is the product of two random variables:
 Var� , � = ( ) ∗ � � , − � + ( ) ∗ 2 � , − − � , − � + � � , − � ∗ 2 ( )

 � � , − � is estimated from 1,000 bootstrap runs of the logistic model, and ( ) is given by the
multivariate regression from Table 4. Then, supposing that , follows a normal distribution, its 95%
confidence intervals are [ , ± 1.96 ∗ , ] .

Robustness checks. We complemented our analysis with robustness checks regarding the statistical
method, the choice of lag, and the modelling assumption that the vaccine-GDP relationship did not
vary substantially across the considered time period.

Two-way fixed effects regressions. A recent literature49-51 has shed light on the limitations of two-way
fixed effects regressions when the treatment effect is heterogeneous. Alternative estimators have
been proposed,49 which limit the risk of bias by restricting the comparisons between units and times.
This literature is still young, and there are currently no satisfactory options for cases where the
treatment is dynamic, continuous, and staggered. Experiments with the DIDm estimator51 were
inconclusive, as this estimator is primarily designed for discrete treatments and does not seem to
provide reliable results in regard to analysing continuous differences in treatment intensities.

 18
You can also read