The dynamics of evolutionary rescue from a novel pathogen threat in a host metapopulation
←
→
Page content transcription
If your browser does not render page correctly, please read the page content below
www.nature.com/scientificreports
OPEN The dynamics of evolutionary
rescue from a novel pathogen
threat in a host metapopulation
Jing Jiao1,2* & Nina Fefferman1,3
When a novel disease strikes a naïve host population, there is evidence that the most immediate
response can involve host evolution while the pathogen remains relatively unchanged. When hosts
also live in metapopulations, there may be critical differences in the dynamics that emerge from the
synergy among evolutionary, ecological, and epidemiological factors. Here we used a Susceptible-
Infected-Recovery model to explore how spatial and temporal ecological factors may drive the
epidemiological and rapid-evolutionary dynamics of host metapopulations. For simplicity, we
assumed two host genotypes: wild type, which has a positive intrinsic growth rate in the absence
of disease, and robust type, which is less likely to catch the infection given exposure but has a
lower intrinsic growth rate in the absence of infection. We found that the robust-type host would
be strongly selected for in the presence of disease when transmission differences between the two
types is large. The growth rate of the wild type had dual but opposite effects on host composition: a
smaller increase in wild-type growth increased wild-type competition and lead to periodical disease
outbreaks over the first generations after pathogen introduction, while larger growth increased
disease by providing more susceptibles, which increased robust host density but decreased periodical
outbreaks. Increased migration had a similar impact as the increased differential susceptibility, both
of which led to an increase in robust hosts and a decrease in periodical outbreaks. Our study provided
a comprehensive understanding of the combined effects among migration, disease epidemiology,
and host demography on host evolution with an unchanging pathogen. The findings have important
implications for wildlife conservation and zoonotic disease control.
The field of conservation biology explicitly considers the likely impact that different threats or supportive man-
agement actions are likely to have on the persistence of populations. The evaluation of these factors can take
an ecological perspective, considering demographic effects (e.g., population viability a nalysis1,2), or behavioral
factors (e.g., Allee effects3,4), or can take an evolutionary perspective, considering effective population size5–7,
genetic rescue8,9, or even evolutionary rescue1,10. One critical advance in our understanding of threatened popula-
tions came from considering species that live in potentially connected patches of habitat through dispersal. This
shift from a focus on an isolated population to metapopulation dynamics, and the difference in survival across
a landscape by ongoing extinction-recolonization processes, fundamentally altered our understanding of both
ecological and evolutionary bounds on persistence11–13. One of the strengths of the focus on metapopulations
in conservation biology is that it enabled the same framework to address a large variety of potential threats. Cli-
mate change, habitat loss, habitat degradation, over-exploitation of a harvested population, or even invasions of
competitors or predators that all fit within the same framework, are accessible for study using the same theory,
and can be analyzed using the same conceptual and computational t ools14–19. There is, however, one type of threat
that is not easily considered in the same way, even though metapopulation dynamics may prove equally critical
in evaluating an endangered population’s likelihood of persistence: infectious pathogens.
Infectious pathogens have the potential to drive the rapid extinction of entire p opulations20–22. Further,
increased human transportation, land use changes, and global climate change have led to more frequent cases
of the introduction or establishment of pathogens into new host species g lobally23–25. It is becoming clear that
conservation biology must explicitly consider the potential for disease to impact species p ersistence26,27. Infec-
tious disease risks depend directly on shifts in the host population itself. Outbreak dynamics of an infection
1
National Institute for Mathematical and Biological Synthesis, The University of Tennessee, 1122 Volunteer Blvd.,
Suite 106, Knoxville, TN 37996, USA. 2Department of Biological Science, Florida State University, 319 Stadium
Dr, Tallahassee, FL 32304, USA. 3Ecology & Evolutionary Biology, The University of Tennessee, 1416 Circle Drive,
Knoxville, TN 37996, USA. *email: jjiao3@utk.edu
Scientific Reports | (2021) 11:10932 | https://doi.org/10.1038/s41598-021-90407-z 1
Vol.:(0123456789)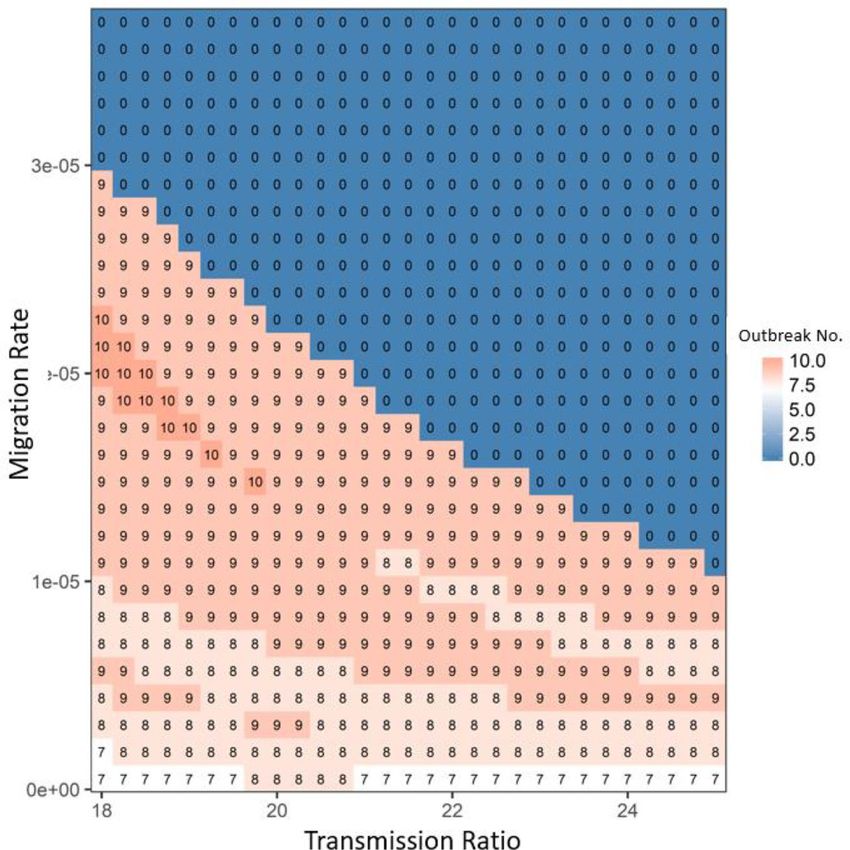
www.nature.com/scientificreports/
are determined by the effective reproductive number for a disease, which characterizes its ability to continue
spreading. This reproductive number depends directly on the available size of the susceptible population of
hosts28–30. This means that, in some cases, actions taking in support of a population may inadvertently boost the
duration of an active outbreak. Within a metapopulation framework, conservation actions taken within a single
patch may perversely permit transmission to other patches, whereas allowing local extinction may protect the
remainder of the host metapopulation from disease exposure20,31. Of course, ongoing metapopulation dynamics
can complicate outcomes themselves, even in the absence of human intervention, since between patch migra-
tion that acts to replenish the host population in a depopulated patch may also function as a mechanism for (re)
introduction of d isease32–34.
In the worst potential case for an endangered host population, in which the disease causes substantial mor-
tality, there are only three potential epidemiological outcomes for a host population when neither the host nor
pathogen evolve: (1) The host population could die out. (2) The host population is sufficiently decimated (or
protected by sufficient herd immunity) to curtail disease transmission, and the disease dies out. In this case, the
population may retain sufficient size or metapopulation dynamics to recover, so long as the disease is not rein-
troduced into the metapopulation from an outside source. (3) The population is sufficiently large to withstand
the die-off associated with the initial outbreak of infection and long-term demographic and migration rates of
the population are sufficient to both support and withstand constant, relatively low levels of disease transmission
over time (i.e., the disease becomes endemic).
These three possible epidemiological outcomes all function within the context of host/pathogen ecology.
However, that does not restrict the potential for evolutionary dynamics to co-occur. For most host–pathogen
systems, the most likely observable evolutionary changes will occur in the pathogen35–37 (although host resist-
ance to disease can also e volve38,39). This is due not only to the shorter generation time, but also to the highly
variable nature of microbial reproduction (e.g., horizontal gene t ransfer38,39; high rates of antigenic m
utation40–42
etc.). Theory further predicts that selective pressures due to epidemiological dynamics should favor strains with
decreased pathogenicity over t ime43–46, meaning that host prospects for surviving under endemic threat, after
initial epidemic die-offs may be better than if the pathogen remained unchanged over time. However, for the
same reasons as the fluctuating risk of infection itself, the intensity of the selective pressure on the pathogen
should wax and wane with host population sizes and patch dynamics.
In addition to the possibility of pathogen evolution and host–pathogen coevolution, there is also a potentially
equally important possibility of host evolution, especially when a novel disease invades host population. Due
to the accrual of mutations, a host population is likely to have a diversity of existing genotypes, some of which
that are more resistant/ tolerant to disease than other types (e.g., some bat species are more tolerant to White
Nose Syndrome than others1). Hence, in the sudden presence of the novel selective pressure of a disease, the host
population has been observed to evolve while the pathogen remains relatively genetically stable (e.g., White Nose
Syndrome and r anavirus1,47 are two of the best-known examples) over a conservation-relevant t imeframe10. In
fact, it may be no coincidence that these two well-known examples are of rapidly expanding invasive infections—
entering into a novel host population, with an abundance of readily accessible susceptible individuals to infect.
In these cases, there should be very little selective pressure on the pathogen10. This is because the host can be
expected to have no co-evolved traits to combat the threat of the specific pathogen, meaning that it is unlikely for
there to be a single, unified selective pressure from host defenses that skew the success of one pathogen strain over
another. The emergence of random mutations should remain the dominant route of genotypic shifting among
the pathogen early after introduction into a novel host population; the pathogenic invasion behaves equivalently
to prey under a scenario of predator release. The hosts, on the other hand, in this case may face a strong imme-
diate selective pressure and may therefore be expected to evolve on a more rapid timescale then their invading
pathogen if they are to survive. However, both empirical investigations and theoretical work across different
systems to look for evidence of such rapid evolutionary rescue effects (e.g., White Nose S yndrome1) are still rare.
These unique features of infectious disease threats move both the ecological and evolutionary theories for
population persistence of metapopulations outside of the realms that can be well-studied by existing tools.
When trying to understand how endangered populations might respond to the threat of infection, it is no longer
sufficient to extrapolate from models that consider the ecology, evolution, or epidemiology of the system in
isolation. For example, host migration under metapopulation structure can (re)introduce disease to local patch,
which could lead to evolutionary rescue and modify disease epidemics therein. Hence, we require a synergistic
model that can incorporate metapopulation dynamics, shifting selective pressures, and disease transmission
simultaneously.
We here present a classic Susceptible-Infected-Recovered epidemiological model in a host metapopulation
structure, in which disease cannot exist outside of the target host, therefore only the host can migrate among
patches (potentially carrying infection with them; see a similar model structure in previous s tudy10). We specifi-
cally explored how each of these three critical, inextricable processes (i.e., metapopulation dynamics, shifting
selective pressures, and disease transmission) may shape the persistence of species as novel pathogens arise and
existing pathogens spread into novel geographic regions and affect new host populations. For simplicity, we first
considered a “stepping-stone” host metapopulation model with clockwise disease migration among patches, in
which the timing and direction of disease spreading can be well controlled. Some human migration, or ocean
transport systems may follow this simple structure48,49. To test the generality of the model results, we then also
gradually added edges to the “stepping-stone” structure and studied the sensitivity of the model dynamics towards
more complicated host metapopulation structures.
Scientific Reports | (2021) 11:10932 | https://doi.org/10.1038/s41598-021-90407-z 2
Vol:.(1234567890)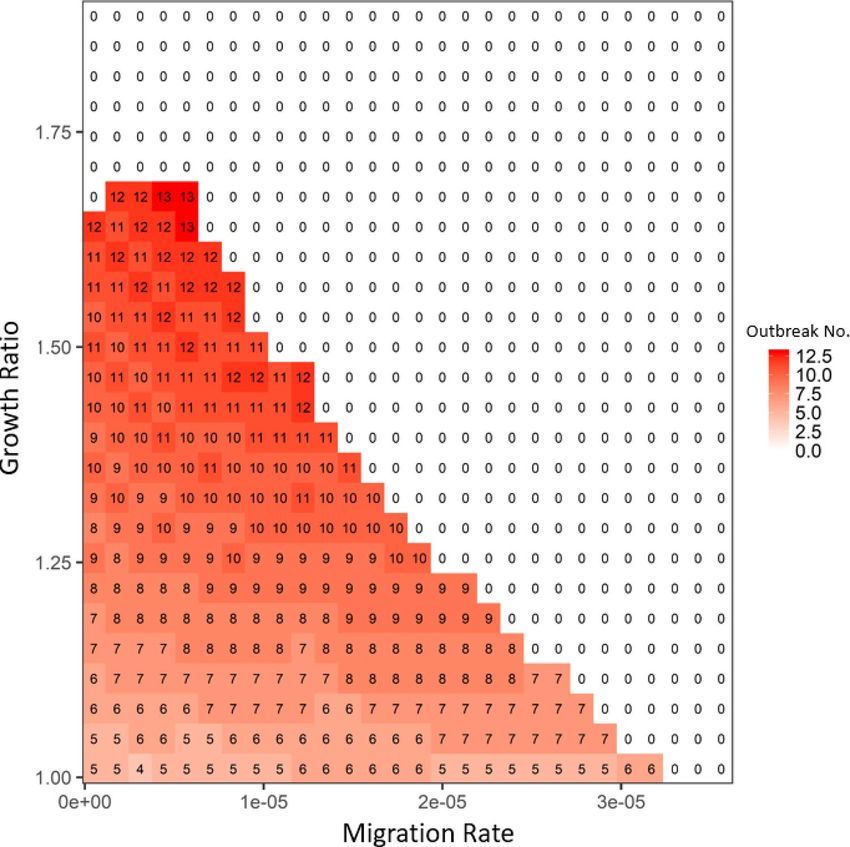
www.nature.com/scientificreports/
Model
dSji
= Bji − βhi Ijh Sji − µi Sji + mSji (1)
dt
h∈[W,R]
dIji
= βhi Ijh Sji − (αi + µi + γi )Iji + mIji (2)
dt
h∈[W,R]
dRji
= γi Iji − µi Rji + mRji (3)
dt
where the state variables, Sji , Iji and Rji are the numbers of susceptible, infected and recovered hosts of genotype
i at patch j, respectively. i is either Wild type (W) or robust type (R). βhi describes the transmission rate from
Infected genotype h to i, µi , αi and γi are the natural mortality, disease-induced mortality and recovery rate in
genotype i, respectively. Recovered hosts are assumed to remain immune to the disease for the remainder of their
lifetime, but their offspring do not inherit this adaptive immunity (i.e., no vertical transmission). Bji represents
all newborns that have genotype i and are from randomly mated in host population at patch j. When mating
happens within same-type host pairs, all the newborns are assumed to be susceptibles of the same type as their
parents. When mating happens across types, we assume that 50% offspring are robust type and 50% are wild
type, such that
Bji = LSji Sjh + LSji Ijh + LSjh Iji + LSji Rjh + LSjh Rji + LIji Rjh
h∈[W,R] h∈[W,R] i�=h h∈[W,R] i�=h h∈[W,R]
(4)
+ LIjh Rji + LIji Ijh + LRji Rjh
i� =h h∈[W,R] h∈[W,R]
in which L describes the newborns from each pair of mating combinations (within and between susceptible
and infected for both genotypes: e.g.,LSji Sjh is the newborn number from the mating between Sji and Sjh ). The
detailed equations are:
Sji2
Pj
LSji Sji = ri 1 − (5)
Pj Kj
Sji Sjh
ri + rh Pj
LSji Sjh = 1− where i �= h (6)
Pj 2 Kj
2Sji Iji ri + rid Pj
LSji Iji = 1− (7)
Pj 2 Kj
Sji Ijh
ri + rhd Pj
LSji Ijh = 1− where i �= h (8)
Pj 2 Kj
2Sji Rji ri + rir Pj
LSji Rji = 1− (9)
Pj 2 Kj
Sji Rjh
ri + rhr Pj
LSji Rjh = 1− where i �= h (10)
Pj 2 Kj
Iji2
Pj
LIji Iji = rid 1 − (11)
Pj Kj
Iji Ijh
rid + rhd Pj
LIji Ijh = 1− where i �= h (12)
Pj 2 Kj
2Iji Rji rid + rir Pj
LIji Rji = 1− (13)
Pj 2 Kj
Scientific Reports | (2021) 11:10932 | https://doi.org/10.1038/s41598-021-90407-z 3
Vol.:(0123456789)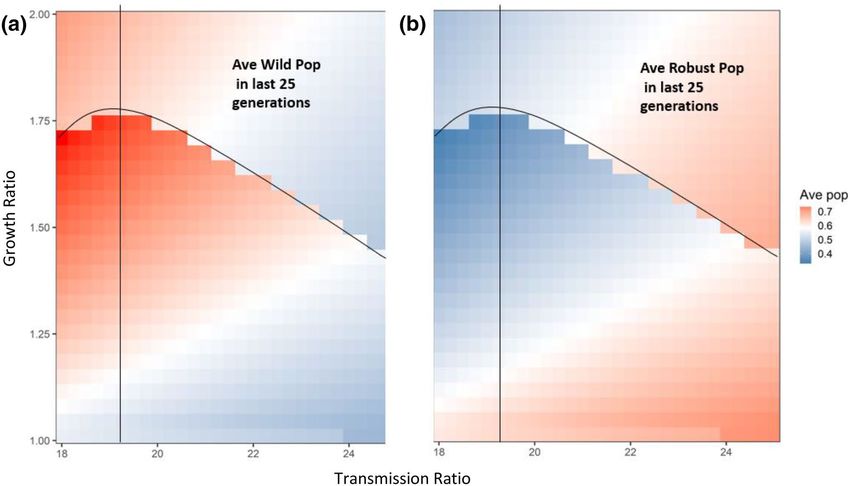
www.nature.com/scientificreports/
Parameters Description Unit Value
ri growth rate of the susceptible in host type i 1/time rW = 0.2, rR = 0.15
rid growth rate of infected in host type i 1/time 0.01
rir growth rate of the recovered in host type i 1/time 0.2
αi Disease-introduced mortality for host type i 1/time 0.05
μi natural mortality of host type i 1/time 0.01 or 0.05
βℎi transmission from infected host type i to susceptible host type h 1/indiv./time βRR = βWR = 0.000005, βRW = βWW = 0.0001
γi recover rate of host type i 1/time 0.05
Kj carrying capacity of host type j indiv 3000
Table 1. All parameter notation, description, unit in the model and values for simulation. i = W or R,
representing host genotype wild-type and robust type, respectively.
Iji Rjh
rid + rhr Pj
LIji Rjh = 1− where i �= h (14)
Pj 2 Kj
Rji2
Pj
LRji Rji = rir 1− (15)
Pj Kj
Rji Rjh
rir + rhr Pj
LRji Rjh = 1− where i �= h (16)
Pj 2 Kj
Here, ri , rid and rir are the growth rate of susceptible, infected and recovered hosts in genotype i, respectively.
h and i are either Wild type (W) or Robust (R). Pj is the total number of hosts (the sum of all susceptible and
infected hosts) in patch j:
Pj (t) = Sji (t) + Iji (t) + Rji (t)
(17)
i∈[W,R] i∈[W,R] i∈[W,R]
mSji , mIji and mRji describe the net immigration of genotype i to patch j:
mSji =
mig k, j Ski − mig j, k Sji
(18)
k∈[1,N]/{j}
in which mig k, j describes the migration from patch k to j. Replacing S by I or R, we can get mIji or mRji . All
parameter notations, description, units and values for simulation are listed in Table 1. The model was run for
100,000 steps, which equated to 50 host generations to consider a reasonable timeframe for conservation pur-
poses. We assumed that the initial balance of host types was equal to keep simple disease dynamics in the absence
of migration and leave it to future work to consider how the different skew of host type across different patches
could impact the epidemiological and evolutionary metapopulation dynamics of the system.
Through this model, we first studied the host dynamics in one isolated patch, which indicated the effects
from disease epidemiology and host demography. We then extended our study to multiple patches and further
explored how host dynamics also responded to between-patch migration when disease was initially introduced
into only one patch. To easily control the direction of disease transmission among patches, we first assumed a
clockwise transmission under a stepping-stone metapopulation structure with two ends wrapped around. We
specifically tested how subpopulation sizes (either wild type or robust), total population size (wild type + robust)
and periodic outbreaks (due to disease reintroduction from other patches) changed under the influences of
three pairs of parameter combinations: Transmission ratio vs. growth ratio in the absence of disease (rW /rR ),
migration rate vs. growth ratio without disease and transmission ratio vs. migration rate. We also relaxed the
model assumption by adding an additional edge to the “stepping-stone” structure and explored the correspond-
ing change in disease dynamics.
Results
one‑patch dynamics in the absence of migration. From Eqs. (1–2), we analytically solved the basic
reproduction number ( R0) in one isolated patch j using the next generation matrix method48:
βW BjW|I=0 + βR BjR|I=0
R0 = (19)
µ(α + µ + γ )
where BjW|I=0 and BjR|I=0 are reproductive rate of each genotype (W or R) in the absence of disease.
Over time, the disease exhibited standard outbreak dynamics, with a single peak in incidence that burned
through the population and then died out under the parameter set (see the two bottom panels in Fig. 1). Due
Scientific Reports | (2021) 11:10932 | https://doi.org/10.1038/s41598-021-90407-z 4
Vol:.(1234567890)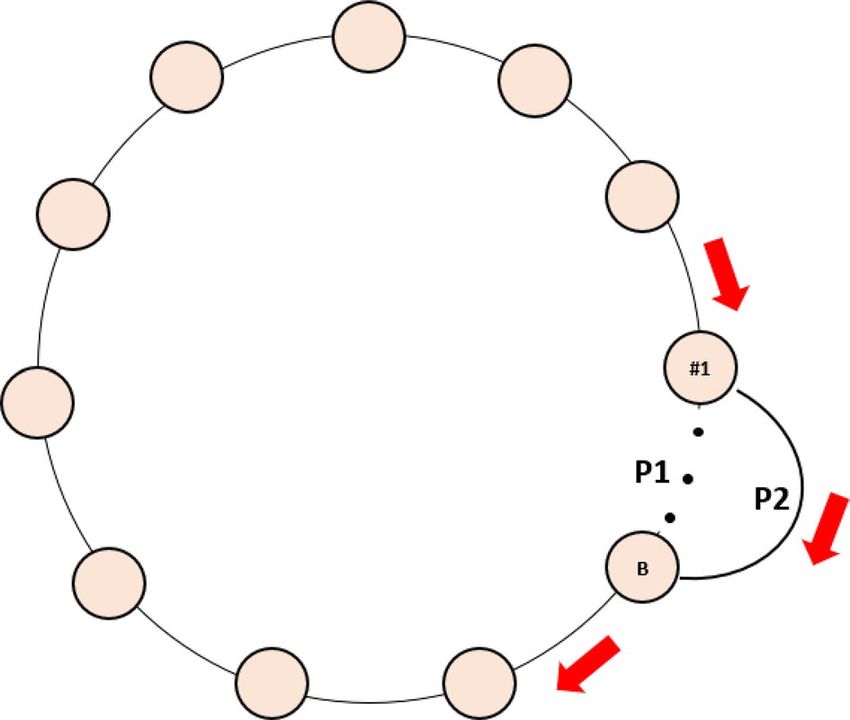
www.nature.com/scientificreports/

                                  Figure 1.  The dynamic changes of two host genotypes (Robust and Wild) and total infecteds under three
                                  levels of transmission ratio (10, 15 and 25, indicated by solid, dotted and dashed lines respectively) and two
                                  levels of growth ratio (1.01: left panels a,c,e; 2: right panels b,d,f) in one isolated patch. The robust type serves
                                  as the baseline transmission rate and growth rate of the susceptibles. All the other parameters are: rR = 0.15,
                                  rWd = rRd = 0.01, rWr = rRr = 0.2, αW = αR = 0.05, μW = μR = 0.0005, γW = γR = 0.05, βRR = βWR = 0.000005. Initial
                                  susceptibles of both types are 200, initial infected of both types are 0.0005, and initial recovereds of both types
                                  are 0.

                                  to the absence of between-patch migration, the disease in one patch did not reoccur after dying out since there
                                  was no reintroduction from other patches.
                                      During the growth phase of the outbreak (mostly in the first 300 timesteps), the robust type was selected
                                  for while representation of the wild type decreased due to its higher numbers of deaths as a result of disease
                                  (see the sudden increase in Robust (Fig. 1a,b) but decrease in wild type (Fig. 1c,d) when disease increases (see
                                  the first 300 timesteps in Fig. 1e,f)). The larger transmission ratio (βW /βR with βR fixed) led to larger increase
                                  in disease ( R0 in Eq. (19) increased due to the increase of βW /βR ; compare the three lines in Fig. 1f), thus, the
                                  stronger selection on host genotypes leading to evolutionary rescue effects, i.e., robust density increased more,
                                  and wild type decreased more, as the transmission rate increased (compare the three lines in Fig. 1b,d). With
                                  the lower growth ratio and transmission ratio (e.g., growth ratio = 1.01 and transmission ratio = 10), the system

Scientific Reports |   (2021) 11:10932 |                https://doi.org/10.1038/s41598-021-90407-z                                                        5

                                                                                                                                                   Vol.:(0123456789)
www.nature.com/scientificreports/
Figure 2. The standardized average population size (population size divided by carrying capacity) of both wild
type (a) and robust type (b) in the last 25 generations (total simulated generations are 50) under the influences
of transmission ratio and growth ratio at patch #30, where robust type provides the baseline growth rate and
transmission rate. The color trend represents the average population size: from blue to white to red, average
population sizes increase. All the other parameters are: rR = 0.15, rWd = rRd = 0.01, rWr = rRr = 0.2, αW = αR = 0.05,
μW = μR = 0.0005, γW = γR = 0.05, βRR = βWR = 0.000005 and m(k,j) = 0.000008. In focal patch #1, the initial
susceptibles of both types are 200, infecteds are 5, and recovereds are 0. Other patches show similar patterns.
showed herd immunity without strong disease selection (see the almost constant sizes of both genotypes along
time in Fig. 1a,c,e).
As the number of infected individuals decreased (after 400 timesteps in Fig. 1e,f), disease-driven selection
on host genotypes was also reduced: i.e., the robust type lost its advantage (see the decrease of robust after 400
timesteps in Fig. 1a,b). Once the disease died out, the wild type then gradually increased in density due to its
higher growth rate in the absence of disease (see the increase trend in Fig. 1c,d). The larger the growth ratio
(rW /rR with rR fixed) was, the reproduction in Wild type ( BjW|I=0) was larger and disease selection was stronger
(larger R0 in Eq. 19), which led to a stronger increase in Robust type and large decrease in Wild type (compare
the trends of the two genotypes in Fig. 1a–d).
Although a large growth ratio (r) would benefit the wild type in general, it could also reinforce disease-driven
selection by increasing the total density of infected individuals. For example, around timestep = 130, the growth
ratio at 2 experienced increased disease relative to the growth ratio at 1.01 (compare the maximum values of
total infected individuals between Fig. 1e,f). This is because the large growth rate provided more susceptibles
(via reproduction) who then caught and propagated the infection. In this case, a higher growth rate would ben-
efit the robust type due to increased disease-driven selection. Therefore, the growth ratio could act either as a
selective force against the wild type or the robust type, depending on the magnitude and relative demographic
rates of the different host types.
Multiple‑patch dynamics with migration. Stepping‑stone metapopulation with clockwise migra‑
tion. Under the stepping-stone structure for the host metapopulation, between-patch migration could reintro-
duce disease to the patch(es) where it had previously died out. Depending on the epidemiological characteristics
and the timing of disease moving among all patches, disease could be reinforced (i.e., R0 increased after the
inclusion of ρ ; the rate at which disease is reintroduced into patches with already high prevalence of infection;
see Eq. 20 in Appendix 1), lost (i.e., R0 < 1 as Eq. (19) even in the presence of migration; because disease in one
patch died out before being carried to any neighboring patch) or cycling (i.e., R0 ≈ 1 after the inclusion of ρ and
the effective reproductive number R ≈ 1 in Fig. S3 in Appendix 1; disease in one patch is always successfully (re)
introduced to at least one neighboring patch where it establishes before dying out in the parent patch, leading to
repeated outbreaks in each patch over time).
In the case in which migration led to the reinforcement of disease, the robust type would be selected for across
all patches due to its lower numbers of deaths due to disease (see Fig. S1 in Appendix 1); when disease died out
in one patch without being carried to the next (thus dying out across the entire system), the wild type would
Scientific Reports | (2021) 11:10932 | https://doi.org/10.1038/s41598-021-90407-z 6
Vol:.(1234567890)www.nature.com/scientificreports/
Figure 3. The average disease outbreak numbers in the last 25 generations (total simulated generations are
50) under the influences of growth ratio and transmission ratio for Wild type at patch #30, where robust type
provides the baseline growth rate and transmission rate. The color trend with numbers represent the trend of
disease outbreak numbers: from blue to white to red, outbreak numbers increase. All the other parameters are:
rR = 0.15, rWd = rRd = 0.01, rWr = rRr = 0.2, αW = αR = 0.05, μW = μR = 0.0005, γW = γR = 0.05, βRR = βWR = 0.000005 and
m(k,j) = 0.000008. In focal patch #1, the initial susceptibles of both types are 200, infecteds are 5, and recovereds
are 0. Other patches show similar patterns.
gradually take over the system due to its higher growth rate (see Fig. S2 in Appendix 1); when disease showed
periodical outbreaks through patches, the robust and wild types would alternate their domination of the system
(i.e., the wild type dominated after the disease died out in each patch, but since the robust type remained extant,
when disease was reintroduced by migration, the robust type would again increase; see Fig. S3 in Appendix 1).
Over the last 25 generations, the growth ratio would first show an average increase but then an average
decrease in the density of the wild type (see the color trend along y-axis in Fig. 2a and Fig. S4a in Appendix 2).
The complementary pattern existed for the robust type (color trend along y-axis in Fig. 2b and Fig. S4b in Appen-
dix 2). This is due to the dual functions of growth rate: increasing the competition from the wild type as well as
strengthening disease-driven selective advantage of the robust type via producing more susceptible offspring
for disease infection (similar to the pattern observed in the one patch scenario; compare the two genotypes and
total infected individuals between Fig. 1a,b). As the growth ratio increased (see above the bifurcation line near
growth ratio = 1.75 in Figs. 2 and Fig. S4 in Appendix 2), the increased prevalence of infection outweighed the
increase in wild-type growth, showing selection favoring the robust type (compare the color trends in the areas
along y-axis above the bifurcation line in Figs. 2 and Fig. S4 in Appendix 2).
By increasing the competition of the wild type (i.e., the apparent competition with robust-type host via sharing
one type of pathogen), the growth ratio would shorten the time for the wild type to increase (if the system had
repeated disease outbreaks); thus, the time for one period of disease outbreak could be reduced (compare the
breaths of outbreaks in Fig. 1e,f), i.e., the number of outbreaks would be expected to increase, given 25 genera-
tions (see the increase in the number of outbreak cycles with the increase of the growth ratio under the bifurca-
tion line in Figs. 3 and 4). Once the growth ratio was large enough to benefit the robust type, the robust type
Scientific Reports | (2021) 11:10932 | https://doi.org/10.1038/s41598-021-90407-z 7
Vol.:(0123456789)www.nature.com/scientificreports/
Figure 4. The average disease outbreak numbers in the last 25 generations (total simulated generations are
50) under the influences of growth ratio and migration rate for Robust type at patch #30, where robust type
provides the baseline growth rate (in the absence of infection: i.e., rR). The color trend with numbers represent
the trend of outbreak numbers: from blue to white to red, outbreak numbers increase. All the other parameters
are: rR = 0.15, rWd = rRd = 0.01, rWr = rRr = 0.2, αW = αR = 0.05, μW = μR = 0.0005, γW = γR = 0.05, βRR = βWR = 0.000005
and βRW = βWW = 0.0001. In focal patch #1, the initial susceptibles of both types are 200, infecteds are 5, and
recovereds are 0. Other patches show similar patterns.
would gradually increase to dominate the system, leading to the disappearance of periodical disease outbreaks
(see the 0 outbreak cycles above the bifurcation line in Figs. 3 and 4).
Unlike the dual possible effects of the growth ratio, the transmission ratio always increased the disease
prevalence and therefore benefited the robust type (see the color trends along the x-axis in Figs. 2and Fig. S5 in
Appendix 2). This unidirectional selection favoring the robust type gradually led the robust type to dominate
the entire system, decreasing the possibility of disease periodical outbreaks (see the general decrease in outbreak
numbers along x-axis in Fig. 3). When the transmission ratio was relatively small, its benefit to the robust type
was concomitantly small; thus, the benefit of the growth ratio to the wild type was easily seen, leading to a faster
increase in wild-type density, even with a lower growth ratio (see the lower bifurcation line when transmis-
sion ratio was less than 19 in Fig. 3). In contrast, when the transmission ratio was large, the disease prevalence
increased (compare the three lines in Fig. 1e,f). In this case, a small increase in the growth ratio could again
increase prevalence, in which case selection would favor the robust type (see the lower bifurcation line when
transmission ratio was larger than 20 in Fig. 3). Therefore, an intermediate transmission ratio (see the vertical
lines near transmission ratio as 19.5 in Fig. 3) would have the highest growth ratio to exhibit disease-driven
selection on robust type, leading to a unimodal pattern in the bifurcation line along the transmission ratio (see
the trend of the bifurcation line along x-axis in Fig. 3 and Fig. S5 in Appendix 2).
The migration rate had a similar function as the transmission ratio: the increase in migration rate increased
spreading of disease throughout the host metapopulation structure and thereby increased the selective advan-
tage of the robust type (see the increase trend along x-axis in Fig. S4 in Appendix 2). This advantage would
decrease the chance of disease periodical outbreaks in the system (see the decrease of outbreak number along
x-axis in Fig. 4). Similar to the transmission ratio, the selective advantage of the robust type from the growth
Scientific Reports | (2021) 11:10932 | https://doi.org/10.1038/s41598-021-90407-z 8
Vol:.(1234567890)www.nature.com/scientificreports/
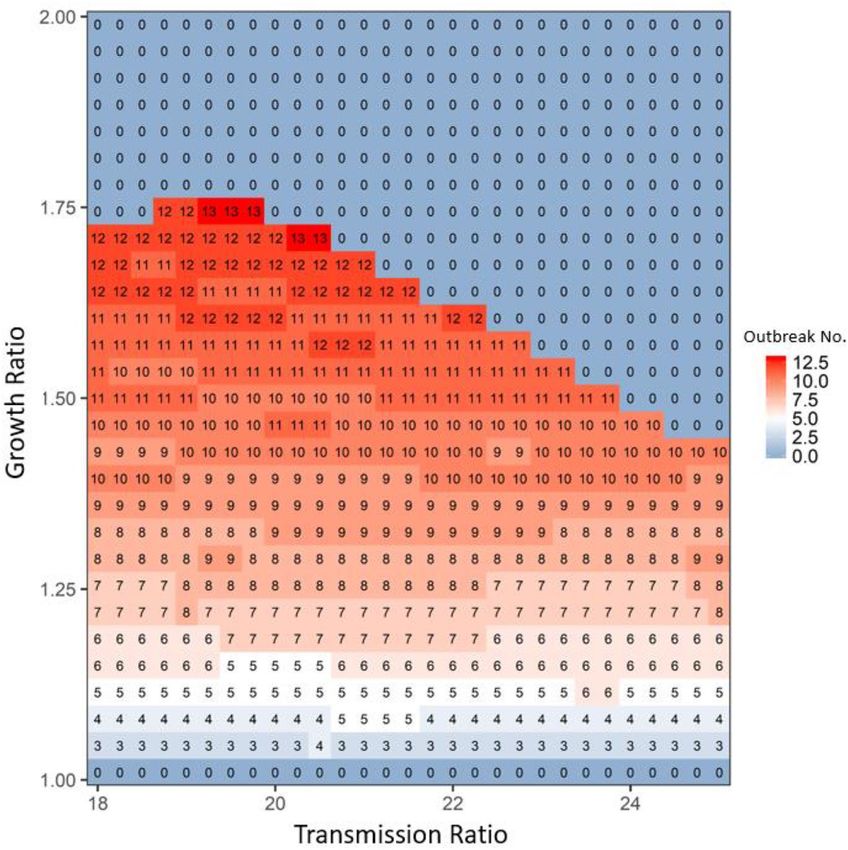
Figure 5. The average disease outbreak numbers in the last 25 generations (total simulated generations are
50) under the influences of transmission ratio and migration rate for patch #30, where robust type provides
the baseline transmission rate. The color trend with numbers represent the trend of outbreak numbers: from
blue to white to red, outbreak numbers increase. All the other parameters are: rR = 0.15, rW = 0.2, rWd = rRd = 0.01,
rWr = rRr = 0.2, αW = αR = 0.05, μW = μR = 0.0005, γW = γR = 0.05 and βRR = βWR = 0.000005. In focal patch #1, the initial
susceptibles of both types are 200, infecteds are 5, and recovereds are 0. Other patches show similar patterns.
ratio also exhibited a unimodal pattern determined by the migration rate (see the trend of the bifurcation line
along migration in Fig. S4 in Appendix 2). The only difference was that once the growth ratio was sufficiently
large, almost every patch showed a strong selective advantage for the robust type, which led to the synchrony in
the metapopulation. In that case, disease overtook the entire system without depending on migration (densities
of both host types did not change with migration once growth ratio was above the bifurcation line in Fig. S4 in
Appendix 2). Therefore, migration and transmission had interchangeable roles on disease-driven selection in
the entire system: i.e., once the migration rate was large, the system only needed a small transmission ratio to
achieve the dominance of robust type (see the general 1–1 line in Figs. 5 and S5 in Appendix 2). Decreasing the
total number of patches in the system would be equivalent to increasing the migration rate (i.e., shorter pathway
leads to faster disease transmission among patches give the same migration rate), which could reinforce the
disease and lead to the dominance of robust-type host (see Fig. S6 in Appendix 3). In contrast, increasing total
patch number would slow down disease transmission and may cause the disease to die out and be lost to the
system during migration (see Fig. S7 in Appendix 3).
Patch structures with more edges. By adding one more edge to the stepping-stone metapopulation
structure (see Fig. 6), there are then two pathways for disease transmission to occur among patches (i.e., P1 and
P2 in Fig. 6). When the initial distance between the two patches connected by the extra edge was small (e.g., 1 or
2 patches in between with a total of 40 patches in our simulation), the two pathways almost overlapped; thus, the
disease transmission pattern would not be qualitatively changed in the presence of the extra edge (compare Figa.
S3 with S3 in Appendix 1 and 3). When the patch distance was intermediate (e.g., 14 or 19 patches apart out of
a total 40 patches in our simulation), there was a slight time-delay in the disease transmission between the two
pathways. This delay could reinforce disease spreading across all patches (i.e., disease (re)introduction happened
Scientific Reports | (2021) 11:10932 | https://doi.org/10.1038/s41598-021-90407-z 9
Vol.:(0123456789)www.nature.com/scientificreports/
Figure 6. The stepping-stone host metapopulation structure with two ends wrapped around and one extra
edge added between Patch #1 and B where patch #1 is the focal patch where disease is initiated. P1 represents
the original pathway for disease transmission, while P2 is the pathway though the added edge. All the circles
represent patches, the red arrow show the direction of disease transmission among patches.
before local disease died out across patches) and selected for robust-type host (see disease dynamics in Fig. S9 in
Appendix 3). When the patch distance between A and B was relatively large (e.g., 27 or 30 patches apart out of
a total 40 patches), disease along pathway P2, which contained fewer patches than pathway P1, would be more
likely to reinforce the infection spread (due to the (re)introduction of infected hosts before local disease died
out) and lead to the dominance of robust host type in the patches along pathway P2 (see the disease dynamics
of Patch #1 and #40 in Fig. S10 in Appendix 3). Therefore, when disease from P1 passed through those patches
in P2, the disease was more likely to be lost from the system (due to the greater abundance of robust-type hosts
decreasing disease success), leading to the dominance of wild-type hosts in those patches solely on the pathway
P1 (see the disease dynamics of Patch #15 and #25 in Fig. S10 in Appendix 3). Similar patterns held as even more
edges were added to the system (e.g., two extra edges from focal patch to near neighbor patches; see Fig. S11
in Appendix 3). In general, the more edges were added to the system, the more connected the system would be
(e.g., a well-connected system acts like one big patch), which would facilitate disease transmission; thus, making
it more likely for robust-type hosts to dominate the system. This result is consistent with the previous study for
a non-spatial host system35.
Discussion
Epidemiological models of populations facing novel, highly contagious, deadly infections generally predict poor
chances for positive population growth20,49–52. Evolutionary rescue models for such populations have offered
better hopes of persistence from the intense selective pressure of a single, sudden outbreak of a novel patho-
gen, so long as genes permitting robustness in the face of infection are sufficiently represented in the affected
population1,10,53,54. Here, we considered the murky middle ground in which novel pathogens provide an incon-
stant selective pressure as ecological, epidemiological, and host evolutionary dynamics all interact with each
other over time.
Within any metapopulation facing a novel infectious threat, we see the logical possibility for many different
outcomes. A severe enough initial outbreak in a population can drive local host extinction, thereby also elimi-
nating the disease from the entire metapopulation system. On the other extreme, there are at least two distinct
paths that could lead to the natural eradication of the pathogen while the host population persists. The first is
an evolutionary rescue scenario in which the protective genes reduce host susceptibility to infection, such that
after infecting and killing off the wildtype, the disease cannot successfully infect the (potentially few) remaining
robust hosts10,53,54 (Similar as Fig. 1b,d and f; Fig. S1 in Appendix 1). The second is a herd immunity scenario,
in which all remaining hosts (whether wildtype or robust) are the (potentially few) survivors of infection and
are now immune, leaving no new susceptible hosts for the disease to i nfect55–57 (Similar as the one-patch case in
Fig. 1a,c,e; Fig. S2 in Appendix 1). In both scenarios, the population could potentially recover once the disease
has been eradicated, however, there are critical differences in how they might be affected by the reintroduction
of the disease (see below).
Of course, in either of these cases, the pressures may be insufficient to eradicate the disease, but may lead
instead to steady endemicity. In the case of evolutionary rescue, protective genotypes may also incur other fitness
trade-offs leading to the maintenance of the wildtype genes in the population, allowing ongoing circulation of
infection, but at insufficiently large scales to wipe out the remaining wildtype p opulation10. In the case of herd
immunity, birth rates, immigration, and gradual loss of immune memory may replenish the susceptible host
population quickly enough to allow the reproductive number for the disease to hover near one, neither allowing
Scientific Reports | (2021) 11:10932 | https://doi.org/10.1038/s41598-021-90407-z 10
Vol:.(1234567890)www.nature.com/scientificreports/
for large outbreaks nor eradicating infection c ompletely58,59. In both cases, we would expect host population
persistence, but at decreased size/growth rates than had been seen prior to the introduction of infection.
Lastly, and most interestingly, there are scenarios in which the epidemiological and evolutionary dynamics
go through cycles (Figs. 2, 3 and 4 and Fig. S3 in Appendix 1). In the case of evolutionary rescue, disease would
only have large-scale impacts on the population once the percent of the population with the robust genotype had
decreased sufficiently, which is most likely in the case of eradication followed by reintroduction (though could
be achieved cycling between endemic and epidemic conditions based on gene frequencies). Increasing wildtype
representation after initial evolutionary rescue could be due to either to genetic drift or else (and potentially
more rapidly) to alternative selective pressures that acted on the population in the absence of the disease. If the
population’s wildtype had recovered to be the majority, reintroduction after eradication could start the cycle
anew (Note that we do not mean to imply these cycles would be stable, merely that we would expect temporal
cycles in outbreaks, leading to rapid evolutionary rescue, leading to local decrease in the intensity of the selec-
tive pressure, leading to the potential recovery of the wildtype in the population, allowing for a new outbreak).
In the case of herd immunity, protection can be lost much faster as gradual loss of immune memory, immi-
gration, and births lead to the replenishment of the susceptible portion of the p opulation60. Once a sufficient
percent of the population is again susceptible, reintroduction would be expected to lead to another large-scale
outbreak based on the effective reproductive number of the d isease61. Of course, herd immunity may not have
prevented some evolutionary outcomes from the selective pressure of the disease, meaning that each cycle might
take longer and longer to replenish to allow for the next outbreak, since each cycle might slightly increase the
percent representation of the robust type in the population, however, the dynamics of epidemiological and evo-
lutionary factors will act in synergy to dictate the frequency and impact of such outbreaks.
Of course, in each of the cases studied, we have allowed evolutionary dynamics only in the host. For conser-
vation purposes, a host system with novel disease (see White Nose Syndrome in bats1) could be very common10.
Hence, the cases with evolved host but constant pathogen should be more explored in future. Our goal of this
paper is to study this simplified scenario to better understand its already complicated dynamics as a first step
in understanding and predicting the host evolution and even coevolutionary potential of these systems. Future
work will explore each of these cases when the pathogen is also allowed to evolve in response to host pressures.
Also, here we assumed a simple clockwise migration direction among patches as an extension of the "stepping-
stone" model and also explored the potential for more complicated spatial structure by adding more edges to
the “stepping-stone” structure. While we do not expect this is a realistic migration structure, we did this to
highlight the potential for these evolutionary dynamics. Other ways of migration10,17,62–64 (e.g., full random
or differential movement due to patch heterogeneity) combined with certain metapopulation structures may
change the cycling patterns in this study. In this study, we also generally chose parameters to only generate one
cycle of disease outbreak in the absence of migration. Future work can further explore the parameter space that
could lead to disease periodical outbreaks without migration65,66 (e.g., demographic process or seasonality, or
demographic stochasticity).
Critically, our model has also shown that monitoring any one feature from metapopulation dynamics, shift-
ing selective pressures, and disease transmission to understand the impact of disease introduction may give a
woefully insufficient understanding of the viability of the population over the longer term. Heroic interventions
may be unnecessary if the driving dynamic early after introduction is (successful) evolutionary r escue1 but
may be critical if herd immunity is likely to curtail the full selective impact of evolutionary rescue dynamics. If
metapopulation dynamics lead to host movement on a slow enough timescale to allow for disease persistence in
the system, but gradual local eradication of disease from any one patch, epidemiological monitoring may lead
to premature cessation of management efforts. In these cases, it may actually be that increasing natural rates of
host movement among patches, or even purposeful disease introduction to synchronize disease dynamics across
all patches could benefit the long-term probability of host persistence (so long as truly external reintroduction of
infection was unlikely). Overall, our model has allowed us to characterize the relative impact of epidemiological,
ecological, and evolutionary dynamics in a metapopulation structure to explore how each contributes to shaping
the probabilities of pathogen and host persistence. Especially as disease surveillance technologies67–69, including
genetic sequencing, become more easily and affordably available, we believe this eco-evo-epi framework will
be critical in generating concrete hypotheses for empirical testing and allow us a much fuller understanding of
how disease risks affect the natural world.
Received: 21 January 2021; Accepted: 11 May 2021
References
1. Maslo, B. & Fefferman, N. H. A case study of bats and white-nose syndrome demonstrating how to model population viability
with evolutionary effects. Conserv. Biol. 29, 1176–1185 (2015).
2. Morris, W. F. & Doak, D. F. Quantitative Conservation Biology (Sinauer, Sunderland, 2002).
3. Liebhold, A. & Bascompte, J. The Allee effect, stochastic dynamics and the eradication of alien species. Ecol. Lett. 6, 133–140 (2003).
4. Stephens, P. A. & Sutherland, W. J. Consequences of the Allee effect for behaviour, ecology and conservation. Trends Ecol. Evol.
14, 401–405 (1999).
5. Nunney, L. & Elam, D. R. Estimating the effective population size of conserved populations. Conserv. Biol. 8, 175–184 (1994).
6. Lande, R. & Barrowclough, G. Effective population size, genetic variation, and their use in population. Viable populations for
conservation, 87 (1987).
7. Frankham, R. Effective population size/adult population size ratios in wildlife: A review. Genet. Res. 66, 95–107 (1995).
8. Tallmon, D. A., Luikart, G. & Waples, R. S. The alluring simplicity and complex reality of genetic rescue. Trends Ecol. Evol. 19,
489–496 (2004).
Scientific Reports | (2021) 11:10932 | https://doi.org/10.1038/s41598-021-90407-z 11
Vol.:(0123456789)www.nature.com/scientificreports/
9. Whiteley, A. R., Fitzpatrick, S. W., Funk, W. C. & Tallmon, D. A. Genetic rescue to the rescue. Trends Ecol. Evol. 30, 42–49 (2015).
10. Jiao, J., Gilchrist, M. A. & Fefferman, N. H. The impact of host metapopulation structure on short-term evolutionary rescue in the
face of a novel pathogenic threat. Glob. Ecol. Conserv. 23, 01174 (2020).
11. Hanski, I. Metapopulation Ecology (Oxford University Press, Oxford, 1999).
12. Mortier, F., Jacob, S., Vandegehuchte, M. L. & Bonte, D. Habitat choice stabilizes metapopulation dynamics by enabling ecological
specialization. Oikos 128, 529–539 (2019).
13. Jiao, J., Riotte-Lambert, L., Pilyugin, S. S., Gil, M. A. & Osenberg, C. W. Mobility and its sensitivity to fitness differences determine
consumer–resource distributions. R. Soc. Open Sci. 7, 200247 (2020).
14. Anderson, S. C., Moore, J. W., McClure, M. M., Dulvy, N. K. & Cooper, A. B. Portfolio conservation of metapopulations under
climate change. Ecol. Appl. 25, 559–572 (2015).
15. Case, T. J. Invasion resistance, species build-up and community collapse in metapopulation models with interspecies competition.
Biol. J. Lin. Soc. 42, 239–266 (1991).
16. Gyllenberg, M. & Hanski, I. Habitat deterioration, habitat destruction, and metapopulation persistence in a heterogenous landscape.
Theor. Popul. Biol. 52, 198–215 (1997).
17. Jiao, J., Pilyugin, S. S. & Osenberg, C. W. Random movement of predators can eliminate trophic cascades in marine protected areas.
Ecosphere 7, e01421 (2016).
18. Nee, S. & May, R. M. Dynamics of metapopulations: Habitat destruction and competitive coexistence. J. Anim. Ecol. 61, 37–40
(1992).
19. Ying, Y., Chen, Y., Lin, L. & Gao, T. Risks of ignoring fish population spatial structure in fisheries management. Can. J. Fish. Aquat.
Sci. 68, 2101–2120 (2011).
20. Hess, G. Disease in metapopulation models: Implications for conservation. Ecology 77, 1617–1632 (1996).
21. Daszak, P., Cunningham, A. A. & Hyatt, A. D. Emerging infectious diseases of wildlife: Threats to biodiversity and human health.
Science 287, 443–449 (2000).
22. Harding, K. C., Begon, M., Eriksson, A. & Wennberg, B. Increased migration in host–pathogen metapopulations can cause host
extinction. J. Theor. Biol. 298, 1–7 (2012).
23. Dowling, A. J., Hill, G. E. & Bonneaud, C. Multiple differences in pathogen-host cell interactions following a bacterial host shift.
Sci. Rep. 10, 1–12 (2020).
24. Kuzmin, I. V. et al. Molecular inferences suggest multiple host shifts of rabies viruses from bats to mesocarnivores in Arizona
during 2001–2009. PLoS Pathog 8, e1002786 (2012).
25. Levine, R. S. et al. Supersuppression: Reservoir competency and timing of mosquito host shifts combine to reduce spillover of
West Nile virus. Am. J. Trop. Med. Hyg. 95, 1174–1184 (2016).
26. Langwig, K. E. et al. Context-dependent conservation responses to emerging wildlife diseases. Front. Ecol. Environ. 13, 195–202
(2015).
27. Smith, K. F., Acevedo-Whitehouse, K. & Pedersen, A. B. The role of infectious diseases in biological conservation. Anim. Conserv.
12, 1–12 (2009).
28. Xiao, Y., Tang, B., Wu, J., Cheke, R. A. & Tang, S. Linking key intervention timing to rapid decline of the COVID-19 effective
reproductive number to quantify lessons from mainland China. Int. J. Infect. Dis. 97, 296–298 (2020).
29. Cintrón-Arias, A., Castillo-Chávez, C., Betencourt, L., Lloyd, A. L. & Banks, H. T. The Estimation of the Effective Reproductive
Number from Disease Outbreak Data. (North Carolina State University, Center for Research in Scientific Computation, 2008).
30. Salpeter, E. E. & Salpeter, S. R. Mathematical model for the epidemiology of tuberculosis, with estimates of the reproductive number
and infection-delay function. Am. J. Epidemiol. 147, 398–406 (1998).
31. Grenfell, B. & Harwood, J. (Meta) population dynamics of infectious diseases. Trends Ecol. Evol. 12, 395–399 (1997).
32. Millard, A. R., Roberts, C. A. & Hughes, S. S. Isotopic evidence for migration in Medieval England: The potential for tracking the
introduction of disease. Soc. Biol. Human Affairs. 70, 9–13 (2005).
33. Chen, M. et al. The introduction of population migration to SEIAR for COVID-19 epidemic modeling with an efficient interven-
tion strategy. Inf. Fusion 64, 252–258 (2020).
34. Reed, K. D., Meece, J. K., Henkel, J. S. & Shukla, S. K. Birds, migration and emerging zoonoses: West Nile virus, Lyme disease,
influenza A and enteropathogens. Clin. Med. Res. 1, 5–12 (2003).
35. Roy, B. & Kirchner, J. Evolutionary dynamics of pathogen resistance and tolerance. Evolution 54, 51–63 (2000).
36. Bliven, K. A. & Maurelli, A. T. Antivirulence genes: Insights into pathogen evolution through gene loss. Infect. Immun. 80, 4061–
4070 (2012).
37. Wild, G., Gardner, A. & West, S. A. Adaptation and the evolution of parasite virulence in a connected world. Nature 459, 983–986
(2009).
38. Laine, A. L. Resistance variation within and among host populations in a plant–pathogen metapopulation: Implications for regional
pathogen dynamics. J. Ecol. 92, 990–1000 (2004).
39. Thrall, P. H. et al. Rapid genetic change underpins antagonistic coevolution in a natural host-pathogen metapopulation. Ecol. Lett.
15, 425–435 (2012).
40. Juhas, M. Horizontal gene transfer in human pathogens. Crit. Rev. Microbiol. 41, 101–108 (2015).
41. Soanes, D. & Richards, T. A. Horizontal gene transfer in eukaryotic plant pathogens. Annu. Rev. Phytopathol. 52, 583–614 (2014).
42. Brunham, R. C., Plummer, F. A. & Stephens, R. S. Bacterial antigenic variation, host immune response, and pathogen-host coevolu-
tion. Infect. Immun. 61, 2273 (1993).
43. Sasaki, A. Evolution of antigen drift/switching: Continuously evading pathogens. J. Theor. Biol. 168, 291–308 (1994).
44. Lange, A. & Ferguson, N. M. Antigenic diversity, transmission mechanisms, and the evolution of pathogens. PLoS Comput. Biol.
5, 1000536 (2009).
45. Alizon, S., Hurford, A., Mideo, N. & Van Baalen, M. Virulence evolution and the trade-off hypothesis: History, current state of
affairs and the future. J. Evol. Biol. 22, 245–259 (2009).
46. Messenger, S. L., Molineux, I. J. & Bull, J. Virulence evolution in a virus obeys a trade off. Proc. R. Soc. Lond. B 266, 397–404 (1999).
47. Alizon, S., de Roode, J. C. & Michalakis, Y. Multiple infections and the evolution of virulence. Ecol. Lett. 16, 556–567 (2013).
48. Bull, J. J. & Lauring, A. S. Theory and empiricism in virulence evolution. PLoS Pathog 10, e1004387 (2014).
49. Gray, M. J. & Chinchar, V. G. Ranaviruses: Lethal Pathogens of Ectothermic Vertebrates (Springer Science+ Business Media, New
York, 2015).
50. Dobbelaere, T., Muller, E. M., Gramer, L. J., Holstein, D. M. & Hanert, E. Coupled epidemio-hydrodynamic modeling to understand
the spread of a deadly coral disease in Florida. Front. Mar. Sci. 7, 1016 (2020).
51. Stoddard, S. T. et al. House-to-house human movement drives dengue virus transmission. Proc. Natl. Acad. Sci. USA 110, 994–999
(2013).
52. Diekmann, O., Heesterbeek, J. & Roberts, M. G. The construction of next-generation matrices for compartmental epidemic models.
J. R. Soc. Interface 7, 873–885 (2010).
53. Smith, K. F., Sax, D. F. & Lafferty, K. D. Evidence for the role of infectious disease in species extinction and endangerment. Conserv.
Biol. 20, 1349–1357 (2006).
54. Anderson, R. M., Anderson, B. & May, R. M. Infectious Diseases of Humans: Dynamics and Control (Oxford University Press,
Oxford, 1992).
Scientific Reports | (2021) 11:10932 | https://doi.org/10.1038/s41598-021-90407-z 12
Vol:.(1234567890)www.nature.com/scientificreports/
55. O’Brien, S. J. et al. Genetic basis for species vulnerability in the cheetah. Science 227, 1428–1434 (1985).
56. Ingvarsson, P. K. & Lundberg, S. The effect of a vector-borne disease on the dynamics of natural plant populations: A model for
Ustilago violacea infection of Lychnis viscaria. J. Ecol. 81, 263–270 (1993).
57. Carlson, S. M., Cunningham, C. J. & Westley, P. A. Evolutionary rescue in a changing world. Trends Ecol. Evol. 29, 521–530 (2014).
58. Gonzalez, A., Ronce, O., Ferriere, R. & Hochberg, M. E. (The Royal Society, 2013).
59. Fine, P. E. Herd immunity: History, theory, practice. Epidemiol. Rev. 15, 265–302 (1993).
60. Fontanet, A. & Cauchemez, S. COVID-19 herd immunity: Where are we?. Nat. Rev. Immunol. 20, 583–584 (2020).
61. Fine, P., Eames, K. & Heymann, D. L. “Herd immunity”: A rough guide. Clin. Infect. Dis. 52, 911–916 (2011).
62. Barbarossa, M. V. & Röst, G. Immuno-epidemiology of a population structured by immune status: A mathematical study of waning
immunity and immune system boosting. J. Math. Biol. 71, 1737–1770 (2015).
63. Hamami, D., Cameron, R., Pollock, K. G. & Shankland, C. Waning immunity is associated with periodic large outbreaks of mumps:
A mathematical modeling study of Scottish data. Front. Physiol. 8, 233 (2017).
64. Klepac, P. & Caswell, H. The stage-structured epidemic: Linking disease and demography with a multi-state matrix approach
model. Thyroid Res. 4, 301–319 (2011).
65. Anderson, R. M. & May, R. M. Population biology of infectious diseases: Part I. Nature 280, 361–367 (1979).
66. Colizza, V. & Vespignani, A. Epidemic modeling in metapopulation systems with heterogeneous coupling pattern: Theory and
simulations. J. Theor. Biol. 251, 450–467 (2008).
67. Stone, C. M., Schwab, S. R., Fonseca, D. M. & Fefferman, N. H. Human movement, cooperation and the effectiveness of coordinated
vector control strategies. J. R. Soc. Interface 14, 20170336 (2017).
68. Jiao, J., Pilyugin, S. S., Riotte-Lambert, L. & Osenberg, C. W. Habitat-dependent movement rate can determine the efficacy of
marine protected areas. Ecology 99, 2485–2495 (2018).
69. Keeling, M. J., Rohani, P. & Grenfell, B. T. Seasonally forced disease dynamics explored as switching between attractors. Physica
D 148, 317–335 (2001).
Acknowledgements
This work was partially supported by NSF EEID/DEB 1717498 and 2001213 and we are grateful to Nina H. Fef-
ferman’s lab, Joshua S. Weitz’s lab and NSF-Simons MathBioSys Research Center in Georgia Tech for conversa-
tions shaping this research.
Author contributions
N. F conceived the orginal idea; J.J came up with the detailed hypothesis and did the analyses; both authors
participated in manuscript writing.
Competing interests
The authors declare no competing interests.
Additional information
Supplementary Information The online version contains supplementary material available at https://doi.org/
10.1038/s41598-021-90407-z.
Correspondence and requests for materials should be addressed to J.J.
Reprints and permissions information is available at www.nature.com/reprints.
Publisher’s note Springer Nature remains neutral with regard to jurisdictional claims in published maps and
institutional affiliations.
Open Access This article is licensed under a Creative Commons Attribution 4.0 International
License, which permits use, sharing, adaptation, distribution and reproduction in any medium or
format, as long as you give appropriate credit to the original author(s) and the source, provide a link to the
Creative Commons licence, and indicate if changes were made. The images or other third party material in this
article are included in the article’s Creative Commons licence, unless indicated otherwise in a credit line to the
material. If material is not included in the article’s Creative Commons licence and your intended use is not
permitted by statutory regulation or exceeds the permitted use, you will need to obtain permission directly from
the copyright holder. To view a copy of this licence, visit http://creativecommons.org/licenses/by/4.0/.
© The Author(s) 2021
Scientific Reports | (2021) 11:10932 | https://doi.org/10.1038/s41598-021-90407-z 13
Vol.:(0123456789)You can also read