THE CRISIS OF LOW WAGES IN THE US - WHO MAKES LESS THAN $15 AN HOUR IN 2022? OXFAM Report - Oxfam America
←
→
Page content transcription
If your browser does not render page correctly, please read the page content below

UNCORRECTED PROOF | EMBARGOED UNTIL SEPTEMBER 1, 2021

 OXFAM Report

THE CRISIS OF LOW
WAGES IN THE US
WHO MAKES LESS THAN $15 AN HOUR IN 2022?

                                                                            No Relief: Denial of Bathroom Breaks in Poultry Industry   1
About the online interactive map of low wages

Since 2014, Oxfam has been producing interactive maps that illustrate percentages of
workers in the US earning low wages. The 2022 edition offers new research that shows
all workers earning less than $15 an hour, including minimum and subminimum wages.

The interactive map is here: www.oxfamamerica.org/lowwagemap2022

About the research and report

The author of this report is Kaitlyn Henderson, PhD; it is based on primary research by
Stephen Stapleton and Kaitlyn Henderson.

About the data

The Oxfam Minimum Wage Model sources microdata from the 5-year Census American
Community Survey (ACS-PUMS), and employs Current Population Survey (CPS-ORG) March
2021 data as formatted and made available by CEPR. For more, please see the section on
Methodology.

CONTENTS
INTRODUCTION                                                                              3

Stagnating Wages, Rising Inequality                                                       6

Oxfam Data                                                                                8

Race/Ethnicity                                                                           10

Gender                                                                                   13

Pandemic Profits                                                                         16

Living Wage                                                                              17

POLICY RECOMMENDATIONS                                                                  20

Raise the minimum wage                                                                   20

End State Wage Preemption Policies                                                       21

Subsidize Child Care Worker Wages                                                        21

Incentivize Living Wages Through Procurement Policy                                      21

METHODOLOGY                                                                             23

END NOTES                                                                               26

APPENDIX: TABLES OF DEMOGRAPHIC DATA                                                    30

2                                          The crisis of low wages in the US | Oxfam America
INTRODUCTION
In the United States there are millions of low-wage workers. As witnessed
throughout the COVID-19 pandemic, low-wage workers provide some of the most
essential services in the country. These are the workers who care for our loved
ones, transport and harvest our food, stock our shelves, and deliver our packages.
Without these workers, our economy grinds to a halt, as does the functioning of
our society. Despite their critical contributions, this workforce has been trapped in
working poverty for decades. In fact, according to data compiled by Oxfam, as of
2022, more than 31.9 percent of the US labor force, or 51.9 million workers,
currently make less than $15 per hour, and many are stuck at the federal minimum
wage, which is less than half of that hourly rate. 1 If Congress were to enact
legislation changing the hourly minimum wage and who qualifies—making the law
more equitable and inclusive—millions of workers would be lifted from poverty.

We use American Community Survey data to gather wages, demographics, and
household data. For more information, please visit the Oxfam website.

The last time the federal minimum wage changed was in 2009, when the wage was
lifted to $7.25 per hour. Even in 2009, the minimum wage was not sufficient to
provide for the most basic costs of living in any state in the United States. But in
2022, with inflation at a 40-year high, $7.25 covers very little. While many states
and cities have lifted their minimum wages above the federal minimum—in which
case the higher standard has precedence—it takes an act of Congress to lift the
wage floor for the whole country, something that would benefit all workers, even
those already making more than $7.25 per hour, and the US economy as a whole.

Additionally, many workers in the United States earn an even lower hourly wage
than $7.25. When the Fair Labor Standards Act (FLSA) was enshrined into federal
law in 1938, creating the minimum wage and provisions for overtime and child
labor, it excluded many workers from the newly created minimum wage mandate
and other protections. Among those excluded were farmworkers, domestic
workers, and restaurant workers—workforces that were overwhelmingly Black. In
1966, Congress amended the FLSA to include restaurant workers, 2 but these
workers were offered a subminimum “tipped wage,” with the assumption that
restaurant patrons would make up the difference in gratitude for hard work.
Legally, if tipped wage employees do not receive tips sufficient to at least equal
the minimum wage, employers are required to subsidize wages to equate to the
federal minimum wage. However, enforcement of this provision is difficult, and
rampant wage theft occurs within tipped wage industries. 3 Moreover, since 1991,
the federal tipped minimum wage in the United States has been stuck at $2.13 an
hour, an amount less than 30 percent of the federal minimum wage. 4

The crisis of low wages in the US | Oxfam America                                      3
In addition to restaurant workers being added to the FLSA at a subminimum wage in
1966, the FLSA evolved a few more times to reflect hard-won battles by workers
and worker advocates seeking higher wages and stronger inclusions. The
aforementioned 1966 amendment extended minimum wage provisions to some
farmworkers, and to workers in public schools, nursing homes, laundries, and
construction. Then, in 1974, the FLSA expanded to include many domestic workers,
and in the 1977 amendment, large agricultural employers were required to provide
minimum wages to their workers. In 1989, small retailers were required to pay
minimum wages.5 More recently, in 2015, minimum wages were extended to direct
care workers, a subcategory of domestic workers previously excluded, bringing
minimum wage mandates to certified nursing assistants, home health aides,
personal care aides, caregivers, and companions.6

Although the fight against minimum wage exclusions has won many important
victories, a handful of minimum wage exclusions exist, meaning employers can still
legally pay workers—known as subminimum wage workers—less than $7.25 per
hour. For example, full-time students can legally be paid 85 percent of the
minimum wage if they are employed 20 hours or less per week, eight hours or less
per day, during the school year and 40 hours per week when school is not in
session. Employers of full-time students include colleges and universities, and the
retail, service, and agriculture sectors. Similarly, high school students in vocational
fields of study can be paid 75 percent of the minimum wage. (Such jobs are often
called “shop courses,” 7 and student jobs at colleges and universities are often
known as “work-study” positions.) 8 Employers can also apply for a certificate from
the Department of Labor under section 14(c) of the FLSA that allows them to pay
workers with disabilities a subminimum wage. This exclusion from the minimum
wage for workers with disabilities is limited to individuals impaired by “a physical or
mental disability, including those relating to age or injury” and does not apply to
anyone “who works or handles goods that are moving in interstate commerce” or
works for a company with annual sales of $500,00 or more.9 While these exclusions
are discrete, none should exist.

Aside from tipped wage workers and subminimum wage workers, there remain other
workers who are not covered by the FSLA wage provisions. In the agricultural
sector, these workers include those who work for employers who did not utilize 500
“man days” of any quarter of the preceding year, piece-rate harvest workers
working less than 13 weeks per year, minors 16 and under hand-harvesting for
piece-rate pay working with their parents, agricultural employer family members,
and range workers for livestock. 10 In the care sector, certain home care workers
who provide what the Department of Labor terms “companionship services” or who
provide “fellowship and protection” to someone who is elderly, ill, injured, disabled,
or requires assistance caring for themselves are also excluded from FSLA
provisions. The exclusion of these workers requires they spend no more than 20

4                                         The crisis of low wages in the US | Oxfam America
percent of their workweek in companionship services, 11 and these workers are
excluded from overtime restrictions as well as federal minimum wage provisions. 12

The result of these laws is the reality of working poverty in the US: millions of
people working but living in poverty and anxiety, a single lost paycheck away from
despair. What would be a starting point toward eradicating working poverty in the
United States? Raising the minimum hourly wage for all workers to $15. We must
also end subminimum wages as a policy and include all workers within the
framework of minimum wage. Although Oxfam does not consider $15 per hour to be
a “living wage,” the long fight at the state and federal level for a $15 minimum
wage 13 is a starting point toward achieving true living wages, and created the
threshold for our calculation of low-wage workers in the United States. The 51.9
million workers in the United States who currently make less than $15 per hour
would be boosted by such an increase.

This report is a departure from Oxfam’s Minimum Wage Map presented in our report
Ten Years Without a Raise, published in 2019. That map focused on workers who
would benefit from a raise in the federal minimum wage, but it excluded workers
who did not earn a minimum wage. In this year’s report, the Low Wage Map is
reframed to focus on the impact of a universal minimum wage. The numbers of our
2022 map reflect not just who would benefit from a change in the federal minimum
wage, but who would benefit from a universal minimum wage, and how these
changes would advance the cause of racial, gender, and social justice in the
United States. As a consequence of this reframing, our numbers in 2022 include all
workers currently making less than $15 an hour: tipped wage workers, subminimum
wage workers, gig workers, farmworkers, care workers, and minimum wage workers
in all 50 states plus the District of Columbia and Puerto Rico.

Also, unlike our past minimum wage maps and reports, this report marks the first
time Oxfam has included Puerto Rico in our analysis. Although a commonwealth
rather than a state, Puerto Rico maintains the ability to set its own minimum wages
laws and standards. The island until recently followed US federal minimum wages,
but on September 21, 2021, the governor of Puerto Rico signed the “Minimum Wage
Act,” which created a higher minimum wage on the island as of January 1, 2022.
The act raised the hourly minimum wage from $7.25 to $8.50, and includes
mandates for continued wage increases in 2023 and 2024. The act also created a
new commission—composed of members of the Department of Labor,
representatives of labor unions, representatives of business and industry, and an
economist referred by the University of Puerto Rico—that sits within the
Department of Labor and oversees the enactment of the new minimum wage law.
Puerto Rico’s legislation is but one example of local governments stepping up to
compensate for federal inaction on wages. Also, although Puerto Rico raised its

The crisis of low wages in the US | Oxfam America                                    5
minimum wage in 2022, the increase still only benefits workers covered by the
FLSA.

Oxfam’s 2022 Low Wage Map asks not just who makes the federal minimum wage,
but who makes less than $15 per hour. Given that a wage of $15 per hour translates
to only $31,200 a year for a full-time worker at 40 hours per week, the results of
this research are shocking and unacceptable for any society, let alone one of the
richest countries in the world.

STAGNATING WAGES, RISING INEQUALITY
Over the past 50 years, wealth inequality in the United States has grown
astronomically. According to economist Emmanuel Saez, the top 10 percent of
earners in the US make more than nine times as much as the bottom 90 percent. 14
This disparity grows worse when considering the top 0.1 percent of earners in the
United States. Those at the very top in the US are making 196 times the income of
the entire bottom 90 percent. 15 Such huge differences are not natural. They are
created through policy that prioritizes shareholders and corporations over working
people and that keeps minimum wages stagnating at low levels. These policy
choices create a lack of oversight that allows wealth to grow unchecked at
exponential levels, while full-time working families making the minimum wage are
trapped in cyclical poverty.

Our current 13-year period of minimum wages stuck at $7.25 is officially the
longest that Congress has gone, since the creation of the FLSA during President
Roosevelt’s New Deal, without raising the minimum wage. Adjusted for inflation,
the highest value of the minimum wage occurred in 1968 and has been eroding ever
since. In today’s dollars, the minimum wage in 1968 was the equivalent of $11.12
per hour. When adjusting for inflation, the current minimum wage was worth 21
percent more when it passed in 2009, making real earnings at that time equivalent
to $9.17 an hour in today’s market. 16 The buying power of the current minimum
wage has not kept up with real cost of living or inflation since it was passed 13
years ago. Now with the impact of the COVID-19 pandemic on the global supply
chain driving up the price of even the most basic foodstuffs, 17 compounded by the
country’s lack of an adequate social safety net, 18 even more families are put at risk
by federal inaction on wages. Figure 1 illustrates the real value of the US federal
minimum wage from 1938 to 2021.

6                                        The crisis of low wages in the US | Oxfam America
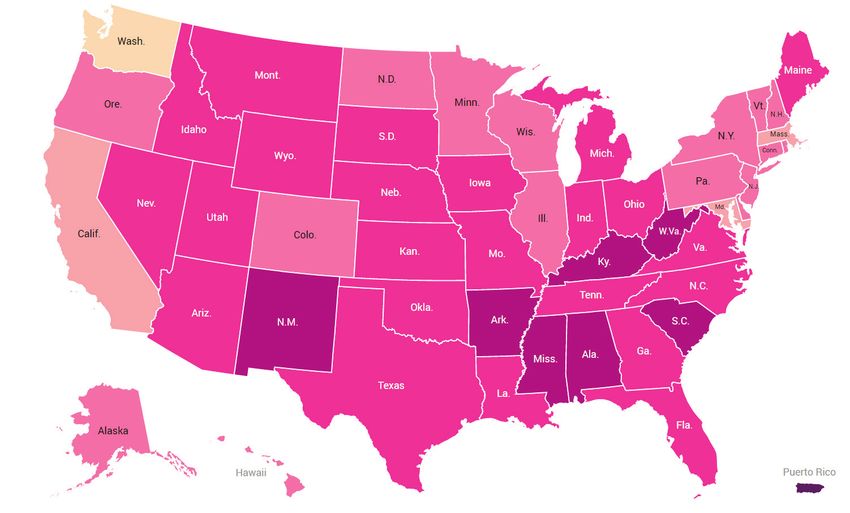
Figure 1. Real value of the federal minimum wage, 1938–2021

     All values are in June 2021 dollars. Source: Economic Policy Institute, based on FLSA and amendments.
https://www.epi.org/blog/the-minimum-wage-has-lost-21-of-its-value-since-congress-last-raised-the-wage/

President Roosevelt’s New Deal established the minimum wage in 1938 to help lift
the pay floor for workers in the US, to boost purchasing power to help restart the
economy, and to combat the widespread poverty created during the Great
Depression. 19 However, this policy has failed to keep up with rising inflation and it
excluded many workers of color from the start.

As noted, the FLSA also includes parameters for subminimum wage work that
enable employers to pay wages even below the federal minimum. Tipped wage jobs,
or jobs such as those in the restaurant industry that assume workers will receive at
least $30 a month in tips, are jobs where employers are federally required to pay a
“direct wage” of only $2.13 an hour. These tipped jobs, held largely by women and
disproportionately by women of color, are impacted by the reality of rampant wage
theft. According to the National Women’s Law Center, the poverty rate of tipped
wage workers is 2.5 times that of workers overall. 20 And as mentioned above, some
workers are still excluded from FLSA minimum wage provisions. Oxfam believes that
caveats to paying workers the minimum wage, already a poverty wage in the US,
must be eliminated.

The crisis of low wages in the US | Oxfam America                                                        7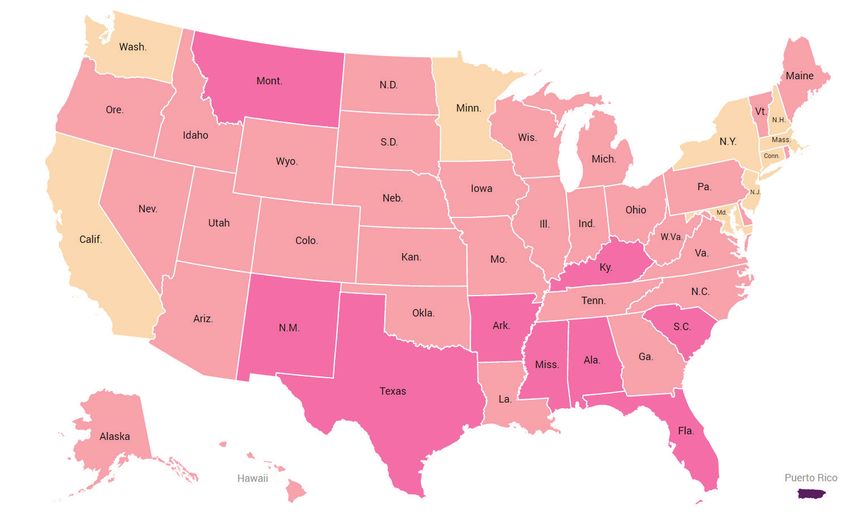
OXFAM DATA
The new interactive low wage map from Oxfam American illustrates the numbers
and percentages of workers who would benefit from an end to subminimum wages
and a raise in the federal hourly minimum wage to $15. Our map shows
demographic details of this population for all 50 states plus the District of
Columbia and Puerto Rico. These numbers are a representation of full-time working
individuals, ages 16 and up, and include parental status, as well as an
intersectional analysis of race and gender.21 The numbers are stark:

      •    Almost one-third (31.9 percent) of the labor force in the United States earns
           less than $15 per hour as of 2022. In other words, more than 51.9 million
           people in the United States are earning less than $31,200 a year.
      •    Ending subminimum wages and increasing the minimum wage would have
           an immense impact on historically marginalized communities.
               o 39.9 percent of self-identified women in the workforce (30.8 million)
                   are making less than $15 an hour.
               o 50 percent of self-identified women of color in the workforce (14.7
                   million) are making less than $15 an hour.
               o Four in 10—41.8 percent (25.7 million)—of self-identified people of
                   color in the workforce are making less than $15 an hour.
               o Well over half of self-identified single parents—57.5 percent (11.2
                   million people—make less than $15 an hour.
               o The overwhelming majority of people who would benefit from a raise
                   in wages are not teenagers, but adults. While some 5.8 million
                   teenagers (ages 16–19) make less than $15 per hour, 46.1 million
                   adults (ages 20 and up) make less than $15 per hour.

Our data demonstrate how working families, working women, and especially
working women of color are struggling in the face of low wages—despite their
inherent worth and dignity, not to mention the tremendous value they create for
employers and society. The solution is simple: Congress must act, and must act
quickly.

    Sex versus gender

    Because Oxfam relied on census data for demographic information, our demographic
    parameters reflect the limitations created by the census around expressing one’s
    identity. In terms of gender, census forms only offer options within the binary of male
    versus female, which are biological designations, often referred to as a person’s sex and
    not forms of self-expressions often associated with expressions of gender. However,
    because the census allows an individual to choose for themselves the assignation,
    throughout this report we use the term women, which is a considered a more expansive
    gender identity. Oxfam is cognizant that when filling out a census form not all people are

8                                              The crisis of low wages in the US | Oxfam America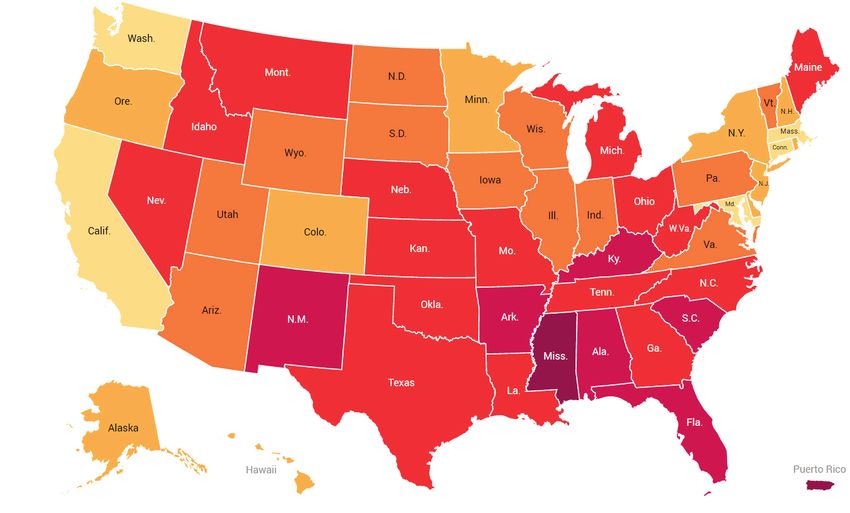
thinking of their biology and they may choose instead the category that best aligns with
 their gender identity. And as the term sex is misleading, Oxfam refers to the maps
 focusing on male versus female workers as gender and not sex, but it is important to
 identify and acknowledge the difference between expressions of identity and the weight
 they carry. While biological sex is an assignation at birth, gender is an expression of self.
 The census allows people to choose their sex for themselves, though it still only allows
 individuals to choose within a binary. Although Oxfam does not condone this limited
 understanding of gender, our research depended on–and is limited by–this data source.

Figure 2. Map of all workers who earn less than $15

At the national level, and as we have seen in Oxfam’s 2021 Best States to Work
Index, there are huge discrepancies in income and wages based simply on where a
worker lives. 22 As demonstrated in the national map of all workers (Figure 2), the
states in darker red have a higher percentage of workers who would benefit from a
higher wage, while states in lighter colors have a lower percentage. The US South
performs worst, where in states like Mississippi a full 45 percent of the state’s
workforce earns under $15 an hour. This percentage is even larger in Puerto Rico,
where 76.5 percent of the island’s workers earns less than $15 per hour.

The crisis of low wages in the US | Oxfam America                                                9
On the other end of the spectrum, in states with higher minimum wages (and, in
some cases, an equivalent tipped wage), a lower percentage of people earns under
$15 per hour. Indeed, the place with the highest minimum wage—the District of
Columbia—leads the country with the lowest percentage of workers earning wages
under $15 an hour. As the only district or state with a current minimum wage of
more than $15 an hour, the percentage of DC workers earning under $15 (8.5
percent) is a reflection of subminimum wage earners in the district, as DC still has
a lower tipped wage than minimum wage. Washington state has a minimum wage of
$14.49, and only 14.2 percent of its workforce earns under $15. Next, California,
with its strong minimum wage and equivalent tipped wage, has 17.9 percent of
workers earning under $15. The impact of strong wage policies determines whether
families can afford to pay their bills and live free of the fear that a single lost
paycheck will spell ruin. The difference is powerful.

RACE/ETHNICITY
The United States has long had a race-based wage gap, where workers of color
receive lower pay than their white peers for the same job, task, or role. This pay
gap is widest between white and Hispanic/Latinx workers, where for every dollar
earned by a white worker, a Hispanic/Latinx worker earns 73 cents. This pay gap is
especially striking given that Hispanic/Latinx workers comprise the largest
proportion of workers after white workers in the United States. At the national
level, white workers make up 63 percent of the workforce; of the remaining 37
percent of workers, Hispanic/Latinx workers represent nearly half that number,
accounting for 17 percent of the workforce. 23

10                                      The crisis of low wages in the US | Oxfam America
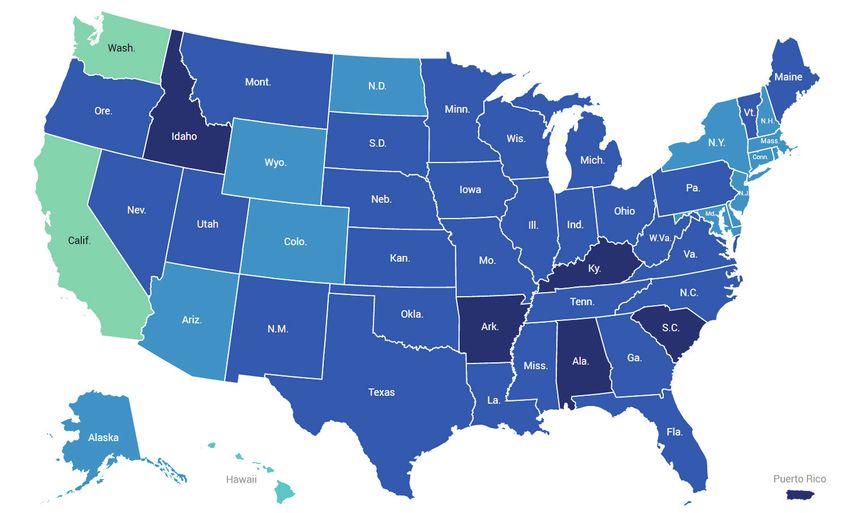
Figure 3. Map of Hispanic/Latinx workers who earn less than $15

According to Oxfam data, 46.2 percent of Hispanic/Latinx workers earn less than
$15 per hour at the national level, though this percentage may be higher in some
states. In Texas, for example, where the hourly minimum wage is stuck at the
federal minimum of $7.25 and there is a large Hispanic/Latinx population, more
than 54.2 percent of Hispanic/Latinx workers earns less than $15 per hour. In
California, which has the country’s largest Hispanic/Latinx population and one of
the highest state-level minimum wages, 28.8 percent of Hispanic/Latinx workers
earn less than $15. Figure 3 shows the states where Hispanic/Latinx workers earn
less than $15.

At the national level, after Hispanic/Latinx workers, Black workers comprise the
second-largest proportion of workers of color. Per the Department of Labor, 11
percent of workers in the United States are Black, and yet a strong wage gap
between Black workers and their white counterparts persists. For every dollar a
white worker earns, a Black worker earns 76 cents. 24 This wage gap is also
represented by the disproportionate percentage of Black workers at the national
and state level earning less than $15 per hour. According to Oxfam’s data, 47
percent of Black workers earn less than $15 per hour. In the Deep South, where

The crisis of low wages in the US | Oxfam America                                  11
minimum wages are lower and the historical legacy of racism and slavery cuts
deep, the proportion of Black workers earning less than $15 per hour goes well
above the national average of 47 percent. Figure 4 shows the states where Black
workers earn less than $15.

Figure 4. Map of Black workers who earn less than $15

In Mississippi, which has a high percentage of Black residents, 62.9 percent of
Black workers earn less than $15 per hour. In Louisiana, the proportion of Black
workers earning less than $15 per hour also eclipses the national average, coming
in at 58.1 percent.

The percentages of workers of color earning less than $15 per hour at the national
and the state levels is worrying, and have implications beyond hourly or annual
wages. The persistence of racialized pay gaps contributes to racialized wealth
gaps (meaning disparities in the building of financial stability and financial freedom
in the form of equity). According to the Federal Reserve, familial- or generational-
built wealth among families varies significantly by race. As of 2020, white families
had eight times the typical wealth of a Black family and five times the wealth of a
Hispanic/Latinx family. 25 The low-wage economy in the United States, which relies

12                                       The crisis of low wages in the US | Oxfam America
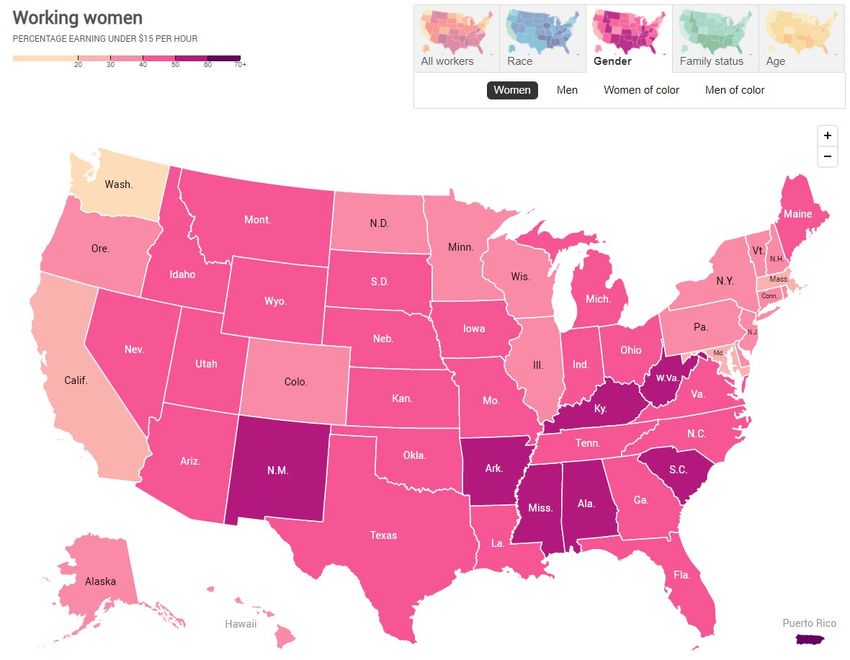
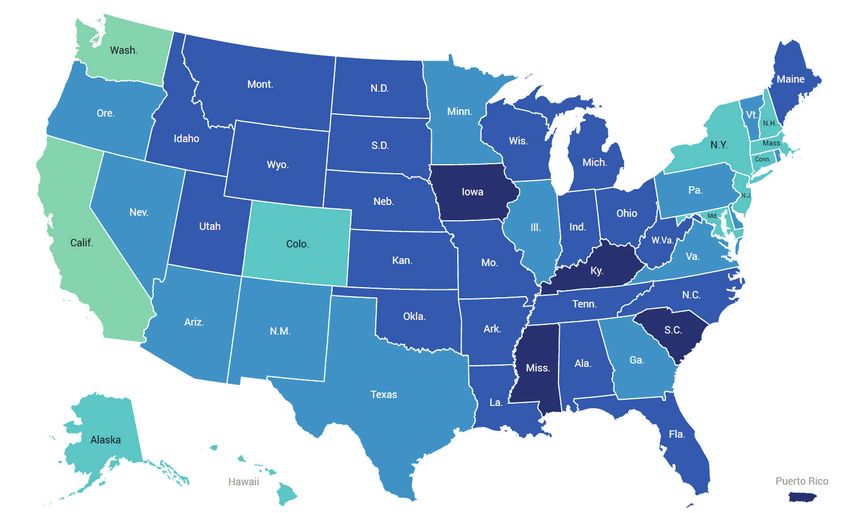
on the cheap labor of workers to keep consumer costs low and shareholder returns
high, has long contributed to these wealth disparities. And although wages alone
are not the sole culprit for gross wealth disparities among communities of color, 26
the reality that low-wage workers are disproportionately workers of color and are
long deserving of higher wages is undeniable.

GENDER
When focusing on gender, our results are also striking. For every state—even those
with a smaller proportion of the working population earning less than $15 per
hour—the percentage of workers earning below $15 per hour is higher for women
workers. The gender pay gap in the United States holds true regardless of income
level, but women are also often occupationally segregated into lower-income jobs.
According to the National Women’s Law Center, at the national level, women
comprise nearly six of 10 low-wage workers, despite representing only 47 percent
of the workforce. 27 The gendered impact of low-wage work is made clear by
Oxfam’s findings and can be seen in Figure 5.

The crisis of low wages in the US | Oxfam America                                 13
In Mississippi, the only state in the country that does not have an equal pay
mandate in law, and a state where more than 45 percent of workers earn less than
$15 per hour, the percentage of women earning less than $15 per hour rises to 55.2
percent. Even in the District of Columbia, where 8.5 percent of workers make less
than $15 per hour, the percentage of women making less than $15 per hour climbs
to 11.6 percent.

Moreover, the pandemic has demonstrated the way US society places less value on
what is often considered “women’s work.” The most striking example, made
abundantly clear by COVID-19, is the way society undervalues—and underpays—
child care workers. In the United States, more than 95 percent of child care workers
are women, disproportionately women of color, and they are notably underpaid. 28
The average annual salary of a child care worker in 2021 was $24,230, or less than
$12 per hour.29 These crucial service providers, needed by countless working
families, are monetarily valued less in our society than all other teachers, including
preschool and kindergarten teachers.30

14                                       The crisis of low wages in the US | Oxfam America
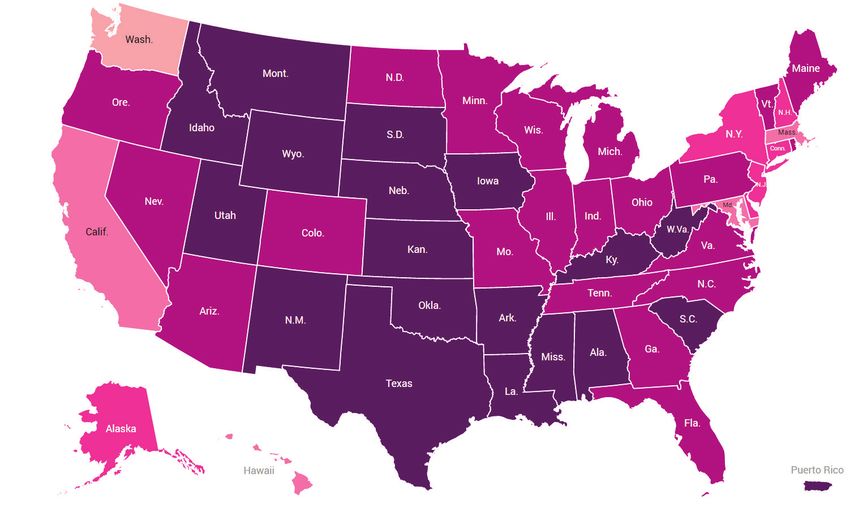
While gendered work is clearly valued less in the United States, this reality
becomes more shocking when seen through an intersectional lens. While women
continue to be paid less than men for the same work, women of color in the United
States earn lower wages still. Based on Oxfam’s low-wage modeling, the proportion
of women of color earning less than $15 per hour at every state level shoots above
even the women’s metric (Figure 6).

When looking at the same two places representing opposite ends of a worker wage
spectrum in the United States—DC and Mississippi—the results continue to be
astounding. In Mississippi, where 45.3 percent of all workers make less than $15
and 55.2 percent of women make less than $15, the share of those making less
than $15 per hour rockets up to 69.7 percent for women of color. In other words,
more than two out of every three working women of color in Mississippi make less
than $15 per hour. In the District of Columbia, where 8.5 percent of workers make
less than $15 per hour and 11.6 percent of women make less than $15 per hour, the
percentage grows to 16.9 percent for women of color. The importance of this
intersectional analysis allows us to understand the myriad ways bias and systemic
marginalization affect people whose multiple identities target some form of

The crisis of low wages in the US | Oxfam America                               15
discrimination. For women of color, their race and their gender create layered
discriminations that result, in this case, in disproportionately low wages.

While race is a huge factor behind pay gaps in the United States, the worst pay gap
is experienced by women of color. Women in general are typically paid 83 cents on
the dollar for every white non-Hispanic man in the same role. Yet when taking race
as well as gender into account, pay falls even lower. On average, Black women are
paid 64 cents to the dollar earned by white men peers; American Indian women are
paid 60 cents; and Latina or Hispanic women 57 cents. 31 These compounding
marginalizations, a dynamic for which civil rights lawyer and scholar Kimberlé
Crenshaw coined the term “intersectional” in 1989, define how systems in the
United States have long been built to specifically benefit white men to the harm of
all others. 32

As we seek to build and create new policy solutions, we must first understand the
multiple and intersecting systems at play that maintain imbalanced power
structures. Only with the deep knowledge of how systems, such as pay structures,
keep women of color at a purposeful and structural disadvantage can we write new
policies to create more equitable systems. One of the most important steps toward
this goal is to eradicate subminimum wages, particularly given that women, and
especially women of color, are disproportionately represented in tipped wage
positions. And in states that continue to have a subminimum tipped wage, poverty
rates are nearly 30 percent higher than states where the minimum wage is
extended to tipped wage workers. 33

PANDEMIC PROFITS
In January 2022, the US Bureau of Labor Statistics (BLS) released new information
on inflation revealing that by the end of December 2021, 12-month inflation had
reached its highest level since 1982, at 7 percent above the previous year, with the
cost of nearly everything increasing. The highest gains in average prices, according
to the Consumer Price Index (CPI), were in housing costs, used vehicles, and food; 34
two of these three areas (housing and food) are where low-income families spend
the majority of their 16ncomees.35 Essentially, over the course of the second year
of the pandemic, with the impact of shipping delays and supply chain disruptions,
everything US consumers buy became notably more expensive. With wages
continuing to stagnate, the power of the dollar continuing to fall, and inflation at a
generational high, the ability for workers and working families to afford even the
most basic foodstuffs is called into question.

The economic impact of the COVID-19 pandemic was not shared equally among all
members of US society. Although essential workers36 earned hazard or “hero” pay in

16                                       The crisis of low wages in the US | Oxfam America
2020 for continuing to show up at their jobs and thus keeping our society
connected and alive at the beginning of the pandemic, these pay benefits stalled
or ended in 2021, leaving essential workers (who continued to be at high risk of
illness because of their jobs) without appropriate pay or a social safety net.37 And
essential workers comprise a disproportionate percent of workers making less than
$15 an hour. Almost half (47 percent) of essential workers make less than $15 per
hour. So, despite COVID-19 shining a spotlight on how important the warehouse
workers, delivery drivers, and grocery workers are, in the United States these
crucial workers still make an inadequate wage. 38 Meanwhile, on the other end of
the economic spectrum, the shareholders and executives of the largest
corporations in the US realized record profits.

Even before the pandemic, CEOs were earning well beyond their fair share of profits
from their organizations. According to a report by the Economic Policy Institute
(EPI), as of 2019, CEOs are paid an average of 320 times what a typical worker
employed at their company earns. In 1989, the same ratio of CEO-to-worker pay
was 61-to-1. From 1978 to 2019, worker pay grew an average of 14 percent. For
CEOs, the rate was 1,167 percent. 39

Through the COVID-19 pandemic, as workers were let go and production slowed,
CEO profits grew at astronomical rates. The embrace of shareholder capitalism has
led to gross economic inequality where even as companies are closed and workers
are furloughed or laid off, the profits of CEOs and shareholders soared. 40

In the United States, the value we attribute to shareholders is somehow greater
than the value we attribute to the workers who make our society function. The
COVID-19 pandemic made that disparity abundantly clear. It is long past time to
adjust our priorities to reflect the value and decency inherent in all work by paying
workers a higher wage, adjusting the compensation of CEOs and shareholders, and
moving to an economic model that prioritizes people over profits. As Senator
Elizabeth Warren demonstrated in 2019, only two pennies on the dollar of every
person earning more than $1 million per year would offset these enormous and
disproportionate gains of the last many years to broaden our country’s social
safety net and ensure a more equitable redistribution of resources. 41

LIVING WAGE
The concept of a living wage is a powerful one that is easily grasped and
recognized, yet difficult to codify and define. This difficulty is partly because it is a
concept that must be flexible enough to reflect local economic and cultural
realities, yet robust enough to prevent misapplication. At their heart, living wages
are about working families being able to afford a basic but decent lifestyle in the

The crisis of low wages in the US | Oxfam America                                      17
context of their local communities, including, at a minimum, sufficient income to
cover necessities like food, housing, (including heating or cooling and other
utilities), transportation, health care, child care, taxes, and more. Living wages
should also allow for saving for life’s inevitable contingencies, like weddings and
funerals, and some discretionary spending for entertainment that is part of leading
a decent life. The concept is central to the social contract and the American
Dream—it is the essential promise upon which our economy functions: that workers
can survive on the wages they earn from their labor. Where the promise is broken,
we see a path of unsustainability, poverty, and precarity with wide-reaching
impacts.

The idea of living wages has been effectively deployed by advocates and politicians
who leverage its compelling and self-evident nature to advance the cause of low-
wage workers. Sometimes companies have applied it to themselves after wage
increases in efforts to improve their image—but in Oxfam’s view, living wages
cannot be measured in isolation, focused exclusively on a number; they must be
understood holistically and within the context of a worker and their family’s well-
being. So, for instance, a company that pays a higher hourly wage but cuts hours
and benefits to keep workers in precarity is not providing living wages.

Our interactive map and data demonstrate the proportion of state-level populations
making less than $15 per hour and advances the argument that the United States
needs a universal minimum wage devoid of exceptions or exclusions. However, we
recognize that a $15 hourly wage is not adequate to provide for a basic but decent
standard of living for a family in the vast majority of the US. Although the $15 figure
has become an effective and powerful rallying cry, and some politicians and others
have equated it to a living wage, most activists in the wage movement
acknowledge that it is just a start. This shortfall, for instance, is why the Fight for
$15 movement is most properly understood as the fight for $15 and a union. 42
Advocates recognize that a wage of $15 per hour is not a ceiling but a floor for
decent livelihood in America, and that only when it is paired with strong worker
voice and decent work can it be secure. In the American policy environment, it is
vital that we not let the perfect be the enemy of the good. A $15 per hour wage is a
vital first step on a longer path to true living wages that can sustain a family and
lift working families and the American economy from its current unsustainable
trajectory.

But what is a living wage, and how can we recognize it? How can consumers
support and incentivize companies to pay living wages? The details can be
complex, but broadly speaking, there is a global consensus around the definition
adopted by the Global Living Wage Coalition:

       The remuneration received for a standard work-week by a worker in
       a particular place sufficient to afford a decent standard of living for

18                                        The crisis of low wages in the US | Oxfam America
the worker and her or his family. Elements of a decent standard of
living include food, water, housing, education, health care,
transportation, clothing, and other essential needs including
provision for unexpected events. 43
In 2021, Oxfam America developed a voluntary living wage standard for US
employers called Living Wage For US, 44 which calculates benchmarks of living
wages in every county in the US and helps incentivize and celebrate employers who
meet the Living Wage for US standard. This standard was developed in dialogue
with labor advocates and other allied organizations, as well as forward-looking
employers, and it is grounded in a robust methodology that aligns with globally
recognized best practices for determining living wages.
The crisis of low wages in the US | Oxfam America 19POLICY RECOMMENDATIONS
RAISE THE MINIMUM WAGE
• At the federal level, it is long past time that Congress pass the Raise the
Wage Act to raise wages beyond poverty levels and solve many of the
crucial deficiencies and unacceptable exclusions in our national minimum
wage regime (see the text box below for details on the Raise the Wage Act).
• Beyond creating a universal minimum wage and raising the wage floor to
$15 per hour for all workers, Congress can index wage increases to
inflation, similar to the system used for increases to Supplementary
Security Income, Social Security payments, and civil service retirement,
military retirement, and veterans’ pensions and compensation, among other
retirement programs. The precedent set within the federal government for
inflation indexes creates a strong option for minimum wage legislation at
the federal level. The District of Columbia and many states—including
Colorado, Maine, Minnesota, Montana, New York, South Dakota, Vermont,
and Washington—have already adopted this approach for setting new
minimum wages.
• States and localities can also lead the way, implementing their own
versions of minimum wage laws. It is vital that such laws not only raise
wages to higher thresholds, but also close gaps and deficiencies in the
federal minimum wage, like the exclusion of many categories of workers
from minimum wage protections.
THE RAISE THE WAGE ACT OF 2021
The act, introduced in the House and Senate in January 2021, would:
- Gradually increase the hourly minimum wage from $7.25 to $15 within four years of
enactment.
- Create a system for future increases tied to median wage growth to be sure the
value of the minimum wage does not weaken over time.
- Gradually increase the subminimum wage for tipped workers from $2.13 (set in 1991)
to the full federal minimum wage.
- Repeal the youth subminimum wage (which allows employers to pay $4.25 per hour
to workers under 20 for 90 calendar days).
- End subminimum wage certificates for workers with disabilities, and make all
workers eligible for the minimum wage.
20 The crisis of low wages in the US | Oxfam AmericaEND STATE WAGE PREEMPTION POLICIES
• Many states have policies prohibiting localities from setting minimum
wages above state wages. While the federal government continues to delay
creating a higher minimum wage and ending subminimum wages, states
have the power to end wage preemption (or the restriction of cities,
counties, or localities from setting their own higher wages from state
standards). Ending such policies creates an opening for localities to
establish living wage provisions and to reflect the true cost of living at the
local level within their local minimum wages. 45
SUBSIDIZE CHILD CARE WORKER WAGES
• In this report, we discuss how child care is one of the most underpaid
professions in the United States. The wages of child care workers certainly
need to be increased to at least $15/hour, though as the industry exists
now, increases in wages equates to an increase in child care costs for
families. Similar to K–12 education in the US, the federal government needs
to heavily subsidize the child care and the early learning sector so that
child care workers can earn a decent wage, while families pay no more than
7 percent of their income on child care (what the Department of Health and
Human Services deems “affordable child care”). The federal government
must subsidize the child care sector nationally to enable childcare workers
to be paid a higher wage.
INCENTIVIZE LIVING WAGES THROUGH PROCUREMENT
POLICY
• Governments at all levels also have a range of additional levers they can
pull to incentivize, if not require, the payment of robust living wages within
their jurisdiction. One of the most powerful tools is the power of
procurement policies. Procurement requirements can be restructured in
ways that provide additional incentives (or remove disincentives) for
bidders who can demonstrate that they are paying their workers a living
wage. At the federal level, the US government is the single largest buyer of
goods and services in the world; such purchasing power can translate into
significant leverage and impact.
• The Biden administration’s rule requiring a $15 wage per hour for employees
of federal contractors, which went into effect on January 30, 2022, is one
example of this kind of procurement policy. Making wages of at least $15
per hour a clear requirement for contractors raises wages for approximately
The crisis of low wages in the US | Oxfam America 21390,000 workers, the majority Black or Hispanic, 46 and has ripple effects
beyond that contractor workforce. However, as we know, $15 per hour is
not a living wage in most of the US, and the administration could go further
by awarding additional points in procurement bidding for employers willing
to go above and beyond this threshold. This approach would be
substantially different from the Fair Pay and Safe Workplaces rule of the
Obama administration, which also sought to leverage the federal
procurement system, in that case by requiring disclosure of past significant
labor rights violations by prospective contractors. (Fair Pay and Safe
Workplaces was rescinded by Congress under the Congressional Review Act
at the start of the Trump administration.)
• Another example of such a system is the Good Food Purchasing Program,
which leverages municipal procurement to advance a set of core values,
including labor rights.47 Such systems can and should be implemented by
municipal and county governments, and should include a specific focus on
promoting living wages among the publicly funded workforces in their
communities.
22 The crisis of low wages in the US | Oxfam AmericaMETHODOLOGY The Oxfam Low Wage Model sources microdata from the most recent 5-year American Community Survey (ACS-PUMS) 48 to generate a sample of wage earners (a snapshot of people at the national and state level). It then employs Current Population Survey (CPS-ORG) data compiled by the Center for Economic and Policy Research (CEPR) 49 to model the hourly wage of these populations, and ultimately it simulates how these wages might change if subminimum wages were abolished and all workers made a minimum of $15 per hour. This model is built specifically to estimate how a universal minimum wage increase impacting both tipped and non- tipped workers would change wages in the 50 US states, the District of Columbia, and Puerto Rico. Our construction also allows us to estimate who may be locked out of federal legislation owing either to their exclusion (see introduction for explanation of excluded workers) or to wage theft practices. 50 To construct the model, microdata from currently working individuals 16 and older are weighted to form a representative sample of the civilian labor force at the state level. This weighting is done through an iterative fitting process called “raking,” whereby survey responses are reweighted to better represent state aggregate demographics like age distribution and proportions of gender, races/ethnicities, family status, education level, and the interaction between these various characteristics. Oxfam uses projected national-level growth rates for various key demographics to simulate changing working population composition and size from data sourced in 2019 to 2022. Sample weights are scaled to Bureau of Labor Statistics civilian labor force estimates so that projected numbers of low-wage workers are consistent with reported 2021 state-level statistics. Next, hourly wages are modeled and refined through a modification of the Economic Policy Institute’s minimum wage simulation model.51 There are two primary limitations of using ACS microdata in calculating hourly wages: (1) respondents report the number of weeks worked within bins rather than exact counts, and (2) reported total wages are more prone to error, introducing a degree of variation that may mask demographic trends in wage disparities. To identify a discrete number of weeks worked, we use a secondary data source (CPS-ORG). CPS reports discrete weeks worked values for respondents, meaning we may create an ordinary least squares (OLS) regression model from shared demographic and workplace variables to predict weeks worked in our primary data sample. 52 Weeks worked are modeled with respect to respondent demographics like race/ethnicity, gender, and family composition, in addition to employment characteristics like industry, occupation, and full-time status. A separate model is created for each weeks worked bin, and state-level fixed effects are added to The crisis of low wages in the US | Oxfam America 23
account for any variation at the state level. CPS-ORG data is collected in March,
meaning the removal of workers reporting 13 or fewer weeks worked, given this bin
is significantly wider, introducing a high degree of variance highly dependent on
model specification. 53 From these data, we derive a first calculated hourly wage for
each worker in our sample.

Because our analysis is specifically interested in demographic wage disparities, we
average this first calculated wage with a secondary measure derived by modeling
hourly wage directly from respondent demographic characteristics. This calculation
is especially important for smaller demographic groups, where wage reporting error
may lead to severe underreporting of low-wage workers in our model. This step is
again done with CPS-ORG data, which tends to have more accurate wage reporting.
In a similar fashion to the weeks worked model, hourly wage is predicted from
respondent demographics and employment characteristics and includes state and
survey year fixed effects.

This modeling approach gives us a more reasonable distribution of wages by state
and survey year. However, it does not account for the fact that wages have
changed over the five-year survey. To pull all hourly wages forward to 2019 dollars,
we assume that workers in a certain percentile of a state’s wage distribution for a
given year would be making the same as a worker in a similar wage percentile for
that state in 2019. 54 We use the 2019 state-level distribution of hourly wages from
the CPS-ORG data for this final step of wage corrections. Using this approach has
the added benefit of partially correcting for the long tails of our hourly wage
predictions, as CPS-ORG wage data is less prone to mismeasurement.

Wages may also naturally grow due to macroeconomic factors beyond the control
of state legislatures. To account for this growth, we calculate statewise average
wage growth rates by comparing the most recent five years of CPS-ORG hourly wage
data available for the bottom 20 percent of hourly wages in each state. Because
these data only capture wage changes up to 2019, we impose an assumption of
zero real wage growth from 2020 to 2021 to down-weight assumed natural growth
rates.55

Finally, the impact of scheduled minimum wage changes is modelled into 2022. We
account both for workers specifically targeted by a minimum wage increase, and
for workers who might be proximally affected due to having a wage at or near the
new minimum wage. It is of note that even after correcting for wage
mismeasurement, a number of workers are still reporting an hourly wage well
beneath their state’s minimum wage for non-tipped employees. We assume
workers making less than 70 percent of the current minimum wage would not
benefit from non-tipped minimum wage increases, either because of wage theft
practices or because they are employed as a tipped worker. As such, there are a
substantial number of workers who remain locked out of rising wages in our

24                                       The crisis of low wages in the US | Oxfam America
simulation. After modeling wages out to 2022, we calculate what proportion of
workers are earning less than $15 per hour at both state and aggregate levels both
for the population as a whole and for specific demographic groups of policy
interest.

The crisis of low wages in the US | Oxfam America                               25
END NOTES

1
 Our estimates project 162.89 million people in the total labor force in the United States. For a full explanation of
our calculations, see the methodology section.
2
 Michelle Alexander, “Tipping Is a Legacy of Slavery,” New York Times, February 5, 2021,
https://www.nytimes.com/2021/02/05/opinion/minimum-wage-racism.html; and Sylvia A. Allegretto and Steven
C. Pitts, To Work with Dignity: The Unfinished March Toward a Decent Minimum Wage (Economic Policy Institute,
2013), 12, https://files.epi.org/2013/Unfinished-March-Minimum-Wage.pdf.
3
 See No Rights, Low Wages, No Service: How Increased Violations of Workers’ Rights in 2021, Coupled with High
Harassment and Low Wages and Tips, Have Pushed Workers to Leave the Service Sector (One Fair Wage and Food
Labor Research Center, 2021), https://onefairwage.site/wp-
content/uploads/2021/09/OFW_NationalWageTheft.pdf.
4
  Many states have eliminated the subminimum tipped wage, offering the minimum wage to tipped wage workers
instead. These states include Alaska, California, Minnesota, Montana, Nevada, Oregon, and Washington. For more
state-level wage policies, see Oxfam’s Best States to Work Index at
https://www.oxfamamerica.org/explore/countries/united-states/poverty-in-the-us/map-best-states-to-work-
2021/.
5
 US Department of Labor, Wage and Hour Division, “History of Changes to the Minimum Wage Law,” n.d.,
https://www.dol.gov/agencies/whd/minimum-wage/history.
6
 US Department of Labor, Wage and Hour Division, “Fact Sheet: Application of the Fair Labor Standards Act to
Domestic Service, Final Rule,” September 2013, https://www.dol.gov/agencies/whd/fact-sheets/flsa-domestic-
service.
7
 US Department of Labor, Wage and Hour Division, “Questions and Answers About the Minimum Wage,” n.d.,
https://www.dol.gov/agencies/whd/minimum-wage/faq#full.
8
    All employers of full-time students require a certificate from the Department of Labor to pay these lower wages.
9
 US Department of Labor, Wage and Hour Division, “Fact Sheet #39: The Employment of Workers with Disabilities at
Subminimum Wages,” revised July 2008, https://www.dol.gov/sites/dolgov/files/WHD/legacy/files/whdfs39.pdf.
10
  US Department of Labor, Wage and Hour Division, “Fact Sheet #12: Agricultural Employers Under the Fair Labor
Standards Act,” revised January 2020, https://www.dol.gov/sites/dolgov/files/WHD/legacy/files/whdfs12.pdf.
“Man days” are any day an employee performs agricultural work for at least one hour.
11
  US Department of Labor, Wage and Hour Division, “Fact Sheet #79A: Companionship Services Under the Fair Labor
Standards Act (FLSA),” September 2013, https://www.dol.gov/agencies/whd/fact-sheets/79a-flsa-
companionship.
12
  For the full list of workers also excluded from overtime mandates, see US Department of Labor, elaws Advisors,
“Fair Labor Standards Act Advisor,” n.d.,
https://webapps.dol.gov/elaws/whd/flsa/screen75.asp#:~:text=Executive%2C%20administrative%2C%20profes
sional%20and%20outside,overtime%20provisions%20of%20the%20FLSA.
13
  The fight for $15 started in 2012 in New York City and spread from there. See “About Us,” The Fight for $15,
visited March 8, 2022, https://fightfor15.org/about-us/.
14
  “Income Inequality in the United States,” fact sheet, Inequality.org, visited January 18, 2022,
https://inequality.org/facts/income-inequality/.
15
     Ibid.
16
  Ben Zipperer, “The Minimum Wage Has Lost 21% of Its Value Since Congress Last Raised the Wage,” Working
Economics Blog, Economic Policy Institute, July 22, 2021, https://www.epi.org/blog/the-minimum-wage-has-
lost-21-of-its-value-since-congress-last-raised-the-wage/.

26                                                        The crisis of low wages in the US | Oxfam America
17
For the impact of supply chains on foodstuff price increases, see US Chamber of Commerce, “4 Factors Driving
Food Price Inflation,” November 10, 2021, https://www.uschamber.com/economy/4-factors-driving-food-price-
inflation.
18
For example, the Supplemental Nutrition Assistance Program (SNAP) is a federal program designed to help low-
income families pay for food, yet on average offers only $1.40 per person per meal, doing little to systemically
combat food insecurity and hunger. For more, see “A Quick Guide to SNAP Eligibility and Benefits,” Center on
Budget and Policy Priorities, January 6, 2022, https://www.cbpp.org/research/food-assistance/a-quick-guide-
to-snap-eligibility-and-benefits.
19
Holly Sklar and Alissa Barron-Menza, “Raising the Minimum Wage to $15 Helps Small Businesses,” Business for a
Fair Minimum Wage, February 24, 2021,
https://www.businessforafairminimumwage.org/sites/default/files/BFMW%20Raising%20Min%20Wage%20Helps
%20Small%20Business%20Feb%2024%202021.pdf.
20
Morgan Harwood, Jasmine Tucker, and Julie Vogtman, “One Fair Wage: Women Fare Better in States with Equal
Treatment for Tipped Workers,” fact sheet, National Women’s Law Center, February 2021, https://nwlc.org/wp-
content/uploads/2021/02/OFW-Factsheet-2021-v2.pdf.
21
Because Oxfam sourced data from the American Community Survey (ACS) and Current Population Survey (CPS),
the racial markers used in our data reflect census racial markers. For gender, respondents to the survey self-
identify their sex as either male or female. And for race/ethnicity, respondents can choose between “Asian
American or Other Pacific Islander,” “Black or African American,” “American Indian or Alaskan Native,” and
“Hispanic, Latino, or Spanish origin” of any race. Whiteness is typically measured by those who check “white” in
the racial box and “not of Hispanic, Latino, or Spanish origin” in the ethnicity box. This data is also a reflection of
what people self-report as their income, their age, and their familial status.
22
Oxfam America, Best and Worst States to Work in America 2021 (2021),
https://www.oxfamamerica.org/explore/countries/united-states/poverty-in-the-us/map-best-states-to-work-
2021/.
23
US Department of Labor, Office of Federal Contract Compliance Programs, “Earnings Disparities by Race and
Ethnicity,” n.d., https://www.dol.gov/agencies/ofccp/about/data/earnings/race-and-ethnicity.
24
Ibid.
25
Neil Bhutta et al., “Disparities in Wealth by Race and Ethnicity in the 2019 Survey of Consumer Finances,” FEDS
Notes, Board of Governors of the Federal Reserve System, September 28, 2020,
https://www.federalreserve.gov/econres/notes/feds-notes/disparities-in-wealth-by-race-and-ethnicity-in-the-
2019-survey-of-consumer-finances-20200928.htm.
26
Liz Mineo, “Racial Wealth Gap May Be a Key to Other Inequities,” Harvard Gazette, June 3, 2021,
https://news.harvard.edu/gazette/story/2021/06/racial-wealth-gap-may-be-a-key-to-other-inequities/.
Jasmine Tucker and Kayla Patrick, Low-Wage Jobs Are Women’s Jobs: The Overrepresentation of Women in Low-
27
Wage Work (National Women’s Law Center, 2017), https://nwlc.org/wp-content/uploads/2017/08/Low-Wage-
Jobs-are-Womens-Jobs.pdf.
28
Elise Gould, “Child Care Workers Aren’t Paid Enough to Make Ends Meet,” Issue Brief 405, Economic Policy
Institute, November 5, 2015, https://www.epi.org/publication/child-care-workers-arent-paid-enough-to-make-
ends-meet/.
29
Caitlin McLean et al., Early Childhood Workforce Index—2020 (University of California, Berkeley, Center for the
Study of Child Care Employment, 2021), https://cscce.berkeley.edu/workforce-index-2020/introduction-policy-
recommendations/key-findings/.
30
Ibid. Childcare workers are paid less than many other low-wage professions, including janitorial work (see US
Bureau of Labor Statistics, Division of Occupational Employment and Wage Statistics, “37-2011 Janitors and
Cleaners, Except Maids and Housekeeping Cleaners,” Occupational Employment and Wages, May 2020,
https://www.bls.gov/oes/current/oes372011.htm) and restaurant workers (see US Bureau of Labor Statistics,
Division of Occupational Employment and Wage Statistics, “35-2014 Cooks, Restaurant,” Occupational Employment
and Wages, May 2020, https://www.bls.gov/oes/current/oes352014.htm).
The crisis of low wages in the US | Oxfam America 2731
National Partnership for Women & Families, “Quantifying America’s Gender Wage Gap by Race/Ethnicity,” fact
sheet, January 2022, https://www.nationalpartnership.org/our-work/resources/economic-justice/fair-
pay/quantifying-americas-gender-wage-gap.pdf.
32
Kimberlé Crenshaw, “Demarginalizing the Intersection of Race and Sex: A Black Feminist Critique of
Antidiscrimination Doctrine, Feminist Theory and Antiracist Politics,” University of Chicago Legal Forum, 1989, no.
1, Article 8,
https://chicagounbound.uchicago.edu/cgi/viewcontent.cgi?referer=&httpsredir=1&article=1052&context=uclf.
33
See National Women’s Law Center, “One Fair Wage: Women Fare Better in States with Equal Treatment for Tipped
Workers,” fact sheet, February 2021, https://nwlc.org/wp-content/uploads/2021/02/OFW-Factsheet-2021-
v2.pdf.
34
“Consumer Price Index—January 2022,” news release, Bureau of Labor Statistics, Department of Labor,
https://www.bls.gov/news.release/pdf/cpi.pdf.
35
Diane Whitmore Schanzenbach et al., Where Does All the Money Go: Shifts in Household Spending Over the Past
30 Years (Hamilton Project and Brookings, June 2016),
https://www.hamiltonproject.org/papers/where_does_all_the_money_go_shifts_in_household_spending_over_t
he_past_30_y.
36
Though the Centers for Disease Control and Prevention (CDC) gave suggestions for who should be considered
“essential workers” at the start of the COVID-19 pandemic at the federal level, states were allowed to create their
own definitions. For a list of which workers were considered “essential” at the state level, see “COVID-19:
Essential Workers in the States,” National Conference of State Legislatures, January 11, 2021,
https://www.ncsl.org/research/labor-and-employment/covid-19-essential-workers-in-the-states.aspx. For a list
of “essential workers” per the CDC, see “Interim List of Categories of Essential Workers Mapped to Standardized
Industry Codes and Titles,” CDC, March 29, 2021, https://www.cdc.gov/vaccines/covid-19/categories-essential-
workers.html#:~:text=This%20interim%20list%20identifies%20%E2%80%9Cessential,the%20United%20States%2
0(U.S.).
Molly Kinder, Laura Stateler, and Julia Du, The COVID-19 Hazard Continues, but the Hazard Pay Does Not: Why
37
America’s Essential Workers Need a Raise (Brookings, October 2020), https://www.brookings.edu/research/the-
covid-19-hazard-continues-but-the-hazard-pay-does-not-why-americas-frontline-workers-need-a-raise/.
38
Molly Kinder and Laura Stateler, “Essential Workers Comprise About Half of All Workers in Low-Paid Occupations.
They Deserve a Living Wage,” The Avenue (blog), Brookings, February 5, 2021,
https://www.brookings.edu/blog/the-avenue/2021/02/05/essential-workers-deserve-minimum-wage-
increase/#:~:text=Using%20our%20colleagues%20Adie%20Tomer,less%20than%20%2415%20an%20hour.
39
Lawrence Mishel and Jori Kandra, CEO Compensation Surged 14% in 2019 to $21.3 Million: CEOs Now Earn 320
Times as Much as a Typical Worker (Economic Policy Institute, August 18, 2020),
https://www.epi.org/publication/ceo-compensation-surged-14-in-2019-to-21-3-million-ceos-now-earn-320-
times-as-much-as-a-typical-worker/.
40
David Gelles, “CEO Pay Remains Stratospheric, Even at Companies Battered by Pandemic,” New York Times, April
24, 2021, https://www.nytimes.com/2021/04/24/business/ceos-pandemic-compensation.html.
41
“Ultra-Millionaire (2 Cent) Tax,” toolkit, www.ElizabethWarren.com, updated December 2, 2019,
https://2020.elizabethwarren.com/toolkit/umt.
42
National Employment Law Project (NELP), “Fight for $15 Movement Has Won $150B in Wage Raises for 26M
Workers in Less Than a Decade,” news release, July 27, 2021, https://www.nelp.org/news-releases/fight-for-15-
movement-has-won-150b-in-wage-raises-for-26m-workers-in-less-than-a-
decade/#:~:text=Along%20with%20the%20campaign%20to,help%20secure%20all%20of%20these.
43
Global Living Wage Coalition, “What Is a Living Wage?,” n.d., https://www.globallivingwage.org/about/what-is-
a-living-wage/.
44
See Living Wage for US, n.d., https://www.livingwageforus.org.
45
For more on state wage preemption, see Economic Policy Institute, “Workers’ Rights Preemption in the US: A Map
of the Campaign to Suppress Workers' Rights in the States,” https://www.epi.org/preemption-map/, updated
August 2019. Wage preemption policies are also tracked in Oxfam’s Best States to Work Index; see Oxfam America,
28 The crisis of low wages in the US | Oxfam AmericaYou can also read