The Art of Counting: How to Estimate Flock Sizes - Central ...
←
→
Page content transcription
If your browser does not render page correctly, please read the page content below
The Art of Counting: How to Estimate Flock Sizes

John Fulton, 927 Olivewood Drive, Los Banos, CA 93635.
         Merced_birding@hotmail.com
George Kajrys, PhD, 697 Mockingbird Lane, Merced, CA 95340.
        gkajrys@comcast.net

     Several distinctly different methods are available to count birds in flocks.
Some methods are great for small groups but not practical for large groups.
Often it is only possible to count a sample (a small segment) of a population.
Statisticians apply removal curves or use capture-recapture methods for mist-
netting and banding studies to monitor population size and changes over
time. Those methods are beyond what we discuss here. Rather, here we
describe some of the many various simple techniques that can be used for
counting birds in the field. The first step beyond counting is visualization (i.e.,
identifying groups and counting by groups; Arbib 1972). We then just touch
on how some of these techniques can be combined and expanded. For a more
in-depth discussion of how to count large flocks, see the Wildlife Techniques
Manual sections on population studies (The Wildlife Society 2005) or view the
links on the eBird homepage to “Bird Counting 101,” and “Bird Counting 201.”
     We begin with methods for simple situations, starting with small flocks on
the ground. Then we discuss increasingly more complicated situations up to
large groups of intermingling flights of undulating swirling birds at various
distances and of various densities.
SIMPLE TECHNIQUES
Direct Counting
     Most people use simple direct counts as their primary method for
counting birds in small flocks. Birds are counted one at a time and the total
recorded. Each additional group of birds in turn is counted the same way with
the subtotals then totaled as a grand total.
Visualizations of and Counting by Small Uniform Increments
     Larger flocks of birds are often too large or moving too quickly to count as
singles. Instead they need to be counted as groups. Counting by groups of
two, for example, is twice as fast as counting one-by-one. Larger groups can
be quantified by counting by groups of 5s, or of 10s, or some other number
with which the person is comfortable visualizing and counting. With group
counting, the size of the group will also be the order of magnitude used to
determine the last significant digit. if you are counting by tens then the last

16                                              Central Valley Birds, Spring 2019
digit of the estimated flock size will be a non-significant zero as a place holder
(see Kajrys and Fulton [2019]). If counting by hundreds, then the final two
digits will be zeros, as place-holding non-significant digits.
INTERMEDIATE TECHNIQUES
Progressive Visualizations
With just a little practice, most people can get very good at visualizing
groups of 10 to 25 birds at a time. With more practice, most people can
become consistent identifying groups of up to 50 objects. Some people have
the ability to visualize groups of 50 to 100 objects at a time with excellent
precision and accuracy. (Precision means getting the same number
repeatedly, whether accurate or not, whereas accuracy means getting a
number or average number close to the actual number (Kajrys and Fulton
2019).
In the movie Rainman, Dustin Hoffman played an autistic genius who
could count things by recognizing the visual or site image even if there were
hundreds of items. For us mere mortals, especially if you are a beginner, start
by counting out five birds from a group and capture in your mind what that
looks like. Then proceed to count by fives or the number of groups of five.
This is the first visualization step before we can progress on to the next step.
This first step is important; it allows us to recalibrate during each count period
for the species, the weather, or the distance from the counted flock.
ADVANCED TECHNIQUES
Calibrated Progressive Visualizations
Calibrated progressive visualization is the process of repeating the
described progressive visualization techniques with recalibrations between
each counting sequence. For example, each sequence of counting ten groups
is followed by a re-calibration step that changes the visual image being used
to a new image that is ten times larger. By continuingly alternating the
recalibration step with a counting of ten groups, each sequence adds an order
of magnitude to the group that is counted (i.e., from 10s to 100s to 1000s). To
practice this for larger numbers, persons who conduct aerial surveys scatter
rice grains on the table and try to guess the number, then actually physically
count each grain to check their guess (Arbib 1972). They repeat these tosses
of random numbers of grains until they can consistently estimate numbers
that are within 2-3% for groups of up to 100 rice grains. This is great practice
for counting birds directly overhead that are all the same distance from the
observer, similar to the rice grains lying on that flat 2-dimensionsal table-top
surface.
Volume 22, Number 1-2 17Progressive visualizations can help in counting very large flocks. Birds may
not be in easy-to-count groups of 10 units, so it is often necessary to modify
this process to count by 25s or 50s or some other multiple that works for the
specific condition (e.g., flock size, flight speed). (See Figure 1 for use of the
multiple of three.) In many cases, flocks will vary in density, so you have to re-
calibrate your visualizations by re-calibrating to compensate for changes in
density or distance and then continue counting the next group following the
progressive visualization process.
Figure 1. How many geese? Noting patterns in a flock makes it easier to count.
Here, the birds are in lines of 3 and groups are also in patterns of 3, so the flock
can be counted by multiplying by 3 for each successive visualization, so the entire
flock size is 3 x 3 x 3 x 3 x 3 = 243 geese. (Image courtesy of Rory Fulton).
Compensating for the Undercount Bias in Large Flocks
Huge flocks are commonly undercounted. The birds that are furthest
away tend to get undercounted due to the geometry involved. Experience has
shown that most people tend to undercount large flocks in flight and that the
amount of undercounting increases as the flock size increases. In our
experience, a difficulty in counting large flocks is that people tend to see the
surface of the flock in two dimensions and disregard the fact that the
increasing size of the cross-sectional area is not a linear function, but rather
that objects half as far away are four times larger. A single bird can hide nine
birds that are three times as far away. Birds that are further away are not as
easily seen, or they appear smaller with distance, and thus they may not be as
likely to be included in the count as those in the closest part of the flock;
those furthest away often do not get counted at all.
One strategy to adjust for the undercounting bias is to do the progressive
visualization from front to back before going from side to side. In this way you
will get a count for a visual image that is a cone of view from the nearest to
the most distant bird. Then in the next step, go from top to bottom, bottom to
18 Central Valley Birds, Spring 2019top, or from side to side. Then when you go from side to side you will have
reduced or even eliminated the factor of distance bias leading to
undercounting. This bias correction technique is a simple example of the
advanced three-dimensional application of progressive visualization.
Summary of Advanced 3-D Progressive Visualization
In counting large flocks that occupy three dimensions, start the same way
as in counting by small incremental groups of 5 to 25 birds and then visually
key in on what that looks like; then count by 5s or 25s, from the front of the
flock or the edge nearest to you, and then to the most distant birds until you
now have a visual 3-D image of the number of birds behind that original
image of 5 or 25 birds; that cone of view behind that 5 or 25 birds is your new
visual image for that new number of birds. With that new image—the number
of birds in the cone of view behind those first 5 (or 25) birds—you are shifting
your visualization from that first 2-D clump to the new 3-D clump size.
Counting now by that new clump size, you can get to what the size of a clump
of 100 birds looks like, or whatever the number is that you are visualizing.
Counting by 100 birds at a time, then you can count to 1000 and re-visualize
what a cone of 1000 birds looks like, and so on. If you reach the middle of the
flock, then you just double that number to reach the total number of birds in
the entire flock.
If the flock density is non-uniform, you will have to recalibrate your
progression for each change in density, and then add the subtotals to get the
overall total. With flocks in the range of millions of birds, the process of
progressively larger visualizations can continue from 100s, to 1000s, to
10,000s, and so on; such large flocks may require re-calibration of your visual
image every minute or so, for an hour or more. To do this well takes some
practice; the result can be annotated with a notation of +/-, and your level of
precision, or notated in terms of significant figures and exponents to show
how confident you are with the precision of the count (i.e., did you count by
10s or 10,000s?).
ADVANCED TECHNIQUES USING MATH CALCULATIONS
Area, density, and time can be helpful when trying to calculate bird
numbers. If there are multiple people working together, then each person
should know the portion of the area for which they are responsible.
Aerial Counts
Waterfowl or seabird flocks on the water viewed from aircraft, drones, or
from aerial photos are often counted by sampling. One can multiply the
number of birds in a small sample area (e.g., 0.1 acre or one acre) by the total
amount of area covered by the flock. This method works best when the birds
are spaced uniformly, but it can work by subdividing the flock or by taking
Volume 22, Number 1-2 19several samples to get an average density and then multiplying the average
by the area occupied by the entire flock. The height of the aircraft determines
how well you can identify the birds to species, and also how far you can see in
order to count the number of birds off to the sides of the aircraft, but there
can be trade-offs. At greater heights, an observer can see further to the side
to survey a larger area, but it is more difficult to identify species.
Many bird species cluster together while also maintaining interpersonal
space. The resulting pattern of uniform spacing on a 2-D surface, can be used
to count how many birds are in a straight-line transect through the field.
Counting how many of these transect widths the flock occupied and
multiplying numbers on a transect can provide a very accurate estimate of the
flock’s size. Geese lined up on flooded row crops, as well as nesting terns,
gulls, and other colonial nesters, can be counted this way very quickly and
accurately.
EXAMPLES OF APPLIED TECHNIQUES
Large Numbers in Two Dimensions
Most animals are territorial. Even colonial species maintain an
interpersonal space in their nest areas of a few multiples of their wing chord
length or bills. Often this uniform spacing can help to establish a very accurate
count. For example, at Merced National Wildlife Refuge (NWR), J. Fulton
observed Snow Geese (Chen caerulescens) and Ross’ Geese (C. rossii) lined up
on corrugated marsh land (i.e., a land-leveled wetland plowed and then
flooded so that the furrows flood between the dry ridges). The geese always
loaf on the ridges with their tails downwind and body facing into the wind.
There were 200 birds (+/- 5 birds) on each corrugation and there were 200
corrugations, so the number of birds was 40,000 (+/- 2%). The species
composition was 75% Ross’ so there were 30,000 Ross’ and 10,000 Snow
Geese in the field. There were probably an additional 40,000 other geese on
Merced NWR at that same time scattered over several fields, for a total of
80,000 geese on the Merced NWR that day, a typical count in January and
early February.
After you have mastered the art of counting geese on the water or
standing in ranks and files on corrugations, you will be able to estimate flocks
in two dimensions. Geese will be one layer of birds spread over the water.
Counts in Three Dimensions
Counts can also incorporate time as a third dimension. One bird count
that J. Fulton conducted considered nesting pairs over the nesting season.
Over the season the number of nests at any one time was less than 15, but
the nest locations moved over time as nestlings fledged and new nests were
initiated. In such cases, an accurate count requires tracking of each nest and
20 Central Valley Birds, Spring 2019nest location over the full nesting season. See White et al. (1988) and Fulton
(2019) for an example of such a count of Green Heron nests.
Tricolored Blackbirds often nest in emergent marsh vegetation, a three-
dimensional habitat. To avoid disturbing this state-threatened species, after
fledging and departure of young, researchers characterize the average density
of nests (as nests/m2) by sampling the colony site. They then multiply that
density by the area of the colony, as mapped in the field and measured in the
office from aerial photos or Google Earth (www.google.com/earth/). This
technique provides an estimate of the number of nesting pairs without
disturbing the birds.
In both the two-dimensional and the three-dimensional cases, the
population is found by multiplying the density of the birds by the area of
habitat occupied by the flock.
Counting flocks in the air, thus in three dimensions, can be a special
challenge. The movement of flying flocks also adds a fourth dimension: time.
We will address it only in the 3-D sense. The tendency was noted above, to
undercount the part of the flock that is more distant.
A unique challenge when counting birds in flight is that the flock may be
swirling and folding back upon itself. For example, European Starlings (Sturnus
vulgaris) going to a roost will swirl and weave in large clouds of multi-
directional feathered fury (Google murmurations for many video examples).
Counting such a tumult may seem impossible. The goal is to get the best
possible estimate. We suggest adding a footnote about your level of
confidence in such estimates.
Counting 10,000 geese or cranes in flight in long lines or Vs is simpler
than counting swirling clouds of starlings. There is less change over time in the
shape of the flock. Both geese and starlings can be estimated the same way
but may have different margins of uncertainty, with estimates for geese being
reasonable to within 5% but the starling estimates may be off by 20 to 30%, or
even an order of magnitude.
Large Roost Counts
It seems that every roost count has different issues and multiple possible
ways to accomplish the count. Weather conditions, terrain, and personnel all
may dictate the methods chosen. Counts of blackbird, wader, and swallow
roosts often involve huge numbers of birds arriving at one spot from multiple
directions simultaneously.
Several techniques can be employed to increase accuracy of large roost
counts. Strategically stationing people in different areas or assigning different
count areas can be beneficial. Dividing the sky with defined landmarks (power
poles, street intersections, railroad lines, river banks) so that each counter is
Volume 22, Number 1-2 21assigned only one well-defined flight path of approaching birds is often a good
first step. Provide each counter with a support team that includes a recorder
and a timer. As the birds fly past the landmarks over the specified territory of
each team, the timers can record the duration (time) of sample counts, along
with when they begin, and when they end and then calculate the duration of
time between the sample intervals. The recorder can write down the numbers
of birds seen in the count area for each timed interval. A new interval should
be started when the rate of bird passage changes. There may be long periods
of stable numbers of birds per unit of time; in this case taking a sample count
for 10 seconds every minute or two may suffice. Birds flying out, in the
opposite direction should be subtracted from the count to prevent them
being counted each time they circle back.
After the last bird has passed, then the multiplication begins; for each
interval the number of birds per second can be multiplied by the time interval
and the overall total can be calculated. USFWS biologists Dwight Cooley and J.
Fulton used this method to estimate 1.2 million blackbirds at a roost at Mobile
Bay, Alabama, in the late 1980s. The flight-lines were divided, and each
observer used visualizations of hundreds of birds during the evening flight of
mixed blackbirds and grackles; we timed intervals and took visual image
samples of birds per second every minute or so; the species proportions were
confirmed by returning to get additional species-specific proportional
sampling observations the next day.
Counting large erratic flocks at roosts. Counting large flocks in flight is
difficult when the flock varies in density and the flight direction is erratic. The
best method is to get a count as the birds arrive, before they begin their
swirling flight behaviors just prior to going to the roost. Make your best
estimate and return the next night with help and be sure to arrive a bit earlier
to confirm the count as the birds approach, before they gather in swirling
chaos.
Combining Techniques. Limited personnel or unfavorable weather
conditions may require that you creatively combine other techniques with
visualizations, especially if the flock size is too large for one observer to see
from one location. With multiple observers, each person can be assigned a
task, a species (if it is a mixed roost), a timed shift (as at an all-day raptor
watch), or a defined area of the sky.
If the flight is wide and you are the only observer, you have to decide
which techniques to combine. If there is one flight line and you are off
towards one edge you are lucky; there is only one flock to count. If birds are
arriving in a band that stretches to both sides of your location, then you may
have to count alternate segments, essentially performing as would multiple
observers. You make running tallies for the left side separately from the right
22 Central Valley Birds, Spring 2019side of your position, multiply each by the rates of arrival, and then total the
separate estimates. Similarly, birds that arrive in multiple separate flight lines
can be tallied as subtotals as if you are multiple people who are each assigned
one flight line that can then be added together. For some blackbird roosts,
the time duration for the flock to arrive may be over an hour and there may
be many teams of observers counting; each team may be assigned to count
only those birds flying over that are between two power poles or other
landmarks. In such cases, care must be taken to avoid double-counting flocks
that cross between multiple count segments.
An example of this method, along with an excellent explanation of how it
was employed was posted on eBird 28 May 2018 (https://ebird.org/view/
checklist/s4611116491. Fulton [2019]). Over 700,000 warblers were counted
in one day in one small area of Tadoussac, Quebec. Although the example was
a migration wave rather than a roosting flock, the same techniques were
employed.
SUMMARY
There are many ways to count flocks. Simple counts are appropriate for
small flocks. Estimations can be made by visualizations, or progressive
visualizations, and counts by groups. Transects, spot samples, and density can
be used with an area grid. The choice of techniques depends upon the time
and resources available, the specific conditions, and the purpose for data
collection (and thus accuracy and precision needed). Having multiple
observers is usually helpful but each observer needs to be aware of where to
count and how to determine which birds are being counted by someone else
to minimize double counting. At times, use of several techniques together are
most effective. When the numbers are extremely high, try to replicate the
count using a more intensive approach to confirm or correct the count.
Sometimes, however, the best we can hope for is to get an estimate within
one order of magnitude of the true population.
LITERATURE CITED
Arbib, R.S. 1972. On the art of estimating numbers. American Birds 26:706-
712.
Fulton, J. 2019. Numbers Count: Personal examples when Counts mattered.
Central Valley Birds 22: 38-43.
Kajrys, G. and J. Fulton. 2019. Scientific measurements: Better Counts,
Measurements, Science, and Decisions. Central Valley Birds 22:25-31.
Sullivan, B.L., C.L. Wood, M.J. Iliff, R.E. Bonney, D. Fink, and S. Kelling. 2009.
eBird: a citizen-based bird observation network in the biological sciences.
Biological Conservation 142: 2282-2292.
Volume 22, Number 1-2 23The Wildlife Society. 2005. Estimating the number of animals in wildlife
populations. Pp 106-153 in Techniques for Wildlife Investigations and
Management. The Wildlife Society. Patuxent Wildlife Research Center,
Bethesda, Maryland.
White, D.H., W.J. Fleming, and K.L. Ensor, 1988. Pesticide contamination and
hatching success in waterbirds In Mississippi. Journal of Wildlife Management
52:724-729.
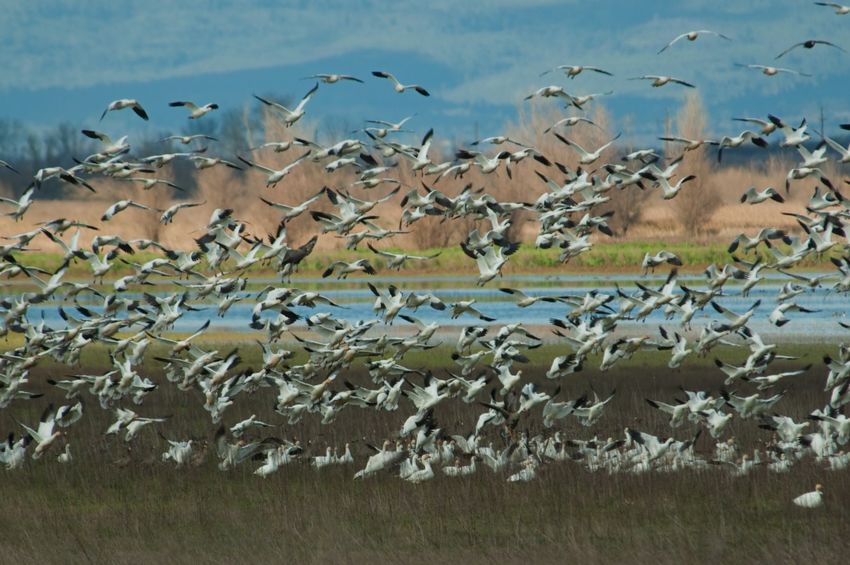
A flock of Snow/Ross’s Geese. 21 February 2010. Llano Seco NWR,
Butte Co. California. Photo © Susie Nishio
24 Central Valley Birds, Spring 2019You can also read