The analysis of the geographical distribution of emergency departments' frequent users: a tool to prioritize public health policies?
←
→
Page content transcription
If your browser does not render page correctly, please read the page content below
Hellmann et al. BMC Public Health    (2021) 21:1689
https://doi.org/10.1186/s12889-021-11682-z

 RESEARCH ARTICLE                                                                                                                                   Open Access

The analysis of the geographical
distribution of emergency departments’
frequent users: a tool to prioritize public
health policies?
Romain Hellmann1,2, Anne-Laure Feral-Pierssens3,4,5*, Alain Michault1,6, Enrique Casalino2,7, Agnès Ricard-Hibon8,
Frederic Adnet3, Dominique Brun-Ney9, Donia Bouzid2,7, Axelle Menu1 and Mathias Wargon10,11

  Abstract
  Background: The individual factors associated to Frequent Users (FUs) in Emergency Departments are well known.
  However, the characteristics of their geographical distribution and how territorial specificities are associated and
  intertwined with ED use are limited. Investigating healthcare use and territorial factors would help targeting local
  health policies. We aim at describing the geographical distribution of ED’s FUs within the Paris region.
  Methods: We performed a retrospective analysis of all ED visits in the Paris region in 2015. Data were collected
  from the universal health insurance’s claims database. Frequent Users (FUs) were defined as having visited ≥3 times
  any ED of the region over the period. We assessed the FUs rate in each geographical unit (GU) and assessed
  correlations between FUs rate and socio-demographics and economic characteristics of GUs. We also performed a
  multidimensional analysis and a principal component analysis to identify a typology of territories to describe and
  target the FUs phenomenon.
  Results: FUs accounted for 278,687 (11.7%) of the 2,382,802 patients who visited the ED, living in 232 GUs. In the
  region, median FUs rate in each GU was 11.0% [interquartile range: 9.5–12.5]. High FUs rate was correlated to the
  territorial markers of social deprivation. Three different categories of GU were identified with different profiles of
  healthcare providers densities.
  Conclusion: FUs rate varies between territories and is correlated to territorial markers of social deprivation. Targeted
  public policies should focus on disadvantaged territories.
  Keywords: Healthcare use, Frequent users, Access to care, Health geography, Emergency department

* Correspondence: feralal@gmail.com
3
 SAMU 93 - Emergency Department, Avicenne hospital, Assistance
Publique-Hôpitaux de Paris, Bobigny, France
4
 University Sorbonne Paris Nord, Health Education and Practices Laboratory
(LEPS EA3412), Bobigny, France
Full list of author information is available at the end of the article

                                        © The Author(s). 2021 Open Access This article is licensed under a Creative Commons Attribution 4.0 International License,
                                        which permits use, sharing, adaptation, distribution and reproduction in any medium or format, as long as you give
                                        appropriate credit to the original author(s) and the source, provide a link to the Creative Commons licence, and indicate if
                                        changes were made. The images or other third party material in this article are included in the article's Creative Commons
                                        licence, unless indicated otherwise in a credit line to the material. If material is not included in the article's Creative Commons
                                        licence and your intended use is not permitted by statutory regulation or exceeds the permitted use, you will need to obtain
                                        permission directly from the copyright holder. To view a copy of this licence, visit http://creativecommons.org/licenses/by/4.0/.
                                        The Creative Commons Public Domain Dedication waiver (http://creativecommons.org/publicdomain/zero/1.0/) applies to the
                                        data made available in this article, unless otherwise stated in a credit line to the data.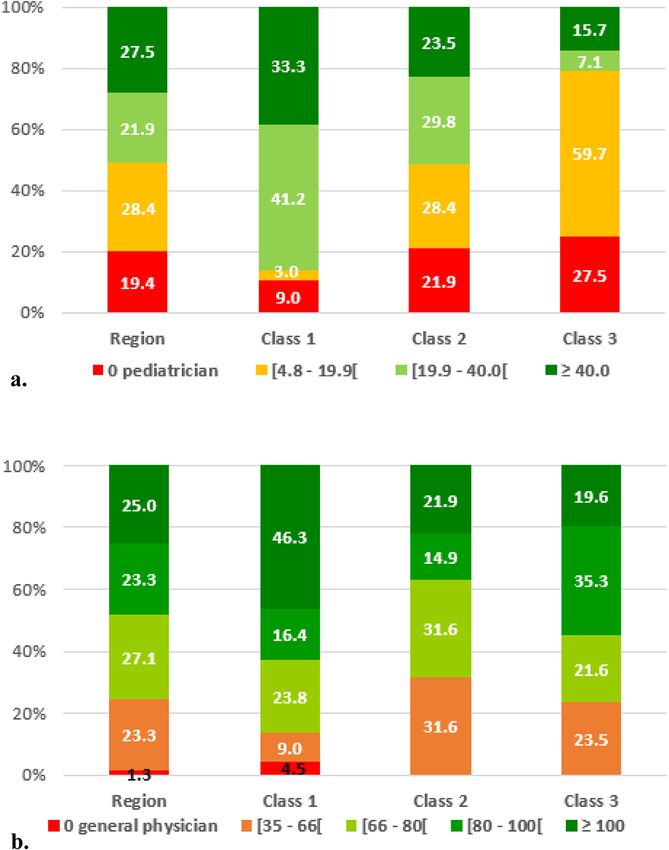
Hellmann et al. BMC Public Health   (2021) 21:1689                                                               Page 2 of 12

Background                                                     universal health coverage (CMU-C) is a public comple-
As most developed countries, France faces a regular and        mentary health insurance for the poorest part of the
sharp increase of emergency departments (EDs) visits. In       French population (8%). Foreigners without any legal
2016, the 723 French EDs received nearly 21.2 million          status can benefit from a specific public health insurance
visits (+ 15% in 4 years) which account for €3.1 billion       plan (Aide Médical d’Etat - AME).
visits, mainly handled by universal health insurance sys-        This SNDS administrative database includes all out-
tem [1]. Improving health care access to unscheduled           patient visits (in private practice or healthcare facilities),
care facilities has become a national priority [2]. For sev-   inpatient admissions, medical procedures, medications,
eral years, public policies have focus on the extension of     imaging, that are partially or fully covered under the uni-
general practitioner’s (GPs) visiting hours (on week           versal health insurance fund. It contains also patient’s
nights and week-ends) or the development of alterna-           characteristics such as age, sex and municipality of resi-
tives for unplanned emergency care while the number of         dence. Patients presenting with one of 30 specific
EDs has decreased over the same period [3]. Few inter-         chronic long-term conditions (among which diabetes,
ventions have targeted specific populations by promoting       coronary artery disease, heart or lung failure, psychiatric
alternatives for unplanned care and health care pathways       conditions, cancer, severe stroke, HIV, tuberculosis) are
different than those involving ED visits. For example,         supported by a specific comprehensive coverage system
frequent emergency users (FUs) have been described             for all related care. Each patient affected by one of these
and successfully targeted in other health care systems         diseases needs physician certificates and administrative
[4–9]. FUs have not been investigated in France yet.           approval to benefit from this system. There are no com-
   The Ile-de-France Health Regional Agency, the admin-        plementary or out-of-pocket fees associated to these spe-
istrative institution that runs public health policies and     cific conditions. Administrative data concerning these
the regulation of health services in the Paris metropol-       conditions are also reported (Affection Longue Durée –
itan area (with the highest density of population: 12.1        ALD).
million inhabitants), decided to set up a specific public        We included all patients who visited at least once any
health strategy aiming at improving adequate health care       ED of the Ile-de-France region (IdF) between January 1st
access for FUs. Identifying the territories associated to      to December 31st, 2015. We excluded all visits for ob-
higher FUs rates and thus, the most eligible to these spe-     stetric emergencies and childbirths. The IdF area is a re-
cific interventions is an important first step. The main       gion composed of eight départements, including the city
aim of this work is to describe and characterize FUs in        of Paris. It has 87 general and 35 pediatric EDs.
this specific area. The secondary objective is to identify       The clinical severity of each ED visit was assessed ac-
the geographical distribution of FUs at residential terri-     cording to the following classification:
tory level.
                                                                  need of a medical consultation only (level 1);
Methods                                                           need of a technical procedure (biology test, imaging
Study setting and design                                            exam) (level 2)
We performed a retrospective study based on the Uni-              need of a specialist opinion but without hospital
versal Health Insurance’s claims database (Système na-              admission (level 3);
tional des données de santé-SNDS) [10].                           resulting in hospital admission (level 4).
  The Universal Health Insurance (UHI) fund covers
more than 90% of the French population. The French             Definitions
health care system consists of primary care (mainly pri-       There is no consensus in the literature on the definition
vate practice) and of hospital care (mainly public sector)     of FU which ranges from ≥2 to ≥20 visits per year [4].
and has a cost sharing policy. The UHI fund reimburses         For this study, the definition of FU was based on the
physician private practice on the basis of a national fee      natural break in the distribution of ED visits in the stud-
schedule with reimbursement rates ranging from 30 to           ied population which allowed us to identify a cutoff of
100% of the statutory tariff for each type of procedure.       ≥3 visits per patient per year in any ED. This definition
These tariffs are set by national agreements among phy-        is also the most common one reported in the literature.
sicians’ trade unions and the UHI fund. For emergency          Three subtypes of FUs were defined: low-FUs: [3–6]
department visits, tariffs and out-of-pocket payments are      visits/year; high FUs: [7–19] visits/year; and very high
the same in all types of healthcare facilities. Personal       FUs ≥ 20 visits/year [8].
health expenditure is mostly financed by UHI fund
(79%). The remaining is financed by public or private          Geographical units
complementary health insurance (14%) and out-of-               We assessed a territorial division of the IdF region which
pocket payments (7%) [11]. The complementary                   is divided in 8 administrative departments. We identified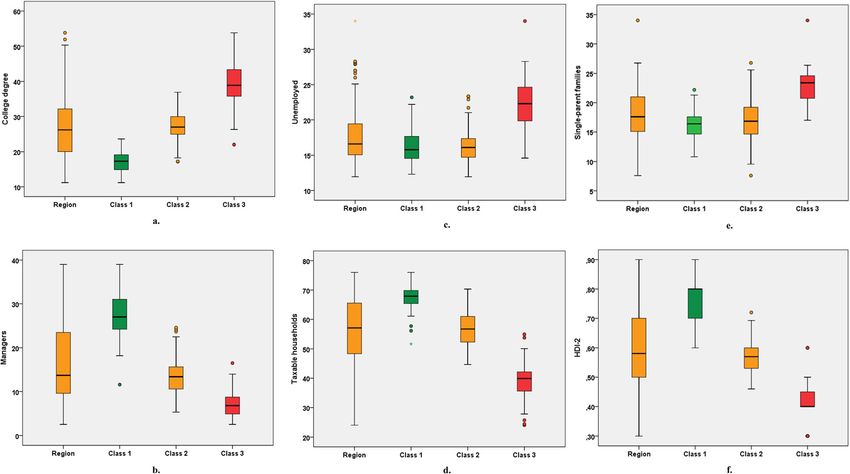
Hellmann et al. BMC Public Health         (2021) 21:1689                                                                     Page 3 of 12

232 geographical units (GUs). GUs were defined ac-                      characterize in terms of socio-demographics factors the
cording to the National Institute of Statistics and                     territories the most associated to high FUs rates. Our
Economic Studies (INSEE) methodology: For the de-                       secondary endpoint was to assess correlations between
partment of Paris, GUs correspond to districts (n =                     socio-demographics and economic characteristics of the
20); For the three departments closest to Paris, GUs                    geographic units and the FUs rate and to identify a typ-
correspond to municipalities (n = 123); For the four                    ology of territories.
peripheral and larger departments, GUs correspond to
either municipalities (n = 10) or townships (n = 79)                    Statistical analysis
according to the size of the population. INSEE has                      We defined the ED visiting rate by assessing the total
developed this geographical subdivision to make the                     number of ED visits per 1000 residents for each GU. All
statistical data of the smallest municipalities more re-                ED visits were recorded and accounted for even when
liable. To characterize each GU, we used thirty de-                     the visit took place in a different GU than the patient’s
scriptive variables of the demographic and socio-                       residential GU. Then, the FU’s rate was assessed based
economic status of its residential population: age dis-                 on the number of FUs residents in a GU reported to the
tribution, income level, jobs typology, education level,                population of all GU residents that had visited at least
family composition, densities of healthcare profes-                     once any ED in the IdF region.
sionals and the Human Development Index-2 (HDI2).                         We assessed correlations with the FU rate of 151
The HDI-2 is an index which takes into account the                      available demographic and socio-economic descriptive
three dimensions of the Human Development Index                         variables of all geographical units: age distribution, in-
(health, education, standard of living) adapted to the                  come level, jobs typology, education level, family com-
French situation and available for each GU [12, 13].                    position, densities of healthcare professionals and the
                                                                        HDI-2. Among these, we identified 30 descriptive var-
Endpoints                                                               iables that were correlated to FU’s rate. Fifteen active
The first objective of this study was to describe FUs in                interest variables were favored for principal compo-
the specific IdF area. Our first endpoint is the FUs rate               nent analysis (PCA) [14]. We moved from 15 vari-
in the IdF region and at residential territory level. The               ables to four main components while keeping more
secondary objectives of this study were to identify and                 than 92% of the information. We performed a second

Table 1 Demographic and medical characteristics of Emergency Department users and their visits in the Ile de France region in
2015 (IdF area)
Variables                                      IdF area     %      NFUs & FUs          %       FUs          %      NFUs              %
Population, n                                  12,055,277   100    2,382,802           100     278,687      100    2,104,115         100
Men, n                                         5,822,699    48.3   1,146,128           48.1    121,904      43.7   1,024,572         48.7
Median age, years                              36                  31                          30                  32
Chronic long-term condition a, n
  Diabetes                                     454,210      3.8    90,115              3.8     12,670       4.5    77,445            3.7
  Psychiatric disorder                         243,626      2.0    60,867              2.5     12,341       4.4    48,526            2.3
  Cancer                                       371,109      3.1    76,872              3.2     11,085       3.9    65,787            3.1
  Chronic heart feature                        152,938      1.3    42,056              1.8     6850         2.4    35,206            1.7
  Coronary artery disease                      178,234      1.5    42,588              1.8     6137         2.2    36,451            1.7
  Chronic respiratory failure                  99,224       0.8    27,431              1.1     5232         1.9    22,199            1.0
  Severe hypertension                          154,481      1.3    33,729              1.4     4946         1.8    28,783            1.4
  Dementia                                     59,091       0.5    19,929              0.8     3335         1.2    16,594            1.4
                                                                   NFUs & FUs Visits   %       FUs Visits   %      NFUs Visits       %
Visits, n                                                          3,718,209           100     1,144,837    100    2,573,372         100
Degree of severity, n
  Level 1 – medical consultation only                              790,627             21.3    219,210      19.1   571,417           22.2
  Level 2 – need for technical procedure                           1,518,493           40.8    540,393      47.2   978,100           38.0
  Level 3 – need for specialist opinion                            842,816             22.7    201,903      17.6   640,913           24.9
  Level 4 – hospital admission                                     566,273             15.2    183,331      16.0   382,942           14.9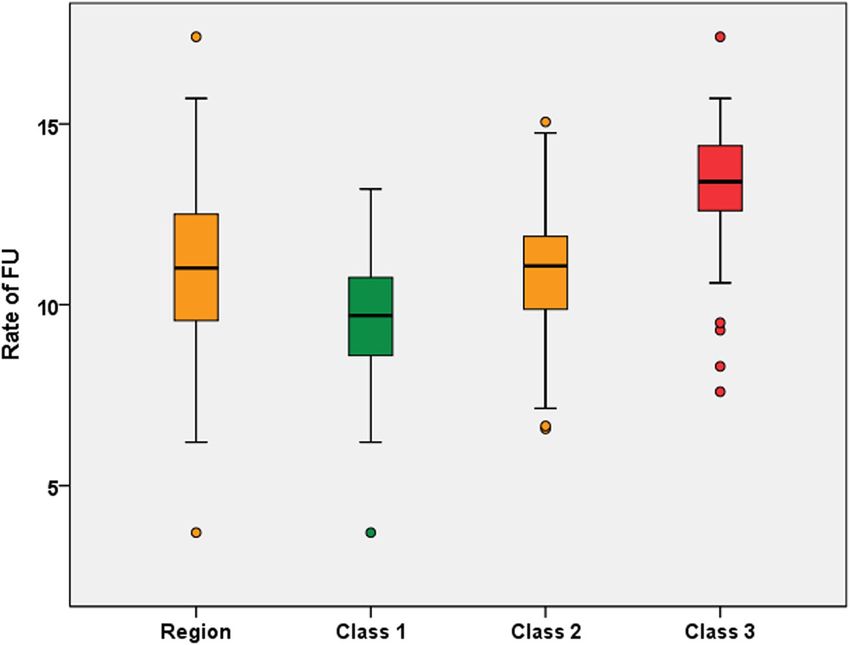
Hellmann et al. BMC Public Health (2021) 21:1689 Page 4 of 12
Table 2 Correlations between the rate of frequent users in their geographical units and their socioeconomic markers (Ile-de-France
region, 2015)
Variables Rules Correlation coefficients P-value
Population, Age
< 3 years (%) Active variable + 0.54 < 0.001
[3–15 [years (%) Active variable + 0.31 < 0.001
[15–35 [years (%) Illustrative variable + 0.26 < 0.001
[35–75 [years (%) Active variable −0.50 < 0.001
≥ 75 ans years (%) Active variable −0.38 < 0.001
Education level
College degree (%) Active variable −0.55 < 0.001
Professional degree (%) Active variable + 0.26 < 0.001
Bachelor degree (%) Illustrative variable + 0.07 0.284
High school degree (%) Active variable + 0.69 < 0.001
Occupational status
Farmers (%) Illustrative variable + 0.07 0.263
Employees (%) Active variable + 0.58 < 0.001
Manual laborers (%) Active variable + 0.61 < 0.001
Traders, Artisans (%) Illustrative variable −0.27 < 0.001
Middle managers (%) Illustrative variable −0.28
Managers (%) Active variable −0.50 < 0.001
Pensioners (%) Active variable + 0.39 < 0.001
Unemployed (%) Active variable + 0.46 < 0.001
Tax and income level (mean)
Taxable households (%) Active variable −0,74 < 0.001
Salaries and wages (€) Active variable −0,64 < 0.001
Pension and retirement (€) Active variable −0,69 < 0.001
Direct taxes (€] Illustrative variable −0,46 < 0.001
Developpment Index
HDI-2 Illustrative variable −0,67 < 0.001
Family composition
Single parents families (%) Illustrative variable + 0,58 < 0.001
Families without children (%) Illustrative variable −0.46 < 0.001
Families with one child (%) Illustrative variable + 0,27 < 0.001
Families with two children (%) Illustrative variable −0,15 < 0.023
Families with three children (%) Illustrative variable + 0,51 < 0.001
Families with at least three children (%) Illustrative variable + 0,55 < 0.001
Health care providers
General physicians densityb Illustrative variable −0.03 0.660
Pediatricians density c
Illustrative variable −0.24 < 0.000
a
HDI-2: Human Developpment Index 2. bDensity > 100 general physicians per 100,000 residents. cDensity > 40 pediatricians per 100,000 residents under the age
of 18
step analysis by using a hierarchical ascending classifi- Data management and statistical analyses were per-
cation from these four main components. This formed with Excel® software, Microsoft Office Profes-
method allowed the identification and differentiation sional Plus 2010 for Windows® version; SAS Enterprise
of three different classes of homogeneous GUs with Guide®, version 7.13 of SAS System for Windows®; and
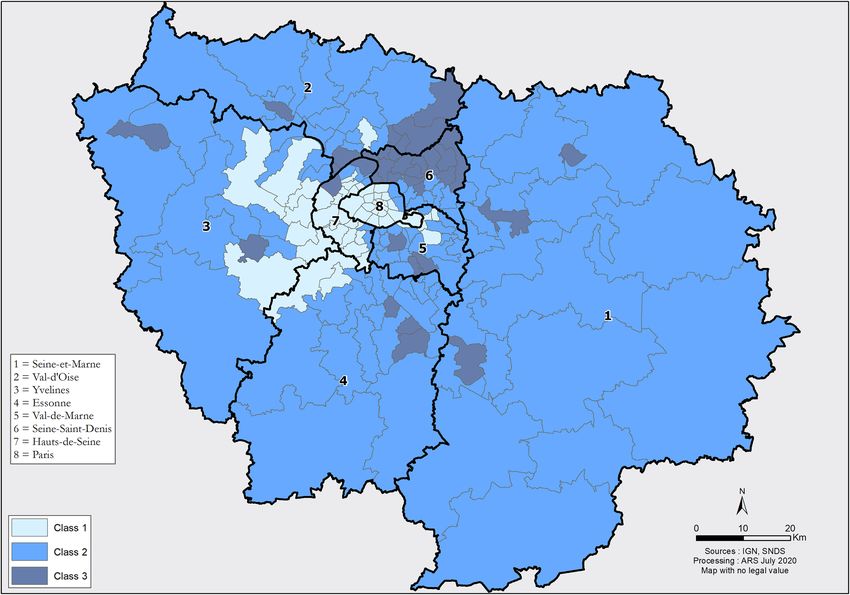
similar characteristics. IBM SPSS®, Statistics 20 version for Windows®.Hellmann et al. BMC Public Health (2021) 21:1689 Page 5 of 12 Fig. 1 Geographical distribution of the three classes of territories among the 8 departments of the Ile-de-France area, 2015 (own source). Class 1: Low Frequent Users rates; Class 2: Average Frequent Users rates; Class 3: Higher Frequent Users rates Fig. 2 Rate of frequent users in each class of geographical units (IdF area, 2015). Caption: For the class 1 geographical units, the median rate of FUs is 9.7% with an interquartile range from 8.6 to 10.8%.
Hellmann et al. BMC Public Health   (2021) 21:1689                                                                               Page 6 of 12

Authorization                                                 Table 3 Socio-economic characteristics among the residential
This study is based on public data extracted from the         population for each class of geographical units of the Ile-de-
SNDS. Access to the data was granted to the authors as        France region, 2015
authorized personnel of the IdF Health Regional Agency.       Characteristics      Minimum*         Q1       Median       Q3       Maximum*
Conditions of access to the data are described in the         Frequent Users, %
French Decree No 2016–1871 of December 26th, 2016.              Region             6.2              9.5      11.0         12.5     15.7
                                                                Class 1            6.2              8.6      9.7          10.8     13.2
Results
                                                                Class 2            7.1              9.9      11.1         11.9     14.7
FU’s rate
In 2015, 2,382,802 million patients (19.8% of the IdF           Class 3            10.6             12.6     13.4         14.4     15.7
population) visited at least once an ED of the IdF region,    College degree, %
accounting for 3,718,209 million visits. Among those            Region             11.2             20.0     26.2         32.2     50.3
visits, 44.6% of them were due to 1.6 million patients          Class 1            11.2             14.8     17.3         19.2     23.6
who visited the ED only once. FUs accounted for                 Class 2            17.3             24.9     27.0         30.0     36.9
278,687 patients, representing 11.7% of all ED patients
                                                                Class 3            26.3             35.5     38.9         43.9     53.8
and 30.8% of all ED visits (Table 1). Low FUs, High FUs,
and Very High FUs accounted respectively for 23, 7.2          Managers, %
and 0.6% of all ED visits (10.8, 0.9 0.02% of all ED pa-        Region             2.5              9.6      13.7         23.5     39.0
tients). FUs represent 2.3% of the IdF population.              Class 1            18.2             24.0     27.0         31.1     39.0
   The FUs represent 6.6% of ED patients aged [0–4]             Class 2            5.3              10.5     13.4         15.7     22.5
years old, 2.9% of the [25–34] y.o, and 5.7% of the pa-         Class 3            2.5              4.9      6.8          8.9      14.0
tients aged ≥85 y.o. Nineteen per cent of FUs benefit
                                                              Unemployed, %
from CMU-c vs 11% of non-FUs (NFU). Moreover, 0.5%
of FUs benefit from AME vs 0.3% for NFUs.                       Region             11.9             15.0     16.6         19.4     25.1
   Sixteen per cent of FU visits resulted in hospital ad-       Class 1            12.3             14.5     15.8         17.7     22.2
mission vs. 14.9% for NFUs visits. Complementary pro-           Class 2            11.9             14.7     16.1         17.4     21.0
cedures were necessary for 47.2% of FUs visits (38% for         Class 3            14.6             19.6     22.3         24.7     28.3
NFUs). Among the ED visits that did not result in hos-        Taxable households, %
pital admission, 22.2% consisted in a simple physician
                                                                Region             24.0             48.4     57.1         65.6     76.0
consultation, 17.5% needed at least one biology test,
16.5% at least one imaging exam, and 4% in at least one         Class 1            61.1             65.4     67.9         70.0     76.0
biology test and imaging exams. Characteristics of ED           Class 2            44.7             52.2     56.7         61.1     70.3
visits for FUs and NFUs are listed in Table 1.                  Class 3            27.8             35.6     39.9         42.3     50.1
   FUs: Frequent users: ≥ 3 visits/year. NFUs: Not Fre-       Single-parent families, %
quent Users: 1 to 2 visits/year. a Patients benefiting from     Region             7.6              15.1     17.6         21.0     26.8
the Comprehensive health coverage system for chronic
                                                                Class 1            10.8             14.6     16.4         17.6     21.3
health conditions (ALDs).
                                                                Class 2            9.5              14.6     16.8         19.2     25.6
Primary care use                                                Class 3            17.0             20.6     23.4         24.8     26.4
Among all FUs 28.1% of them visited a general practi-         HDI-2
tioner (GP) within 48 h before their ED visit, compared         Region             0.30             0.50     0.58         0.70     0.90
to 51.6% of NFUs (p < 0.000 Cramer’s V: 0.240). Fur-            Class 1            0.60             0.70     0.80         0.80     0.90
thermore, 84.7% of FUs had visited at least once a GP
                                                                Class 2            0.46             0.53     0.57         0.60     0.69
over the study period. On average, FUs visited a general-
ist twice a year. In addition, 73.7% of all FUs visited a       Class 3            0.40             0.40     0.40         0.50     0.50
specialist physician at least once over the study period      * Other than outliers. Q1: First quartile. Q3: Third quartile. HDI-2: Human
                                                              Development Index 2
(with an average of three visits per year).

FU’s rate and territorial characteristics
At GUs level, we report a median annual rate of ED            Correlations between the characteristics of the geo-
visits of 189.2 ‰ residents with an interquartile range       graphic units and the FU rates are reported in
[IQR] from 148.5 to 229.9. When analyzing the 232             Table 2. The density of GPs was not correlated with
GUs of the IdF region, the FU rate varied from 3.7 to         FUs rate whereas the density of pediatricians was
17.4% with a median of 11.0% [IQR: 9.5–12.5].                 negatively correlated with FUs rate.
Hellmann et al. BMC Public Health (2021) 21:1689 Page 7 of 12 Classes of geographical units 100,000 people under 18) and GPs density (2.4 times The hierarchical ascending classification resulted in more than 100 GPs per 100,000 inhabitants) (Table 4 three classes of GUs in the IdF area. Their geographical and Fig. 4a and b). In class 1, the proportion of FUs over partition is illustrated in Fig. 1. Two of the 3 classes 75 years-old was higher than in the other two classes identified present major differences in terms of socio- (16.2% vs. 6.8%). In contrast, class 3 had a higher FU rate economic indicators (classes 1 and 3). The profile of for ≤3 years-old. class 2 indicators is close to the regional level. Inter- class inertia (9.0) covers 64.8% of the total inertia (13.9). Discussion The class 1 is characterized by wealthy socio-economic Considering our results, Paris area is not spared with the conditions, included 67 GUs (32.6% of IdF population), FUs phenomenon, since they represent one tenth of all while class 3 included 51 GUs and social deprivation ED patients. These results are consistent with those usu- markers (20.5% of IdF population). Within class 3, the ally reported in the literature, varying from 4.5 to 9.9% IQR of FU rates ranged from 12.6 to 14.4% (median depending on the definitions as well as according to the 13.4%) vs 8.6 to 10.8% (median 9.7%) for Class 1 (Fig. 2, health systems studied [4, 15]. While the individual fac- Table 3). When comparing class 1 and 3, there were tors determining the use of emergency care are well doc- higher socio-professional profiles in class 1 with more umented, few studies have addressed the association individuals graduating from higher educational degrees between the socio-economic indicators of the geograph- and 3.8 times more executives than in class 3. Con- ical environment and the use of EDs [16, 17]. Recently, versely, GUs of class 3 reported more inactive individ- Lee and al. reported geographic variation in the demand uals and 1.4 times more single-parent families. All for emergency care [18]. The overall rate of emergency results are presented in Figs. 3a-f and in Table 3. Re- care use was correlated to the deprived socio-economic garding health care providers, class 1 included territories characteristics of a Census tract. The case of the FUs with a higher pediatrician’s density (3.8 times more terri- was not addressed in this approach. Thus, our study re- tories with pediatric densities over 40 pediatricians per port that the FUs phenomenon follows the same Fig. 3 A. Rate of individuals with college degree in each class of geographical units. Caption: For class 1 geographical units, the median rate of individuals with a college degree is 17.3% with an interquartile range from 14.8 to 19.2%. B. Rate of managers in each class of geographical units. C. Rate of unemployed in each class of geographical units. D. Rate of taxable households in each class of geographical units. E. Rate of single- parent families in each class of geographical units. F. Median and interquartile range of the Human Development Index-2 in each class of geographical units. (IdF area, 2015)
Hellmann et al. BMC Public Health           (2021) 21:1689                                                                                                Page 8 of 12

Table 4 Socio-economic characteristics of the different classes of geographical units (IdF area, 2015)
Characteristics *                                              IdF area         Class 1         P-value*       Class 2         P-value*       Class 3         P-value*
Geographical units (n)                                         232              67                             114                            51
Population, n                                                  12,055,277       3,934,850                      5,644,896                      2,475,531
%                                                              100              32.7                           46.8                           20.5
FU rate, mean (%)                                              11.0             9.6             < 0,001        10.9            NS             13.3            < 0,001
Education, mean (%)
    College Degree                                             38.3             57.2            < 0,001        34.0            < 0,001        23.3            < 0,001
Occupational status, mean (%)
    Managers                                                   16.1             27.3            < 0,001        13.6            < 0,001        7.2             < 0,001
    Employees                                                  17.4             12.3            < 0,001        18.2            0.001          22.2            < 0,001
    Manual Laborers                                            9.3              4.3             < 0,001        9.9             NS             14.6            < 0,001
    Unemployed                                                 19.9             16.3            < 0,001        16.2            < 0,001        22.5            < 0,001
Tax and income level, mean
    Taxable households (%)                                     55.9             67.5            < 0,001        56.8            NS             39.0            < 0,001
    Total amount of net tax (€ per year)                       5473             10,106          < 0,001        4054            < 0,001        2557            < 0,001
    Amount of salaries and wages (€ per year)                  34,717           46,982          < 0,001        32,348          < 0,001        23,899          < 0,001
    Amount of pensions and retirements (€ per year)            26,920           33,525          < 0,001        25,985          NS             20,334          < 0,001
Family composition, mean (%)
    Single-parent families                                     18.1             16.0            < 0,001        17.2            NS             22.9            < 0,001
    Families with three children or more                       12.2             9.3             < 0,001        11.3            NS             18.2            < 0,001
Development index, mean
    HDI-2                                                      0.59             0.76            < 0,001        0.57            NS             0.41            < 0,001
    HDI-2 < 0.52 (%)                                           28.4             0.0             < 0,001        17.5            < 0,001        90.2            < 0,001
Health care providers density (mean per 105 inhabitants)
    > 100 General Physicians                                   25.0             46.3            < 0,001        14.9            < 0,001        19.6            NS
    > 40 Pediatricians                                         24.1             59.7            < 0,001        7.0             < 0,001        15.7            NS
NS: Not significant (P > 0.05): The difference between the region mean and the class mean is not statistically significant. FU: Frequent users: ≥ 3 visits/year. HDI-2:
Human Development Index 2.
*P-value comparing for each class and each indicator the mean of mean per GU to regional average

variation as socioeconomic characteristics and indicators                              have primary care use close to that of the general popu-
of residential GU (low-income level, low level of employ-                              lation and visit a general practitioner twice a year (versus
ment or education, and family structure). The high rate                                2.7 for the general population). Nevertheless, it seems
of FUs could thus become an indicator of poverty in                                    that contrary to NFUs, the majority of FU patients do
these geographical areas and highlights social inequal-                                not see a GP before visiting the ED even though, accord-
ities in access to health. Working on these inequalities                               ing to the Organization for Economic Co-operation and
through joint policies with other partners (such as city,                              Development (OECD), France is one of the countries
education, or transportation actors) seems essential and                               with an easy daytime access to physicians [21].
might help in reducing the FU rate and increase the                                      Accessibility to the health care system does not de-
population’s health status.                                                            pend solely on medical density, but involves other deter-
   In multidimensional model, FUs rate was not corre-                                  minants such as affordability, acceptability, availability
lated with GPs density however class 1 and 3 present                                   [22]. In their study, Giebel et al. reported that in socially
different profiles of healthcare providers densities. The                              deprived areas, socio-economic determinants are associ-
evidence on the association between increasing the sup-                                ated with lower access to primary care and worse health
ply of primary care and lower ED visits was not univocal                               status. These markers were associated with higher ED
in several studies [18–21]. In light of ours results, we                               visiting rate [17]. In France, a recent study reported that
can challenge the assertion of efficiency of FU’s visits re-                           patients who have forgone health care for financial is-
duction Programs mainly based on the increase of pri-                                  sues, have indeed an increased use of EDs and a
mary care physicians. Moreover, we reported that FUs                                   decreased use of primary care physicians [23].
Hellmann et al. BMC Public Health (2021) 21:1689 Page 9 of 12 Fig. 4 A. Rate of geographical units in each class depending on their pediatrician density (IdF area, 2015). B. Rate of geographical units in each class depending on their general physician density (IdF area, 2015)
Hellmann et al. BMC Public Health   (2021) 21:1689                                                                          Page 10 of 12

Nevertheless, including other determinants of health ac-       frequent users. There are several definitions of multiple
cess, such as the distance between patient’s residence         emergency users in the international literature [7]. Hav-
and the nearest primary care facility or the availability of   ing no reference on the quantification of the FU
at-home GP visits could help refine our results. To re-        phenomenon in France and following ED visits distribu-
duce ED visits, it is also likely that public policies are     tion for our population, the cutoff chosen for this study
needed to improve accessibility by urban transit to pri-       was 3 ED visit within the year under study. It is un-
mary care services and to provide better housing and           doubtedly necessary to carry on more targeted studies
working conditions [17].                                       with different cut offs to better specify the FU
  There are several typologies of FU in the literature [4,     phenomenon in our region. Other limitations are related
24]. In our study, the prevalence of different chronic dis-    to the structuring of the databases that is only a reflec-
eases reported for FUs are higher than those observed in       tion of the construction of the French health care sys-
the general population. This trend is consistent with lit-     tem. The database used is issued from the universal
erature [25]. People with chronic illnesses and psychi-        health insurance claims database [11, 28]. While this
atric disorders are more likely to visit EDs; this also        database allows for almost complete exhaustivity on ED
holds true for people with low socio-economic status           visits, some characteristics of the studied population
[16]. These sub-populations of FU may be different tar-        could not be extracted (for example: the rate of ED visits
gets for action plans or specific approaches such as case      for foreigners without legal status and without medical
management, improved coordination of care or health            insurance). In addition, since the French universal health
education [6, 26–28]. These individual plans are often         insurance provides only few medical and clinical infor-
based on the principle of secondary prevention because         mation, it prevented us from giving a full medical profile
they are triggered after an ED visit through the detection     of the FUs population.
of a FU’s pattern. Primary prevention for FUs
phenomenon is not much discussed in the literature.            Conclusion
Our study shows a correlation between FUs environ-             Like other countries, France and more precisely the Ile-
mental factors (characteristics of the geographical unit)      de-France region (which comprises Paris) is not spared
and the FU rate. Thus, it seems possible for institution       with Frequent Users of Emergency Departments. Fre-
or health care providers to identify territories where resi-   quent users represent 11.7% of all ED patients and 30.8%
dents are at higher risk of developing FUs pattern and to      of all ED visits. Low socio-economic indicators among
suggest primary prevention actions.                            the IdF residential population is associated to higher rate
  Geographical targeting of the FU phenomenon was an           of FUs. The high density of pediatricians is associated to
important aim of our study. Geolocalization of health is-      lower rates of FUs whereas GPs density is not associated
sues makes it possible to address them in a multidimen-        to lower rates of FUs. Analyzing the geographical distri-
sional model [29]. It provides a better understanding of       bution of FUs rate, we identify and describe three differ-
the links between human environmental factors (particu-        ent classes of territories with different socio-economic
larly socio-economic) and various public health issues         profiles and different profiles of healthcare providers
[30]. This approach corresponds to the new orientations        densities. Social deprivation markers at a geographical
of health policies in France. Transforming our health          unit level are also associated to higher rates of FUs. Ef-
system requires a better targeted, more relevant and           forts to reduce this phenomenon may not only be car-
more efficient response by defining priority areas for ac-     ried out by health actors (public institutions, healthcare
tions [31]. Our study has highlighted a concentrated           providers), but must include all public territorial actors
geographical distribution of territories and municipalities    such as education, transportation, elected officials.
that are the most affected by the FU phenomenon. This          Transforming our health system requires a better tar-
is a fundamental first step before adapting and embra-         geted and a more efficient response by defining uphill
cing a territorial approach of public policies. It should      priority areas for actions. These targeted public policies
also help mobilizing decision makers of various public         should focus on disadvantaged territories.
services (education, health insurance, elected officials of
the communes...) and press them to act. A tiled distribu-      Abbreviations
tion of GU classes would jeopardize this kind of territor-     ALD: Affection Longue Durée; AME: Aide Médicale d’Etat; CMU-
ial approach. Indeed, the fragmentation of the IdF             c: Complementary Universal health coverage (Couverture Maladie Universelle
                                                               Complémentaire); ED: Emergency Department; FU: Frequent Users;
territory would dilute and scatter the means for actions       GP: General Physician; GU: Geographical Unit; HDI: Human Developpment
even preventing to deploy.                                     Index; IdF: Ile-de-France region; INSEE: National Institute of Statistics and
  However, our study presents some limitations. We de-         Economic Studies; IQR: InterQuartile Range; NFU: Non Frequent Users;
                                                               OECD: Organization for Economic Co-operation and Development;
fined two classes of emergency users based on the num-         PCA: Principal Component Analysis; SNDS: Système National des Données de
ber of visits generated during 2015, frequent and non-         Santé
Hellmann et al. BMC Public Health (2021) 21:1689 Page 11 of 12
Acknowledgements 3. Greall J. Report on territorialization of emergency activities [Internet]. 2015.
Authors wish to thank the study participants for their contribution to the Available from: http://solidarites-sante.gouv.fr/IMG/pdf/2015-07-06_Rapport
research. Authors are especially grateful to Agnes Ricard – Hibon, President Territorialisation_des_Urgences.pdf [last accessed 2020 February 14].
of the French Society of Emergency Medicine and Enrique Casalino, head of 4. LaCalle E, Rabin E. Frequent users of emergency departments: the myths,
the Emergency Department of Bichat – Claude Bernard Hospital in Paris the data, and the policy implications. Ann Emerg Med. 2010;56(1):42–8.
(Assistance Publique-Hôpitaux de Paris) for their strategic support. Authors https://doi.org/10.1016/j.annemergmed.2010.01.032.
are also grateful to Alain Michault for his extensive statistical work and help 5. Hunt KA, Weber EJ, Showstack JA, Colby DC, Callaham ML. Characteristics of
in designing and performing complementary analysis. This work would not frequent users of emergency departments. Ann Emerg Med. 2006;48(1):1–8.
have been possible without the logistic support of Christelle Codé and Eric https://doi.org/10.1016/j.annemergmed.2005.12.030.
Lepage (MD, PHD) to access to the National Health Data System. 6. Raven MC, Kushel M, Ko MJ, Penko J, Bindman AB. The effectiveness of emergency
department visit reduction programs: a systematic review. Ann Emerg Med. 2016;
Authors’ contributions 68(4):467–83. https://doi.org/10.1016/j.annemergmed.2016.04.015.
RH, AM2, MW conceived and designed the study. RH and AM2 supervised 7. Moe J, Kirkland SW, Rawe E, Ospina MB, Vandermeer B, Campbell S, et al.
the conduct of the study and data collection. AM2 and AM1 managed and Effectiveness of interventions to decrease emergency department visits by
analyzed the data. RH, MW, ALFP, AM2, DB drafted the manuscript, and EC, adult frequent users: a systematic review. Gratton MC, editor. Acad Emerg
ARH, FA, DBN contributed substantially to its revision. RH takes responsibility Med. 2017;24(1):40–52. https://doi.org/10.1111/acem.13060.
for the paper as a whole. All authors have read and approved the final 8. Skinner K, Carter L, Haxton C. Case management of patients who frequently
manuscript. present to a Scottish emergency department. Emerg Med J. 2009;26(2):103–
5. https://doi.org/10.1136/emj.2008.063081.
Funding 9. Ruger JP. Analysis of costs, length of stay, and utilization of emergency
This research did not receive any specific grant from funding agencies in the department services by frequent users: implications for health policy. Acad
public, commercial, or not-for-profit sectors. Emerg Med. 2004;11(12):1311–7. https://doi.org/10.1197/j.aem.2004.07.008.
10. Tuppin P, Rudant J, Constantinou P, Gastaldi-Ménager C, Rachas A, de
Availability of data and materials Roquefeuil L, et al. Value of a national administrative database to guide
The datasets generated and analyzed during the current study are not public decisions: From the système national d’information interrégimes de
publicly available due to legal restrictions. The national legislation in France l’Assurance Maladie (SNIIRAM) to the système national des données de
protects personal data and materials. Therefore, before any data transfer a santé (SNDS) in France. Rev Épidémiol Santé Publique. 2017;65:S149–67.
legal authorization has to be obtained from CNIL, the French data protection https://doi.org/10.1016/j.respe.2017.05.004.
authority. 11. Tabuteau D, Bras PL. Les assurances-maladie. 1ère édition. Presses
Universitaires de France - P.U.F.; 2012. 128 p. (Que sais-je ?)
Declarations 12. Klugman J, Rodríguez F, Choi HJ. The HDI 2010: new controversies, old
critiques. J Econ Inequal. 2011;9(2):249–88. https://doi.org/10.1007/s10888-
Ethics approval and consent to participate 011-9178-z.
The database used for the study has been registered with the French Data 13. Nascimento I, Carrage S, Camard J-P, Mitton C. L’indicateur de
Protection Authority (CNIL). Due to its nature, and based on the French développement humain 2 (IDH2) en Île-de-France: un outil de mesure des
Public Health Code and national guidelines (Law n°94–548 of July 1st 1994 inégalités sociales. Rev Épidémiol Santé Publique. 2008;56(6):S382. https://
relating to the processing of personal data for the purpose of research in the doi.org/10.1016/j.respe.2008.07.078.
health field), this study is excluded from other legal requirements applicable 14. Pampalon R, Hamel D, Raymond G. A deprivation index for health planning
to research involving humans including the patient need for approval. in Canada. Chronic Dis Can. 2009;29(4):178–91. https://doi.org/10.24095/
hpcdp.29.4.05.
Consent for publication 15. Leporatti L, Ameri M, Trinchero C, Orcamo P, Montefiori M. Targeting
Not applicable. frequent users of emergency departments: prominent risk factors and policy
implications. Health Policy. 2016;120(5):462–70. https://doi.org/10.1016/j.hea
Competing interests lthpol.2016.03.005.
All authors declare having no competing interests. 16. Or Z, Penneau A. A multilevel analysis of the determinants of emergency
care visits by the elderly in France. Health Policy. 2018;122(8):908–14.
Author details https://doi.org/10.1016/j.healthpol.2018.05.003.
1
Health Regional Agency of Ile de France, Paris, France. 2Emergency 17. Giebel C, McIntyre JC, Daras K, Gabbay M, Downing J, Pirmohamed M,
Department, Bichat hospital, Assistance Publique-Hôpitaux de Paris, Paris, et al. What are the social predictors of accident and emergency
France. 3SAMU 93 - Emergency Department, Avicenne hospital, Assistance attendance in disadvantaged neighbourhoods? Results from a cross-
Publique-Hôpitaux de Paris, Bobigny, France. 4University Sorbonne Paris sectional household health survey in the north west of England. BMJ
Nord, Health Education and Practices Laboratory (LEPS EA3412), Bobigny, Open. 2019;9:e022820.
France. 5CIUSSS Nord de l’île de Montréal, Québec, Montréal, Canada. 18. Lee DC, Doran KM, Polsky D, Cordova E, Carr BG. Geographic variation in
6
Conservatoire National des Arts et Metiers, Paris, France. 7Paris University, the demand for emergency care: a local population-level analysis.
INSERM, IAME, F-75006, Paris, France. 8Emergency Department, Centre Healthcare. 2016;4(2):98–103. https://doi.org/10.1016/j.hjdsi.2015.05.003.
hospitalier René Dubos, Pontoise, France. 9Direction de l’organisation 19. Improve the quality of the health system and control spending: proposals
médicale et des relations avec l’université, Assistance Publique-Hôpitaux de of National Health Insurance [Internet]. Assurance Maladie; 2018 Jul.
Paris, Paris, France. 10Emergency Department, Centre Hospitalier de (Rapport au ministre chargé de la Sécurité sociale et au Parlement sur
Saint-Denis, Saint-Denis, France. 11Observatoire Regional des Soins Non l’évolution des charges et des produits de l’Assurance Maladie). Available
Programmés - Ile-de-France, Saint-Denis, France. from: https://assurance-maladie.ameli.fr/sites/default/files/rapport-activite-
charges-produits-18_assurance-maladie.pdf [last accessed 2020 February 14].
Received: 11 September 2020 Accepted: 30 August 2021 20. Van den Heede K, Van de Voorde C. Interventions to reduce emergency
department utilisation: a review of reviews. Health Policy. 2016;120(12):
1337–49. https://doi.org/10.1016/j.healthpol.2016.10.002.
References 21. Huntley A, Lasserson D, Wye L, Morris R, Checkland K, England H, et al.
1. Cour des comptes. Annual public report 2019 [Internet]. 2019. Available Which features of primary care affect unscheduled secondary care use? A
from: https://www.ccomptes.fr/system/files/2019-02/08-urgences-hospita systematic review. BMJ Open. 2014;4(5):e004746. https://doi.org/10.1136/
lieres-Tome-2.pdf [last accessed 2020 February 14]. bmjopen-2013-004746.
2. Ministry of Solidarity and Health. “My health 2022”: Health System Transformation 22. Levesque J-F, Harris MF, Russell G. Patient-centred access to health care:
Plan [Internet]. 2019. Available from: https://solidarites-sante.gouv.fr/IMG/pdf/ma_ conceptualising access at the interface of health systems and populations.
sante_2022_synthese.pdf [last accessed 2020 February 14]. Int J Equity Health. 2013;12(1):18. https://doi.org/10.1186/1475-9276-12-18.Hellmann et al. BMC Public Health (2021) 21:1689 Page 12 of 12
23. Feral-Pierssens AL, Rives-Lange C, Matta J, Rodwin VG, Goldberg M, Juvin P,
et al. Forgoing health care under universal health insurance: the case of
France. Int J Public Health. 2020;65(5):617–25. https://doi.org/10.1007/s0003
8-020-01395-.
24. LaCalle EJ, Rabin EJ, Genes NG. High-frequency users of emergency
department care. J Emerg Med. 2013;44(6):1167–73. https://doi.org/10.1016/
j.jemermed.2012.11.042.
25. Soril LJJ, Leggett LE, Lorenzetti DL, Noseworthy TW, Clement FM.
Characteristics of frequent users of the emergency department in the
general adult population: a systematic review of international healthcare
systems. Health Policy. 2016;120(5):452–61. https://doi.org/10.1016/j.hea
lthpol.2016.02.006.
26. Emergency Care Services: Trends, Drivers and Interventions to Manage the
Demand [Internet]. 2015 Aug. Report No.: 83. Available from: https://www.
oecd-ilibrary.org/social-issues-migration-health/emergency-care-services_
5jrts344crns-en [last accessed 2020 February 14].
27. Althaus F, Paroz S, Hugli O, Ghali WA, Daeppen J-B, Peytremann-Bridevaux I,
et al. Effectiveness of Interventions Targeting Frequent Users of Emergency
Departments: A Systematic Review. Ann Emerg Med. 2011;58:41–52.e42.
28. Kanzaria HK, Niedzwiecki MJ, Montoy JC, Raven MC, Hsia RY. Persistent
frequent emergency department use: Core Group exhibits extreme levels of
use for more than a decade. Health Aff (Millwood). 2017;36(10):1720–8.
https://doi.org/10.1377/hlthaff.2017.0658.
29. Bilheimer LT, Klein RJ. Data and measurement issues in the analysis of
health disparities: disparities data and measurement. Health Serv Res. 2010;
45(5p2):1489–507. https://doi.org/10.1111/j.1475-6773.2010.01143.x.
30. Dubowitz T, Heron M, Bird CE, Lurie N, Finch BK, Basurto-Dávila R, et al.
Neighborhood socioeconomic status and fruit and vegetable intake among
whites, blacks, and Mexican Americans in the United States. Am J Clin Nutr.
2008;87(6):1883–91. https://doi.org/10.1093/ajcn/87.6.1883.
31. Île de France Regional Health Project 2018–2022: strategic orientation
framework [Internet]. Agence Régionale de Santé d’Ile de France; 2018.
Available from: https://www.iledefrance.ars.sante.fr/system/files/2019-02/201
80911_COS%20IdF_Publication%20officielle.pdf [last accessed 2020 February 14].
Publisher’s Note
Springer Nature remains neutral with regard to jurisdictional claims in
published maps and institutional affiliations.You can also read