The 2021 Scottish Parliament Election
←
→
Page content transcription
If your browser does not render page correctly, please read the page content below

The 2021
Scottish
Parliament
Election
Professor Ailsa Henderson, University of Edinburgh
Dr Jac Larner, University of Edinburgh, Cardiff University
Dr Fraser McMillan, University of Glasgow
Professor Christopher Carman, University of Glasgow
Professor Chris Hanretty, Royal Holloway, University of London
Professor Rob Johns, University of Essex
Contents

Introduction........................................................................................................................
            ........................................................................................................................ 1

The Campaign......................................................................................................................3
               ...................................................................................................................

The Issues...........................................................................................................................
          ...........................................................................................................................8

The Vote..............................................................................................................................
        ..............................................................................................................................11

The Result and Aftermath..............................................................................................
                        .............................................................................................. 24

                                                                                                   ESRC Grant: ES/V01000X/1
                                                                                                   Photo by Joad Hughes on Unsplash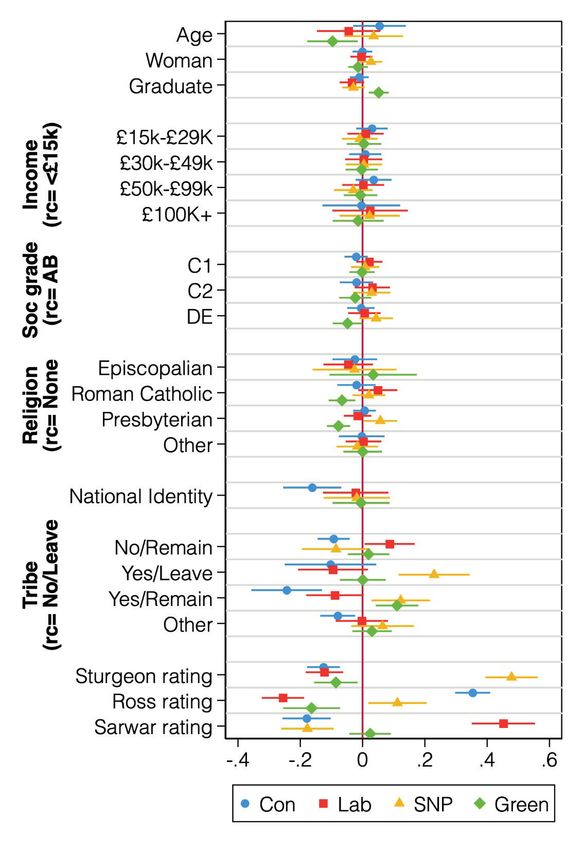
1. Introduction

The 2021 Scottish Parliament election on 6th May was the sixth election held since the institution began
operating in 1999. It happened not only amid pandemic-related social and economic restrictions, but in
an entirely different political context to the previous vote five years earlier.

Background
The 2016 election, which returned for the third time a pro-independence Scottish National Party (SNP)
government, had been held just weeks before the UK-wide referendum on European Union membership.
In that referendum, 62% of Scots voted to Remain in the EU, but the UK-wide result produced a narrow
win (52%) for Leave. Claims that the result was proof of Scotland’s “democratic deficit” instantly reinvigorated
debates about Scottish independence just two years after the 2014 referendum in which 55% of Scottish
voters had opted to stay in the UK. In that referendum, both the pro-independence Yes Scotland and pro-
union Better Together campaigns had emphasized the importance of EU membership. Better Together
claimed an independent Scotland would find itself outside the EU by virtue of having left a member state.
Yes Scotland claimed that Scotland, if it remained in the UK, would find itself removed from the EU thanks
to a Eurosceptic English electorate. At the time, both scenarios were entirely plausible and highlighted the
perceived importance of EU membership to Scottish voters.

Having asserted in the 2016 election campaign that a ‘material change in circumstances’ would warrant
holding another referendum on Scottish independence, the SNP government was empowered by the
Brexit vote to begin calling for that referendum.

At the same time, the extended and, at times, fractious negotiations on the UK leaving the EU contributed
to two changes in Prime Minister preceding two UK-wide elections in 2017 and 2019. It was the arrival of
Boris Johnson as Prime Minister in summer 2019, however, that prompted a slow rise in support for
independence, culminating in a run of polls with Yes in the lead. The pandemic further highlighted the
extent to which Scots held the Prime Minister and the Conservative UK government in low regard. The SNP
therefore went into the 2021 election campaign on the back of their record for pandemic management
(poor in absolute terms if measured by rates of infection and deaths, but better in relative terms than the
UK government’s) and pitching the 2021 vote as yet another chance to secure a mandate for a second
referendum.

By early 2021 Scotland had endured more than a year of continuous COVID-19 restrictions. While
coronavirus infection rates and death rates lagged those in England, these rates were themselves among
the highest in Europe. As health policy is devolved, the Scottish Government was able to take independent
decisions about most measures, although the administration’s lack of control over many fiscal levers
limited the scope of decision-making which, at times, caused political friction with the UK Government.
While it exercised this discretion to enter lockdown slightly sooner and emerge later, in general the Scottish
Government pursued policies broadly similar to those of the UK Government.

The 2021 Scottish Parliament Election                                                                         1
Parties and Leaders
As in 2016, the SNP was led into the election by the popular First Minister Nicola Sturgeon, who throughout
2020 had been buoyed in opinion polling by perceptions of her government’s pandemic handling. These
ratings took a knock in the early part of 2021 as lockdown fatigue set in and she became increasingly
embroiled in a high-profile political scandal surrounding the Scottish Government’s handling of sexual
misconduct allegations against her estranged mentor and predecessor Alex Salmond. Meanwhile, the
Scottish Greens, the only other pro-independence party with representation in parliament, acquired co-
leader Lorna Slater, who joined the long-serving Patrick Harvie. A new pro-independence party, Alba, was
established by Salmond to contest regional (but not constituency) seats.

There was more change on the pro-union side of the political spectrum. After the 2016 election Kezia
Dugdale stepped down as Labour leader to give her successor enough time to lead the party before the
2021 election. New leader Richard Leonard, however, struggled to improve the party’s fortunes. His own
personal polling slumped after Jeremy Corbyn’s replacement by Keir Starmer as UK Labour leader in
2020. Leonard resigned in January 2021 without having contested an election and was replaced by former
deputy leader Anas Sarwar. Ruth Davidson, leader of the Scottish Conservatives in 2016, left Holyrood
following Boris Johnson’s 2019 general election victory, and was replaced by Westminster MP Douglas
Ross. Willie Rennie remained leader of the Liberal Democrats.

Voting
The electoral system remained the same in Scotland but there were important extensions to the electoral
franchise. This included the right of foreign nationals resident in Scotland to vote, as well as prisoners
serving sentences of 12 months or fewer. The enhanced availability of postal voting, as well as the ability
to employ proxy votes until the day of the election itself, were intended to improve accessibility to an
election occurring during a global pandemic.

About the Study
Using data from the Scottish Election Study (SES), this report provides insights into how voters reacted to
the election campaign as well as how they made voting decisions. The SES is a non-partisan academic
study of voter attitudes and behaviours in Scotland and has been funded by the ESRC for every devolved
election since 2007. The current SES is carried out in two online surveys around the Scottish Parliament
election: a campaign wave, beginning four weeks before the election and running until the day before the
election, and a post-election wave beginning the week after the election. The SES employs a panel design,
reinterviewing the same respondents in both waves. 4,674 respondents took part in the pre-election wave,
with 3,442 respondents returning for the post-election wave, producing a re-contact rate of just under three
quarters (74%). The study also included a booster sample of 288 16–17-year-olds. Fieldwork was conducted
by YouGov.

The sample was drawn by YouGov to be representative of the wider Scottish electorate (rather than
YouGov’s panel members), using a combination of factors including age, gender, education, and social

2                                                                           The 2021 Scottish Parliament Election
class. The sample is representative both demographically and politically, and therefore considers past
voting behaviour and levels of political interest.

All data are weighted to be representative of the electorate. In this instance, data are weighted by age
interlocked with gender, as well as education, social class, region, birthplace, 2019 election vote, 2014
independence referendum vote and attention to politics.

The 2021 Scottish Parliament Election                                                                   3
2. The Campaign

The 2021 Scottish election campaign took place in the midst of a global pandemic in which 8,532 Scots
had lost their lives by end of April 2021. This affected both the start and form of campaigning. Before 15
March parties were only allowed to distribute leaflets by post, with in-person campaigning suspended.
Permission to ‘doorstep’ began 5 April but only if the Scotland-wide infection rate remained below
50/100,000 and was set to be suspended in any local authorities if the local infection rate was higher than
100/100,000. Campaigners were unable to stray beyond their local authority if their constituency straddled
council boundaries (which applies in 12 of the 73 constituencies) but candidates and their support staff
were allowed to travel freely. It was, in short, a challenging context in which to campaign. For all that, and
perhaps because the population had been in a form of lockdown since the start of the year, levels of
interest remained high across the population. In our survey, almost 4 in 5 (78%) professed themselves
interested in the election before it occurred, with 44% claiming they were very interested. 67% claimed they
were certain to vote (rating the likelihood of 8,9 or 10/10), and a further 14% told us they’d already voted by
post before the election.

Typical signs of campaigns – signs in gardens, street stalls and physical hustings of candidates - were
largely absent in 2021, though, replaced in some cases by events online. As a result, the televised debates
among leaders provided a rare campaign spectacle. We know from previous elections that a minority of
the electorate watches debates, and a still smaller proportion make up their minds based on debate
performance. This remained true in this election. More than 4 in 5 (81%) claimed not to have watched any
of the televised debates.

Asked whether the debates helped to confirm or change their minds, almost two thirds (64%) said that the
debate had no impact on their vote as their mind was already made up, with a further 7% saying that they
watched a debate but still did not know how to vote. Of those for whom it had a greater impact, a quarter
(25%) said it made them ‘think’ but didn’t change their mind, 4% said it got them ‘seriously thinking about
changing’ their mind. Less than one percent – indeed three people in a sample of almost 5000, Scots -
said that the debate ‘changed my mind completely’.

Of course, debates can have multiple possible impacts. They can reassure possible voters that they have
made the right choice, they can help leaders to improve their visibility or enhance their popularity, they can
educate an electorate about policy issues or trade-offs, and they can change voters’ minds. From our data
there is very little evidence that debates in Scottish elections performed this last function.

The limited influence of debates is determined in part by when voters decide how to cast their ballots.
Among those who voted at a polling station, 20% said they always vote the same way, and a further fifth
said they decided in the year before the election how they would vote. 25% decided ‘early on’ in the
campaign, and 20% decided in the last few days. Remarkably, more than 10% walked into the polling
station not knowing how they were going to vote. What this means, is that a substantial majority of the
electorate had already made up its mind before the debates occurred. It is therefore not that leaders’
debates are unique among campaign events in their lack of influence, rather that less than a third of the
electorate is still making up its mind once the campaign has been underway for a while.

4                                                                              The 2021 Scottish Parliament Election
Even though campaigning began late, and was constrained by travel restrictions, we tracked voter exposure
to parties as well as how voters felt about the campaign itself. In terms of contact, Table 1 summaries how
and by whom voters were contacted during the 2021 election.

Table 1: Voter Contact Patterns in the 2021 Scottish Election Campaign (%)
                                          Leaflets                  Social media            Phone                     Home
 SNP                                      82                        59                      14                        41
 Labour                                   78                        44                      16                        24
 Conservatives                            73                        48                      50                        8
 Liberal Democrats                        60                        28                      10                        23
 Greens                                   52                        30
Figure 1: Voter evaluations of the 2021 campaign To understand voter engagement with the 2021 campaign it is useful to discuss voter understandings of the wider context of Scottish elections and devolution. The Scottish mixed member proportional system allows voters to cast ballots in 73 constituency contests and then cast a vote for a party in one of Scotland’s eight electoral regions. These regional seats are distributed taking into account a party’s performance in the constituency contests within that region. Twenty years after devolution, do voters feel they understand the electoral system? Not overwhelmingly so. While almost one quarter rate their knowledge as 8,9 or 10/10, almost one in five (18%) rate their knowledge of the electoral system as 0, 1, or 2, out of 10. That said, 81% know you can vote for the same party twice on the constituency and list ballots, a 10-point increase since 2016 perhaps helped by the SNP’s high-profile “Both Votes SNP” campaign. Devolved elections select a government to decide policy in devolved areas of legislative competence. Twenty years after devolution just over 15% Scots rated their knowledge of devolved politics in Scotland as 8,9 or 10/10. When it comes to specific policy areas, knowledge of what is devolved to Holyrood or reserved to Westminster is patchy, as the results in Figure 2 make clear. Four in five know that education is devolved and defence is reserved. But even during a pandemic election campaign, preceded for much of the previous year by daily press conferences from the First Minister about the Scottish government’s handling of the health crisis, more than a third of Scots did not know that health is devolved. And even though Scotland’s distinct legal system has been preserved in law since the Acts of Union in 1707, more than half of the Scottish electorate does not know that policy about law and order is devolved. This has obvious implications for how voters reach decisions in elections, but also which governments they reward and blame for policy successes and failures. If there is a bright spot, it is that knowledge of what is devolved 6 The 2021 Scottish Parliament Election
and reserved had improved slightly on 2016. Perhaps unusually, knowledge gains were lowest for health.

Figure 2: Knowledge of devolved policy competence (% correctly identifying policy as
devolved/reserved)

Leadership
The SES tracked voter attitudes to leaders. The results in figure 4 show what each party’s voters (on the
vertical axis) thought of their own and the other leaders. To a certain extent the results are what we might
expect. On a scale running from 0 to 10, where higher numbers indicate greater approval, most party’s
supporters rate their own party leader higher than other leaders. And yet the extent to which there is a clear
preference gap for a party leader varies significantly. The gap is largest for Nicola Sturgeon, whose own
party supporters give her a near perfect approval rating but show a more than two-point gap to the next
most favourable leader, Patrick Harvie. The gap is smallest for the Greens, who provide near identical
scores to their own leader and Sturgeon, and in fact provide a more positive approval rating to the First
Minister.

Each of the Conservatives, Labour and Lib Dems view their own leader more favourably than the others
but without much enthusiasm, average approval scores barely above 6. Anas Sarwar was seen as the
next most favourable option for the Liberal Democrats (and Labour voters returned the favour for Rennie).
Conservative voters saw little between the other pro-union parties. As for Alba, their leader, former First
Minister Salmond, was viewed most negatively by Labour and the Liberal Democrats, while supporters of
pro-independence parties judged the new Conservative leader most harshly (with Salmond not far behind).
Conservative voters were alone in giving the current First Minister the lowest approval ratings of any of the
party leaders, which speaks to the level of polarisation across the two parties that have emphasized the
constitutional issue the most since the 2014 referendum.

The 2021 Scottish Parliament Election                                                                       7
Figure 3: Leader evaluations (0-10) by list vote

8                                                  The 2021 Scottish Parliament Election
3. The Issues

Electoral researchers commonly distinguish between issues and cleavages. Issues are grist to the mill of
everyday political debate; the bread-and-butter societal problems representative democracy is designed
to amicably resolve. Cleavages, meanwhile, are fundamental socio-political dividing lines which transcend
day-to-day concerns. They provide the structure underpinning party systems and voting behaviour over
many decades.

While the line between issues and cleavages can be blurry, the distinction is key to understanding the 2021
Scottish election. During the campaign, parties talked about a range of important policy issues, particularly
the COVID-19 lockdown exit and steps to societal recovery. But one cleavage - Scottish independence -
still ultimately ruled the day, and SES data can help us understand why.

In the year or so before the election, opinion polls showed strong increases in approval for Nicola Sturgeon
personally as well as SNP vote intention amidst the perception that the Scottish Government had done a
better job of handling the pandemic than the UK Government. Figure 5 below shows how SES respondents
rated the performance of each administration on communicating decisions, implementing lockdown, and
distributing vaccines on a scale from 6(very well) to 0 (very badly). Overall, the devolved administration is
thought to have performed substantially better on communication and lockdown handling with most voters
answering a 4, 5 of 6. On vaccines, perceptions of Scottish and UK Government performance are near
identical.

Figure 4: Voter evaluations of Scottish and UK Government pandemic handling

The 2021 Scottish Parliament Election                                                                      9
Clearly, the impression of good Scottish Government pandemic performance persisted through to the
election. All major parties presented strategies for Scotland’s recovery and challenged each other’s plans,
but there was ultimately little substantive difference in approach across the board. The parties also debated,
among other things, mental health services, energy and climate change, Scotland’s relationship with
Europe after Brexit, social welfare, as well as the SNP’s controversial record on education, adult social care
and drug deaths.

These are all deeply important issues, exerting profound effects on the daily lives of ordinary Scots. However,
in terms of framing and helping to understand voting behaviour, they are all ultimately subsumed by the
most important cleavage in Scottish politics – the political conflict between those who support independence
and those who oppose it. And, since the 2014 referendum, this cleavage has repeatedly trumped other
concerns for most Scottish voters.

The 2021 election did not break this pattern. Even amid a once-in-a-century global pandemic, in the
immediate aftermath of Brexit, under a government plagued by substantive criticisms of its policy, it was
yet again Independence Wot Won It for the incumbent SNP and, more generally, the pro-independence
half of the electorate. When asked how they would vote in a future independence referendum, 92% of SES
respondents expressed a Yes or No vote intention, and 92% of those voters chose a party aligned with this
preference in their local constituency. This translates, overall, to 85% of Scottish voters casting a constitutional
consistent ballot.2 This benefits the nationalist parties because, at least on the constituency ballot, the SNP
are the only pro-independence game in town.

Indeed, the constitutional divide is so powerful that it structures how voters respond to other issues. SES
data show that only 9% of voters believe that the quality of education in Scotland has improved since the
last election, versus 47% who believe it has declined. Figure 5 shows how 2021 SES respondents rated
their trust in the three main parties to handle education policy using simple averages broken down by 2014
independence referendum vote. Seven years on indyref vote choice remains strongly associated with
approval of a completely devolved, unrelated policy area for which the long-term incumbent has come
under serious criticism.3

2. Though we acknowledge is currently unclear which is driving which.

3. See OECD’s independent review https://www.oecd.org/education/scotland-s-curriculum-for-excellence-bf624417-en.htm accessed 13/02/22

10                                                                                                The 2021 Scottish Parliament Election
Figure 5: Voter Trust in parties to handle education, by 2014 independence vote

After 2014, the SNP effectively turned the Yes coalition into a stable electoral one and the party has largely
maintained the support of these voters across the board.

Of course, we know that there were two referendums in short succession in Scotland, and Brexit is
attributed with increasing electoral polarisation in England, so it is reasonable to assume that it might exert
a similar role in Scotland. As we have outlined elsewhere, the two constitutional issues have created four
tribes in Scotland, clustering together Yes Remainers, No Remainers, No Leavers and Yes Leavers. The
size of these tribes has changed over time, particularly for those whose partisan and constitutional
preferences were out of alignment. While the largest group after the 2016 referendum were No Remainers,
the modal voter in Scotland is now a Yes Remainer.

The 2021 Scottish Parliament Election                                                                       11
Figure 6: Voter Trust in parties to handle education, by current constitutional tribe

To understand how Brexit compares to independence as a cleavage we can look at the same issue of
education, a policy area seemingly unaffected directly by either. If we focus on evaluations of Conservatives
and the SNP alone, we can see that there is a stark difference in evaluations when both constitutional
positions are represented by the party. No Leavers have a 5-point gap on a 10-point scale between the
level of trust in education for Conservatives (high) or SNP (low). The reverse is true of Yes Remainers, where
there is a 6-point gap between trust in education in the SNP (high) and Conservatives (low). The gap is
narrower where voters would face cross pressures on constitutional issues. Yes Leavers, however, are still
markedly more likely to trust the SNP than the Conservatives. For No Remainers, the gap is smallest, with
Conservative trust greater than SNP trust. The results suggest that Brexit can soften the cleavage effects
of independence when voters are cross pressured, but that they do not exert the same equivalent pull-on
voters. The effects, however, are asymmetrical. Those who prioritise independence (like the SNP) but
support Leave (like the Conservatives) rate the SNP much more highly than they do the Conservatives,
and possess levels of SNP support not dissimilar to Yes Remainers. Among No Remainers voters, the SNP
does almost as well as the party that has devoted the greatest political capital to opposing independence.
The gap widens only with the switch to Leavers.

12                                                                            The 2021 Scottish Parliament Election
4. The Vote

Early Voting
One of the many ways the 2021 election was unique was the prevalence of early voting. As a result of the
COVID-19 pandemic, unprecedented numbers of voters applied to vote via postal ballots.4 According to
the Electoral Commission, over one million voters registered to cast a ballot by post, which represented a
40% increase on the previous election. Since 87% of these cast a ballot, just under one third of votes in the
2021 election were cast by post.5 Within the SES sample, 40% of those who voted did so via post, with
59% voting in person at a polling station.

Of those who voted by post, 26% indicated they did so because they were concerned about voting in
person, with the rest stating that they always voted by post or that they considered it more convenient.
Given the extraordinary circumstances in which voting took place on election day, we also asked
respondents how safe they felt about their trip to the polling station. Generally, respondents were
overwhelmingly positive about their voting experience: 93% agreed there was appropriate social distancing,
88% said sanitiser was readily available, and 84% said that poll workers wore masks. Overall a very
impressive 99% of respondents said they felt safe visiting the polling station.6

Figure 7 displays the vote shares of each party among voters who cast their ballot via post and those who
voted in person at a polling station. In person voting was skewed slightly more in favour of the SNP and
Scottish Labour, with Conservatives and Liberal Democrats doing better among postal voters. This is likely
a reflection of age differences between these two groups: older voters were more likely to vote by post, and
this same group is also more likely to vote Conservative and Liberal Democrat.

4. BBC News (14/04/2021) ‘Scottish Election 2021: Record number apply for postal votes’ https://www.bbc.co.uk/news/uk-scotland-glasgow-
west-56733862

5. https://www.electoralcommission.org.uk/who-we-are-and-what-we-do/elections-and-referendums/past-elections-and-referendums/scottish-
parliamentary-elections/report-scottish-parliament-election-6-may-2021

6. 71% said “I felt very safe” and 28% said they felt “fairly safe”

The 2021 Scottish Parliament Election                                                                                                     13
Figure 7: Reported constituency vote shares for each party by vote method

A first-order election?
A common framework for analysing sub-state elections like those to the Scottish Parliament is the idea that
they are ‘second-order’ to state-wide (in this case, Westminster) elections. The assumption is that people
decide how to vote in these second-order elections according to what is happening at the UK-wide level,
and in particular vote choice reflects something of a referendum on the performance of the UK Government.
In Scotland, this argument has been robustly challenged both in terms of voter turnout (Henderson and
McEwen 2010, 2015) and the decision-making calculus (Wyn Jones and Scully 2006, Schakel and Jeffery
2012, Henderson et al. 2021).
In the Scottish Election Study, we asked people where they were focusing in making their voting decision.
Since 2007 the SES data have shown a steady increase in the proportion saying they vote based on
Scottish issues, reflecting the bedding in of devolved politics. We know, however, that a lot of people vote
in elections according to their constitutional preferences – especially since 2014 – and that this complicates
matters because some people think of the constitution as a Scottish issue while others see it as a British
issue because it is within the legislative competence of Westminster. When framed as a choice between
Scottish issues, British issues and the relationship between Scotland and the rest of the UK, only a relatively
small number of voters said they decided how to vote mostly according to what happened in Britain as a
whole. Nearly half (47%) said they decided according to what has happening in Scotland, and just over a
quarter (27%) said their vote choice was shaped mostly according to the relationship between Scotland
and the rest of the UK. This adds to the growing body of evidence that most voters in Scotland do not see
Holyrood elections as ‘second-order’ elections, but rather are important elections in their own right.

14                                                                            The 2021 Scottish Parliament Election
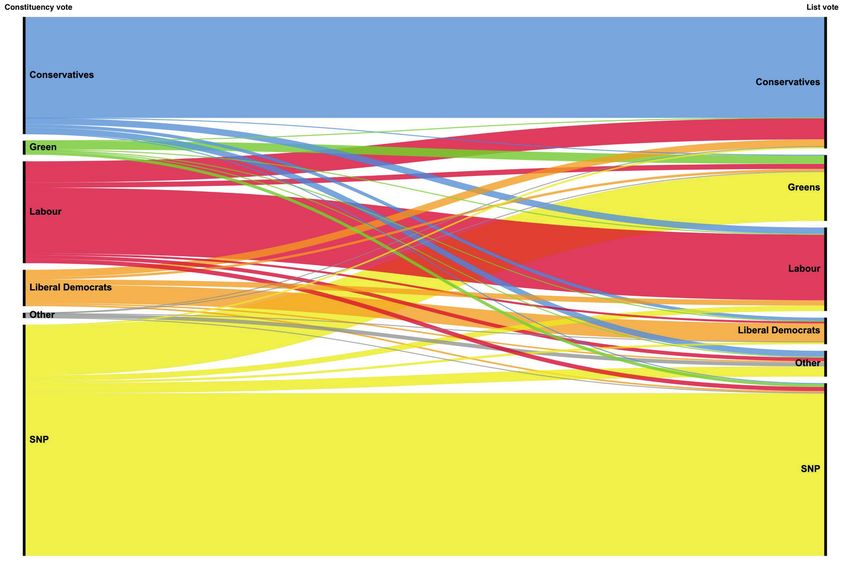
Figure 8: In deciding how to vote in the Scottish Parliament election, will or did you decide...

Split-ticket voting
As voters have two ballots, they can vote for two different parties in the same election (one in the constituency
and one in the list). The 2021 Scottish Election Study saw more voters (29%) report they cast split-tickets
than for any other Scottish Parliament election. Some of this is out of necessity: 12.2% of all regional votes
were cast for parties that did not stand a candidate in constituency ballots.7 Yet that still leaves a substantial
portion of voters who choose to cast split-tickets for other reasons.

Table 10 outlines the responses to the question “Still thinking of this constituency vote/regional vote, which
of the following comes closest to the main reason why you voted for this party’s candidate?” The table is
divided by whether a respondent cast a straight-ticket (two votes for same party) or a split-ticket. The
results show that straight ticket voters are most motivated by party policies, then habit. Split-ticket voters
are also likely to cite party policies, but they were more likely to cite a tactical vote at the constituency level,
and this was the second most preferred option on the list vote as well. Split-ticket voters were least motivated
by habit, leaders, and candidates. It is worth noting that 7% of split ticket voters explained by their vote by
the fact that their preferred party was not standing candidates in their constituency. When you consider
the size of the relevant groups, one fifth of all ballots cast in constituency contests were cast tactically to
stop another party, as were a slightly smaller proportion of ballots cast for list seats.

7. This is excluding regional votes cast in the 12 constituencies where the Scottish Greens stood candidates.

The 2021 Scottish Parliament Election                                                                            15
Table 2: Reasons for voting, by straight- or split-ticket voting

                                                               Constituency vote                List vote
                                                               Straight ticket   Split ticket   Straight ticket    Split ticket

 I always vote this way                                        24                10             25                 10

 Party has best policies                                       37                25             38                 42

 Party has best leader                                        16                 10             16                 8

 Voted for specific candidate                                  3                 10             2                  2

 Tactical vote to stop another party                          16                 29             15                 23

 Preferred party had no chance of winning                      2                 5              1                  4

 Preferred party didn’t stand a candidate
Figure 9: Split ticket voting movement in the 2021 election Explaining the Vote So how can we explain why people voted the way they did? To address this question, we will first look at the relationship between vote choice and socio-demographics and identities, before running more detailed statistical models of the constituency and list votes. Socio-demographics Focusing first on age, Figures 10a and 10b show the distribution of constituency and regional list vote choice within different age groups. The data show clear age voting patterns with the Conservatives doing well among older voters and the SNP and Greens doing better among younger voters (although the SNP win at least a quarter of each age group’s vote). In contrast, the relationship between age and vote choice is much weaker for the Labour party, who win between 15-20% of each age group’s vote. Similar patterns were observed in the list vote, but with a few exceptions that are worth highlighting. The Greens, who largely do not stand candidates in the constituency ballot for most seats, have success squeezing the SNP vote on the list, perhaps pointing to the success of the Greens campaign encouraging split-ticket voting with the SNP. The 2021 Scottish Parliament Election 17
Figure 10a: Constituency vote choice by age group

Figure 10b: List vote choice by age group

In Figure 11 we look at the split of each party’s regional list vote by respondent sex. Although the pattern
is similar across the constituency vote we use the list vote as it allows us to examine support for the Green
party as well. Both the Conservative and Green vote was more reliant on men, with the SNP vote consisting
of markedly more women. There were not substantial differences in the Labour and Liberal Democrat vote
share across women and men.

18                                                                           The 2021 Scottish Parliament Election
Figure 11: Party list vote by respondent sex

Figures 12a and 12b report the party vote shares by education and constituency or list vote. Here we see
that Liberal Democrat support is higher among those with a university degree or senior secondary
qualifications. Labour support appears unrelated to education, with strongest support among those with
no qualifications, followed very closely by those with a university degree. SNP support is strongest among
those with a university degree and tails off slightly for each of the other groups but in each instance, support
exceeds 40%. Education effects appear strongest for Conservatives, where support is highest among
those with early secondary qualifications or no qualifications and lowest for those with a university degree.

Figure 12a: Constituency vote by level of education

The 2021 Scottish Parliament Election                                                                        19
When we turn to list votes, however, the opportunity to back the Green party has a clear effect not just on
SNP support, but the relationship between education and party vote. SNP support is strongest among
those with no formal qualifications and weakest among university graduates, in large part because those
with university degrees and senior secondary qualifications have backed the Green party. While SNP
support is much stronger than Green support, the education effects work in the opposite direction. For
university graduates, there is a fifteen-point gap between SNP and Green list support, but for those with
no formal qualifications, the gap is greater than 35 points. The effects for Labour, Liberal Democrats and
Conservatives, however, are broadly similar to what we saw with the constituency vote.

Figure 12b: List vote by level of education

On religion, figures 13a and 13b report the relationship between religion and constituency or list vote. The
patterns are similar across them, with SNP support greatest for those with no religion or who are Catholic,
and Conservative support strongest among Episcopalians and Presbyterians. These figures might well
reflect the fact that English-born Anglicans are more likely to attend the Episcopal church when in Scotland.
We see strongest support for Labour among Catholics. Both here, and for those with no religion, they are
the 2nd most popular party, but drop behind the SNP among the two religious denominations preferring
the Conservative party. The Liberal Democrats do not attract the support of more than 10% of adherents
of any religion (or none).9

9. The sample sizes of non-Christian religions in the SES preclude a robust analysis of the relationships to vote choice, and merging all non-Christian
groups together to greater a larger group would confuse rather than enlighten.

20                                                                                                            The 2021 Scottish Parliament Election
Figure 13a: Constituency vote by religion

With list vote, the same general patterns appear, the SNP preferred most by those with no religious
denomination or Catholics, Conservatives preferred by Presbyterian and Episcopalian voters. The arrival
of the Greens makes clear the party fares best among those with no religion and Episcopalians. It also
alters Labour fortunes. The relationship is largely as it was for the constituency vote among Catholics and
Presbyterians, where Labour is second and third most popular respectively. Among those with no religion,
however, they drop from second to fourth, behind the Conservatives and Greens. A parallel drop occurs
among Episcopalians.

Figure 13b: List vote by religion

The 2021 Scottish Parliament Election                                                                   21
Figures 14a and 14b illustrate the relationship between social grade and constituency or list vote. Here we
see SNP support dropping slightly as social grades move from DE to AB. Contrary to the pattern we saw
with education, the arrival of the Greens on the list vote exacerbates rather than reverse the relationship
between social grade and SNP support. We see opposite effects for SNP and Green support, with support
weakest for the SNP and strongest for the Greens among social grade AB and strongest for the SNP and
weakest for the Greens among social grade DE. Pro-independence voters vary in their propensity to
support the different pro-independence parties and partly this is explained by education and social grade.
Labour, once able to draw on strong support among social grades DE and C2, sees minimal differences
in support across the four social grades. If party support can erode because leaders or policies come out
of favour or if the party loses its natural social base, then these results suggest that the social base
argument is part of the challenge facing Labour in Scotland.

Figure 14a: Constituency vote by social grade

22                                                                          The 2021 Scottish Parliament Election
Figure 14b: List vote by social grade

The relationship between place of birth and vote choice is displayed in figures 15a and 15b. Among those
born in Scotland (most of the sample) nearly half (47%) cast their constituency ballot for the SNP, with the
Conservatives and Labour each winning roughly 1 in 5 votes from this group. The SNP also dominated in
the constituency ballot of voters born outside of the UK, winning more than half of this group’s vote. The
SNP did worst among those born in England, although it still won a plurality of this group’s vote in the
constituency ballot.

Figure 15a: Constituency vote by place of birth

The 2021 Scottish Parliament Election                                                                     23
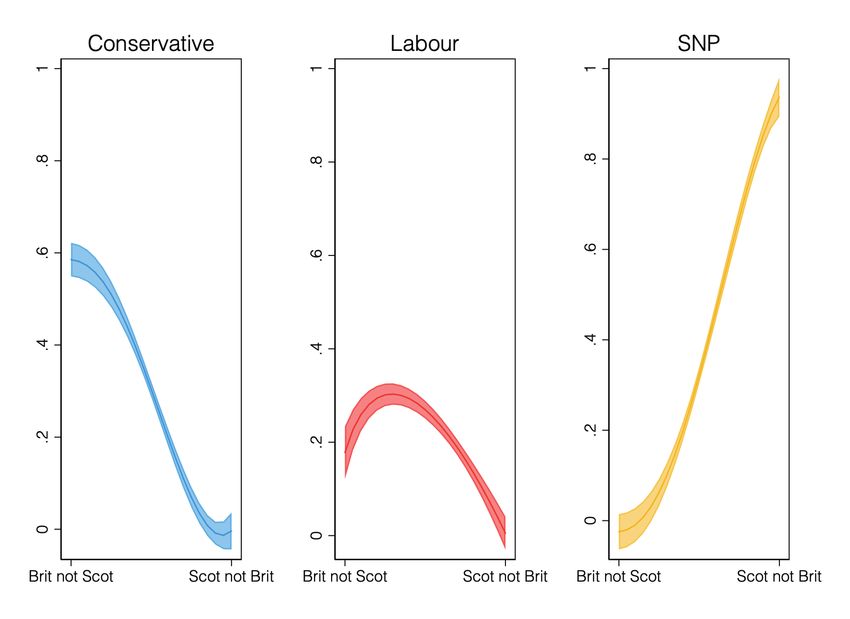
These general patterns mirror Yes support in 2014, with support highest among Scottish-born voters and
lowest among those born in the rest of the UK. The difference is that the level of support is higher now, and
that in a multi-party system the pro-independence SNP won more than half the vote among new Scots
born outside the nation. On the list vote, those same voters were most likely of the demographic groups
to back the Green party. Across both ballots, Conservative support is shored up by those born in England.

Figure 15b: List vote by place of birth

National Identity
National identity has long been shown to play a central role in Scottish politics. In a nation where so many
people feel Scottish that identity label is less helpful for discriminating among voters. Instead, the relative
attachment voters feel to two different identities - Scottishness and Britishness – helps us to understand
voting behaviour. We therefore use a relative territorial identity constructed from the two 0-10 Scottishness
and Britishness scales. By subtracting an individual’s Britishness score from their Scottishness score, we
are left with a measure of how Scottish they feel relative to how British they feel.

Figure 16 shows the relationship between constituency vote choice and this relative identity.10 The
relationship for each party is different. For the Conservatives and the SNP, the relationships are close to a
mirror image. Both parties win a very high (indeed extremely high in the case of the SNP) proportion of the
vote at the extremes of this identity spectrum. The Conservatives do very well among voters who feel very
British but not Scottish but gain almost no support from those who feel very Scottish but not British. For
the SNP, they win almost no support from voters who feel very British but not Scottish but win the support
of nearly everyone who feels very Scottish but not British. For the Labour party, they do best among voters
who feel more British than Scottish but still have some attachment to Scottish identity as well as amongst
people who feel equally Scottish and British. Like the Conservatives they have very little support among
voters who feel Scottish and not British.

10. Each panel is relationship between RTI and a binary variable where 1 is casting a constituency ballot for the Conservatives, and 0 if they voted for
anyone else.

24                                                                                                             The 2021 Scottish Parliament Election
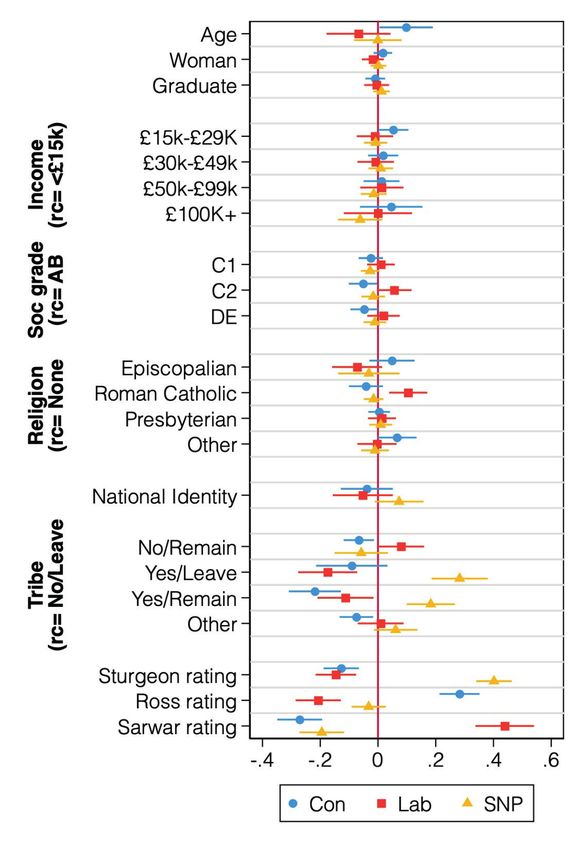
Figure 16: Probability of voting Con/Lab/SNP in Constituency by Relative Territorial Identity

Multivariate Models
Of course, it is one thing to look at each of these characteristics and opinions in isolation and another to
examine their strength as a predictor of the vote in relation to each other. What is the relative importance
of each of these possible facets on vote choice in 2021? To answer this, we present two sets of models
with constituency and regional list choice as the outcome variable.11 We focus on the three largest parties
in the constituency vote – the SNP, Labour, and the Conservatives12 – and four largest parties in the regional
list vote – the SNP, Labour, the Conservatives, and the Greens.13

As explanatory variables, we look at a range of influences across the traditional ‘funnel of causality’ for
voting. These include demographic and socio-economic predictors, including those examined above
such as age, gender, education, social grade, and religion. We also examine measures of attachment to
different communities, including relative territorial/national identity, as well as constitutional tribe. We include
various measures to capture political attitudes, including constitutional preferences, evaluations of leaders
and whether a voter thought the parties supported Scottish interests. Figure 16a plots the marginal effects
from the constituency vote model and Figure 16b the list vote model. The different colours represent
different parties: red (Labour), gold (SNP), blue (Conservative) and green (Greens). Symbols on the right
of the graph mean one is more likely to vote for the party. Symbols on the left of the graph mean one is
less likely to vote for that party. As we will see, rather a lot are clustered near the midpoint, which suggests
they do not offer much explanatory power for understanding vote choice.

Focusing first on socio-demographic variables we see that both education and age are associated with
11. These are multinomial regressions in which we control for the impact of different predictor variables on constituency and list vote. Figures presented
display the marginal effects of individual variables.

12. Who together achieved 91.2% of the constituency vote

13. Who together achieved 89.9% of the regional vote.

The 2021 Scottish Parliament Election                                                                                                                    25
vote choice. In the constituency vote, older voters were more likely to vote for the Conservative party
(compared to Labour and the SNP). In the list vote, age was no longer a dividing factor between the ‘big
three’ parties, but younger voters were more likely to cast their ballot for the Greens. Voters with university
degrees were also more likely to vote for the Greens in their list vote.

It’s also worth focusing on the variables for which there were no significant effects. National identity, long
an important predictor of political behaviour and attitudes in Scottish politics, did not appear to shape
constituency vote choice in 2021, although there is a negative effect for the Conservative in the list (indicating
that more Scottish/less British voters were less likely to vote for them). This is likely explained by two
phenomena. First, we know that rather a lot of the Scottish population prioritises its Scottish identity over
its British identity. In a context where many people feel Scottish it is a less discriminating predictor of vote
choice. Second, we know that there is a strong relationship between constitutional preferences and national
identity. It is therefore likely that national identity played a more indirect role in shaping vote choice.

We now turn to constitutional tribes, where we see clear and substantial relationships with vote choice. In
theconstituency vote, Yes/Leavers and Yes/Remainers were considerably more likely to vote for the SNP
and less likely to vote either Conservative compared to No/Leavers. The same pattern is present Figure
16b too, but with the additions of Yes/Remainers also more likely to vote for the Greens. We also see a level
of differentiation among the main pro-union parties, with No/Remainers more likely to vote for Labour
compared to No/Leavers, suggesting that Brexit preferences play a role in structuring the pro-union vote.

Figure 16a: Marginal effects for constituency vote choice

26                                                                               The 2021 Scottish Parliament Election
Figure 16b: Marginal effects for list vote choice

Finally, the variables which have the most substantial effects of vote choice are the ratings of party leaders.
It is to be expected that these variables have the most explanatory power due to their proximity to vote
choice in the ‘funnel of causality’,14 and indeed may themselves be influenced to some extent by vote
choice, serving as post-hoc rationalisations for partisan preferences.

All effects work in the expected direction (e.g. those who like Sarwar more likely to vote Labour and less
likely to vote SNP and Conservative), with particularly large effects for Sturgeon’s leader ratings. As Sturgeon
is the best-known Scottish politician by some margin, substantially more respondents gave ratings at the
extremes of the 0-10 scale compared to Douglas Ross and Anas Sarwar who still had relatively low profiles
at this time.

14. The funnel of causality is a way of thinking about the influence of various factors on vote choice over time (Campbell et al., 1960). Demographics and
identities we acquire at birth or at a young age appear far back in the funnel, while contemporary factors like the issues at a given election and leader
image appear at the front of the funnel. Factors further back in the funnel are argued to have an influence on how we approach factors later on in the
funnel.

The 2021 Scottish Parliament Election                                                                                                                  27
5. The Result and Aftermath

In many ways, the 2021 election held little excitement. As Table 3 shows, the results for the major parties
are all within a few seats of the results they had in 2016, and so one could be forgiven for thinking that this
offers something of a steady state. There are four reasons why this would be a mistake.

Table 3: Results of the 2021 Scottish Parliament Election

                      Constituencies (Change)          Regional Lists (Change)                  Overall (Change)

                      Vote %            Seats          Vote %            Seats                  Seats

 SNP                  48 (+1)           62 (+3)        40 (-1)           2 (-2)                 64 (+1)

 Conservatives        22 (nc)           5 (-2)         23 (+1)           26 (+2)                31 (nc)

 Labour               22 (-1)           2 (-1)         18 (-1)           20 (-1)                22 (-2)

 Scottish Greens      1 (+1)            0 (nc)         8 (+2)             8 (+2)                8 (+2)

 Lib Dems             7 (-1)            4 (nc)         5 (nc)             0 (-1)                4 (-1)

 Alba                                                  2 (+2)             0 (nc)                0 (nc)

 Others               1 (nc)                           3 (-1)             0 (nc)                0 (nc)

First, aside from the issues that interest us as observers of political attitudes and behaviour there are other
noteworthy features of the 2021 results. The election returned a record number of women as MSPs.
Reversing a trend of stagnation or decline since 2003 in women’s representation in the chamber. This was
achieved partly by the replacement of retiring incumbent MSPs with female candidates by the SNP and
the Labour Party zipping lists between women and men for regional seats. As a result, over half of SNP
(53%) and Green (65%) MSPs are women, as are 45% of Labour MSPs. The two parties who take a less
active role in ensuring their candidates fit the broader profile of society have far fewer female MSPs (one
of four for the Liberal Democrats, and 26% for Conservatives). Give n this, better gender representation is
obviously linked to the electoral fortunes of specific parties. The 2021 cohort of MSPs also includes six
ethnic minority representatives as well as the Parliament’s first minority ethnic woman, the SNP’s Kaukab
Stewart, who stood against Donald Dewar in the first election to the Scottish Parliament. The parliament,
in gender and ethnicity, now better resembles the electorate though historic imbalances remain.

Second, all eyes were on whether the SNP would achieve a majority of seats, a large ask given a semi-
proportional electoral system that was not supposed to deliver the false majorities one typically finds in first
past the post elections. While the SNP fell one seat short of a majority they negotiated a cooperation
agreement with the Scottish Greens, giving Greens ministerial level appointments, while broadly confirming

28                                                                                 The 2021 Scottish Parliament Election
support for the SNP’s agenda.15 This marks a first for a party that shares similar constitutional views to the SNP but has its own agenda on environmental issues. This cooperation agreement is important in part for what might have been. Alba was led by a former First Minister who found himself the subject of sexual misconduct allegations in a saga that many pollsters framed as a battle of trustworthiness and competence between the current head of the SNP and its former head. But within the nationalists, it also signified a contest between those who wish a much more assertive approach to independence (e.g., Salmond & Alba) and those who advocate for a more gradualist approach (e.g., Sturgeon & the moderate wing of the SNP). Polling before the election showed that the vast majority of voters resolutely supported Nicola Sturgeon over Alex Salmond. Indeed, while Sturgeon garnered approval ratings above 50%, Alex Salmond barely scraped double digits and was less popular in Scotland than the high unpopular Conservative Prime Minister Boris Johnson.16 As such, Alba’s more impatient stance on independence appears to have been seen off by the First Minister, helped in part by her high personal credibility ratings with voters. This suggests that the SNP has emerged not just with enhanced control over Holyrood but enhanced clout among its internal critics, who doubted its more cautious approach to referendum timing. This should not suggest a life free of conflict. The new partnership raises the prospect of possible tensions between the SNP and Greens and specifically allows for the Greens to vote against the SNP on areas in which the two parties have “agreed to differ.”17 Third, the dominance of pro-independence MSPs in the house means that the government can claim it has a mandate for one of its central manifesto pledges, namely a second independence referendum. So goes the claim, and our data suggest that this is both anticipated by voters (32% of whom believe a referendum is much more likely, and a further 41% of whom believe it is somewhat more likely). It also appears to be supported by voters, who believe that if a second referendum is to happen it should be a Scottish Government that calls it. This is of course a separate issue from any appetite for another referendum. In terms of the electorate as a whole, one third (32%) say they never want another referendum, but a majority want one at some point. This includes 15% who want one in the next ten years, 16% who want one within five years, 22% who want one within the first half of the SNP’s term in office, and 9% who want one ‘as soon as possible’. In terms of support for holding a referendum within the lifetime of this parliament, 49.7% of those who expressed a view want one. Which means that 50.3% of those with a view do not relish another referendum in the next five years. And of course, those more hesitant to see a referendum include those who want to wait until the chances of winning one are higher, and those who want to see it off if possible to avoid feared disruption. Rather a difficult electorate to govern. Fourth and finally, the high level of tactical voting demonstrates that there is a degree of volatility in the Scottish electorate, with supporters of the SNP and Greens choosing the party for its policies and leaders, and supporters of pro-union parties motivated by a wider range of factors. When we asked these voters to describe in their own words how they decided who to vote for on election day, the most frequently cited 15. The Greens have reserved the right to vote against the SNP Government on matters of principle. See: https://digitalpublications.parliament.scot/ ResearchBriefings/Report/2021/9/29/951cd002-5c86-4f58-912d-09652cdc6cea 16. For example, see https://www.sundaypost.com/fp/scottish-election-poll/ 17. We have analysed the attitudes of SNP, Alba and Green voters on our website and this points to particular faultlines for the coalition partners. See here: http://scottishelections.ac.uk/2021/09/17/twindependence-day-are-there-electoral-risks-in-the-snp-scottish-green-deal/ The 2021 Scottish Parliament Election 29
word for each of Labour, the Liberal Democrats and the Conservatives was ‘SNP’. This is, then, a volatile
electorate, but one where volatility is concentrated on one side of one constitutional issue. This also
demonstrates that the Scottish electorate is, after five previous elections, coming to understand the system
rather better and learning how it can be used tactically to support pro-pro-union (or independence) parties.

30                                                                          The 2021 Scottish Parliament Election
You can also read