Text-Based Insights into Stock Market Behavior - Steven J. Davis University of California, Berkeley
←
→
Page content transcription
If your browser does not render page correctly, please read the page content below
Text-Based Insights into
 Stock Market Behavior
          Steven J. Davis
    University of California, Berkeley
              24 April 2018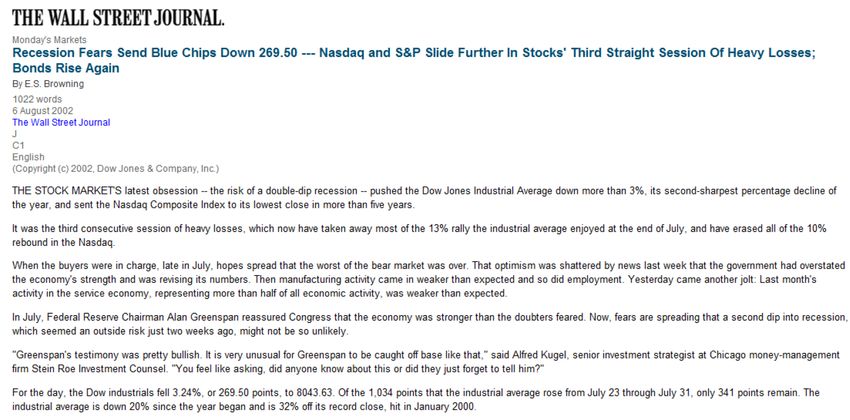
Text-as-data and text-based methods have
emerged as major tools of analysis in
accounting, finance and economics.
Today’s talk draws on two papers underway to
develop new insights into stock market behavior
• “Diagnosing the Stock Market’s Reaction to Trump’s
  Surprise Election Victory,” with Cristhian Seminario
   – Automated readings of 61,000 10-K filings
• “What Triggers Stock Market Jumps?” with Scott
  Baker, Nick Bloom and Marco Sammon
   – Human readings of newspaper articles about a few
     thousand jumps in national equity markets across
     14 countries, plus a few hundred jumps in U.K. and
     U.S. bond markets and US$ currency markets.       2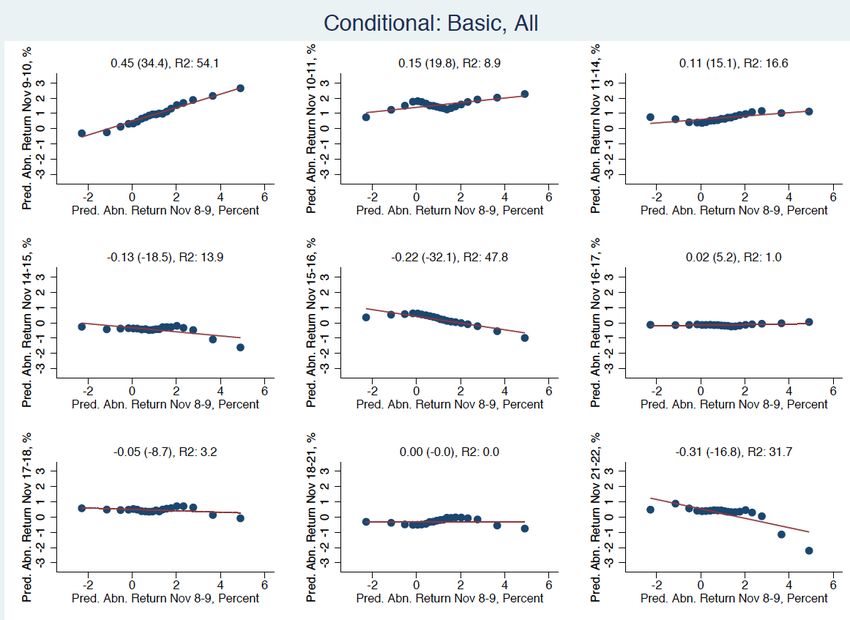
Diagnosing the Stock Market
Reaction to Trump’s Surprise
      Election Victory
  Steven J. Davis (Chicago Booth & Hoover)
     Cristhian Seminario (U of Chicago)

                   2018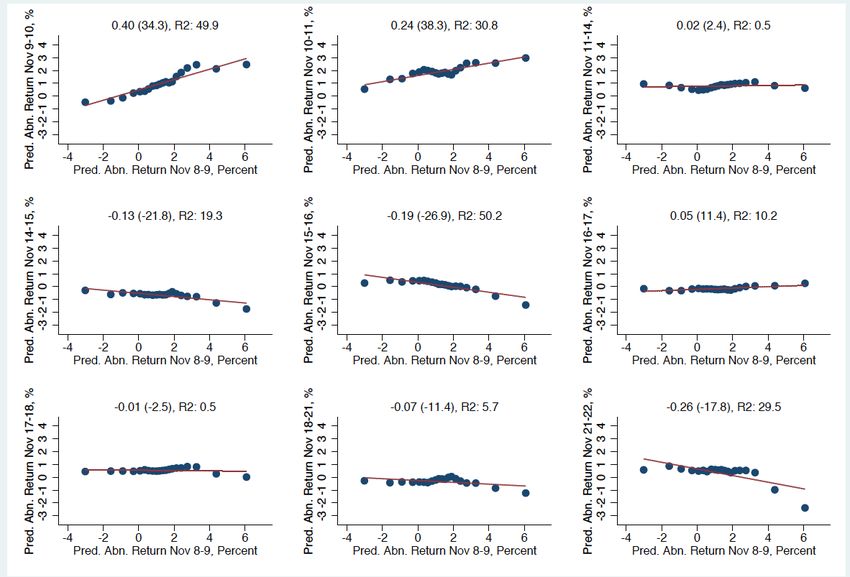
Noon on Election Day!

Washington (CNN) Hillary Clinton's odds of
winning the presidency rose from 78% last week
to 91% Monday before Election Day, according
to CNN's Political Prediction Market.

       But Trump won!!
Initially, stocks fell sharply in after-hours trading

From “Markets Sent a Strong Signal on Trump … Then Changed Their Minds,” Justin
Wolfers, New York Times, 18 November 2016

But Stocks Boomed on 9 November
Histogram of Daily Market Returns, U.S. Stocks
    Sample Period: 8 November 2016 +/- 360 Days

                                               Trump Election
                              Trump Election
  Using
  Closing
  Prices
… Confounding Prominent Economists

Justin Wolfers, New York Times, 18 November
2016: “Throughout the campaign, stocks rose
whenever campaign developments made it
less likely that Mr. Trump would be elected.”

This assessment rests on Wolfers’ pre-election
empirical study with Erik Zitzewitz. Their
bottom line: “[W]e estimate that market
participants believe that a Trump victory would
reduce the value of the S&P 500, the UK, and
Asian stock markets by 10-15%.”

Our Approach: Examine the Cross-
Section of Abnormal Equity Returns
in Reaction to Trump’s Victory
1. Trump and Clinton were far apart on many policy
   issues: regulation, healthcare, trade, etc. Not a
   Tweedledee vs. Tweedledum election!!
2. Firms differ in their exposures to policy risks.
3. Quantify these risks using Part 1a (“Risk
   Factors”) of listed firms’ annual 10-K filings.
4. Trump’s surprise victory abruptly shifted the level
   and structure of important policy risks.
5. We look to the cross-section of firm-level returns
   to assess the effects of that shift and gain insight
   into the market’s reaction to Trump’s win.

The Cross-Firm Dispersion of Abnormal Returns
 Was Very High in the Wake of Trump’s Victory
Histogram of Cross-Firm St. Dev. of Daily Abnormal Returns
      Sample Period: 8 November 2016 +/- 360 Days
                Abnormal (CAPM)

                                       Trump Election

                                                        Trump Election
                returns based on
                data for 360 days
                before the election.
Histogram of Interquartile Range of
Abnormal Daily Returns Across Firms
Sample Period: 8 November 2016 +/- 360 Days

                                 Trump Election

                                                  Trump Election
Analysis Sample • Common equity securities (primary issue) traded on AMEX, NYSE and NASDAQ of firms incorporated in the United States, with prices quoted in U.S. Dollars. • Daily closing prices, shares outstanding and shares traded from Compustat North America, with adjustments for stock splits, reverse splits, dividends, etc. Market return data from Ken French’s website. • Sample period: ±360 calendar days from Nov 8, 2016 • 3,606 firms with closing prices on 8 and 9 November. • Matched to 3,383 firms with at least one 10-K filing (with non-empty Part 1a) from January 2006 to July 2016. – Part 1a is not obligatory for all listed firms. • Drop 102 firms with no NAICS code. Drop 20 with fewer than 126 daily return observations in pre-election window. • 3,261 firms in the final sample. – About 1.5 million daily return observations 11
Part 1A of the 10-Ks
• Since 2006 (for FY 2005) the SEC requires most publicly
  held firms to include a separate discussion of “Risk Factors”
  in Part 1a of their annual 10-K filings.
• In explaining “How to Read a 10-K” at
  www.sec.gov/answers/reada10k.htm, the SEC describes
  Part 1a as follows:
   – Item 1A - “Risk Factors” includes information about the
     most significant risks that apply to the company or to its
     securities. Companies generally list the risk factors in
     order of their importance. In practice, this section focuses
     on the risks themselves, not how the company addresses
     those risks. Some risks may be true for the entire
     economy, some may apply only to the company’s industry
     sector or geographic region, and some may be unique to
     the company.                                              12
How We Use the 10-Ks
1. Develop term sets that correspond to various policy risk
categories. Examples:
– Healthcare Policy
– Food and Drug Policy
– Environmental and Energy Regulation
– Trade and Exchange Rate Policy
– Various tax policy categories
– Government Spending and Fiscal Stabilization Policy
2. For each 10-K filing – and each term set – calculate the
percentage of sentences in Part 1a with one or more
terms in the set.
3. Average the percentage over available years for each firm
and term set to get our risk exposure measures.
13A Warm-Up Investigation
1. For each 10-K filing with a non-empty Part 1a:
– Calculate the percentage of sentences in Part 1a
that contains “regulation,” “regulate” or “regulatory.”
– Average this percentage over years for each firm.
2. This average value is our measure of Raw Regulation
(Risk) Exposure for the firm.
3. Compute the firm’s daily return as 100 X log change in
the closing price from November 8 to November 9.
4. Obtain the CAPM abnormal return for each firm from
November 8 to 9.
5. Relate Raw Regulation Exposure to abnormal equity
returns in reaction to Trump’s surprise election victory.
6. Plot the firm’s daily return against its Raw Regulation
Exposure.
14Firms with greater exposure to regulatory risks
had higher abnormal returns on 9 November
The estimated cross-sectional effect is large:
Multiplying the slope coefficient by the IQR of
the Raw Regulation Exposure measure (7.6
percentage points) implies a daily return
differential of 1.2 percentage points.
Abnormal Returns from 8-9 Nov:
Mean Firm-Level Daily Return: 1.1%
IQR of Daily Returns: 4.4%Extending the Measurement Method
mean (%) IQR (%)
Variable N % >0 max (%)
All >0 All >0
Raw Regulation 3281 99.6 8.6 8.6 7.6 7.6 57.7
Food and Drug Policy 3281 22.0 1.2 5.6 0.0 7.2 43.3
Trade and Exchange Rate Policy 3281 56.2 0.6 1.1 0.8 1.1 17.1
Government Purchases and Fiscal Policy 3281 28.3 0.1 0.4 0.1 0.3 15.9
Entitlement and Welfare Programs 3281 11.5 0.0 0.2 0.0 0.2 2.1
Government-Sponsored Enterprises 3281 10.7 0.2 1.8 0.0 2.1 18.5
Labor Regulation 3281 37.8 0.2 0.5 0.2 0.5 8.3
Financial Regulation 3281 47.1 1.2 2.6 0.4 2.6 33.5
Intellectual Property Policy 3281 23.9 0.1 0.4 0.0 0.4 6.5
Monetary Policy 3281 23.5 0.3 1.5 0.0 2.0 18.5
Taxes on Business Profits 3281 14.8 0.0 0.3 0.0 0.3 2.9
Business Tax Credits 3281 5.5 0.0 0.2 0.0 0.2 3.0
Sales and Excise Taxes 3281 22.9 0.1 0.5 0.0 0.5 22.4
Generic Tax Terms 3281 92.3 2.2 2.4 2.6 2.5 32.3
Healthcare Policy 3281 31.8 0.8 2.4 0.2 2.5 42.1
Healthcare Industries 453 54.1 2.9 5.4 3.3 6.5 27.4
Other Industries 2828 28.2 0.4 1.5 0.1 1.9 42.1
Energy and Environmental Regulations 3281 24.7 0.6 2.4 0.0 3.0 16.8
Green Sectors (BLS Designations) 810 29.8 0.7 2.4 0.2 2.6 16.8
Brown Sectors 2471 23.1 0.5 2.4 0.0 3.1 16.8Example: The Term Set for
Energy & Environmental Regulation
Energy And Environmental Regulation: {energy policy},
{energy tax, carbon tax}, {cap and trade}, {cap and tax},
{drilling restrictions}, {offshore drilling}, {pollution controls,
environmental restrictions, clean air act, clean water act},
{environmental protection agency, epa}, {wetlands
protection}, {Federal Energy Regulatory Commission,
FERC}, {ethanol subsidy, ethanol tax credit, ethanol credit,
ethanol tax rebate, ethanol mandate, biofuel tax credit,
biofuel producer tax credit}, {corporate average fuel
economy, CAFE standard}, {endangered species},
{Keystone pipeline}, {Alaska oil pipeline, Trans-Alaska
pipeline}, {greenhouse gas regulation, climate change
regulation}, {Nuclear Regulatory Commission}, {Pipeline
and Hazardous Materials Safety Administration}Our Basic Firm-Level Abnormal Return Regression
Dependent Variable: Daily Abnormal Equity Coefficient Times IQR
Return from November 8 to 9 Coeff. (t-stat) IQR|All IQR|Exposure>0
Raw Regulation 8.0 (4.3) 0.6 0.6
Food and Drug Policy 25.5 (5.1) 0.0 1.8
Trade and Exchange Rate Policy -11.8 (-1.9) -0.1 -0.1
Government Purchases and Fiscal Policy 79.2 (4.1) 0.0 0.3
Entitlement and Welfare Programs -156.5 (-1.5) 0.0 -0.3
Government-Sponsored Enterprises -19.9 (-5.3) 0.0 -0.4
Labor Regulation 39.5 (3.2) 0.1 0.2
Financial Regulation 2.7 (1.2) 0.0 0.1
Intellectual Property Policy 68.4 (2.2) 0.0 0.2
Monetary Policy 5.3 (0.7) 0.0 0.1
Taxes on Business Profits 39.6 (1.0) 0.0 0.1
Business Tax Credits -166.2 (-1.7) 0.0 -0.3
Sales and Excise Taxes -26.3 (-1.8) 0.0 -0.1
Generic Tax Terms -10.8 (-3.3) -0.3 -0.3
Healthcare Industries (Dummy) -1.6 (-5.5)
Healthcare Policy # Healthcare Industries -17.3 (-2.3) -0.6 -1.1
Healthcare Policy # Other Industries -0.7 (-0.1) 0.0 0.0
Green Sector (Dummy) -0.8 (-4.0)
Energy & Environ. Regs # Green Sector -35.4 (-5.5) -0.1 -0.9
Energy & Environ Regs # Brown Sector 4.4 (0.9) 0.0 0.1 18
Observations: 3261 Adjusted R-Squared: 11.2%Dependent Variable: Daily Abnormal Dropping Firms Not Russell 3000 +
Equity Return from November 8 to 9 In Russell 3000 Leverage Control
Raw Regulation 8.5 (4.0) 7.9 (3.8)
Food and Drug Policy 32.6 (5.1) 34.5 (5.2)
Trade and Exchange Rate Policy -14.9 (-2.2) -16.0 (-2.3)
Government Purchases and Fiscal Policy 113.5 (5.1) 116.9 (5.3)
Entitlement and Welfare Programs -335.1 (-2.5) -318.2 (-2.7)
Government-Sponsored Enterprises -24.3 (-5.8) -20.8 (-4.7)
Labor Regulation 40.8 (3.4) 43.2 (3.6)
Financial Regulation 0.7 (0.3) -0.4 (-0.2)
Intellectual Property Policy 136.4 (2.6) 123.8 (2.3)
Monetary Policy 11.8 (1.4) 10.0 (1.2)
Taxes on Business Profits 53.8 (1.4) 62.2 (1.6)
Business Tax Credits -183.0 (-2.0) -194.7 (-2.1)
Sales and Excise Taxes -34.0 (-2.3) -36.2 (-2.5)
Generic Tax Terms -17.6 (-4.5) -16.1 (-4.2)
Healthcare Industries (Dummy) -2.0 (-6.9) -2.0 (-6.9)
Healthcare Policy # Healthcare Industries -20.6 (-2.5) -20.9 (-2.6)
Healthcare Policy # Other Industries -5.1 (-0.4) -18.9 (-1.3)
Green Sector (Dummy) -0.9 (-4.2) -1.0 (-4.8)
Energy & Environ. Regs # Green Sector -38.5 (-5.9) -35.5 (-5.6)
Energy & Environ Regs # Brown Sector -6.3 (-0.9) -4.5 (-0.7)
Leverage (long-term debt + short-term liabilities)/Assets in FY 2015 -1.2 (-2.9)
19
Observations (Adjusted R-Squared, %) 2384 (19.5%) 2371 (19.9%)Next Few Slides: Partial Regression Scatter
Plots for Our Basic Specification and Sample
Residualized values, binned on
variable on horizontal axis,
controlling for other regressors.Coefficient (t-stat) on Healthcare Industry Dummy: -1.6 (-5.5)
Coefficient (t-stat) on Green
Industry Dummy: -0.8 (-4.0).
BLS Green designations.
Firm-Level Abnormal Returns Moved Strongly in
 the Same Direction on November 10, 11 and 14
Russell 3000 Sample Shows a Similar Pattern
A Similar Return Structure on Other Days? No
                         Our Basic Abnormal Returns Regression, Dropping Firms Not in Russell 3000
Dependent Variable: Daily                                   Average Results For Average Results for Average Results for
                                             9 Nov 2016
Firm-Level Abnormal Return                                     Prior 360 days      3 Largest Gains   3 Largest Drops
          Abnormal Return: Mean (IQR)          1.3 (4.4)          -0.0 (1.8)           -0.0 (2.5)        -0.3 (2.8)
               Equity Return: Mean (IQR)       3.0 (4.7)           0.0 (1.9)            2.5 (2.7)        -3.6 (3.5)
Raw Regulation                                  8.5 (4.0)          -0.1 (-0.1)          -0.3 (-0.2)       -0.9 (-0.7)
Food and Drug Policy                          32.6 (5.1)           -1.2 (-0.3)          -5.0 (-1.7)       -3.9 (-1.0)
Trade & Exch. Rate Policy                    -14.9 (-2.2)           0.4 (0.1)           -3.5 (-1.0)       -7.2 (-1.2)
Govt. Purch. & Fiscal Policy                 113.5 (5.1)            1.0 (0.1)         -10.8 (-0.8)        -6.9 (-0.4)
Entitlement & Welfare                       -335.1 (-2.5)           2.7 (0.1)           -1.9 (-0.1)      20.1 (0.4)
GSEs and Related                             -24.3 (-5.8)           0.4 (0.1)            5.6 (1.3)         4.3 (0.9)
Labor Regulation                              40.8 (3.4)           -0.7 (-0.0)           1.4 (-0.2)       -1.8 (-0.4)
Financial Regulation                            0.7 (0.3)           0.1 (0.2)           -7.0 (-3.3)       -4.3 (-1.8)
Intellectual Property Policy                 136.4 (2.6)           -2.7 (-0.1)        -16.1 (-0.3)      -17.2 (-0.5)
Monetary Policy                               11.8 (1.4)            0.7 (0.1)           -9.6 (-1.8)       -3.6 (-0.3)
Taxes on Business Profits                     53.8 (1.4)           -1.2 (-0.0)           5.9 (0.3)       39.1 (1.9)
Business Tax Credits                        -183.0 (-2.0)          -2.0 (-0.0)        -21.1 (-0.4)       19.1 (0.4)
Sales and Excise Taxes                       -34.0 (-2.3)           2.3 (0.2)          11.0 (1.6)        18.1 (1.6)
Generic Tax Terms                            -17.6 (-4.5)           0.0 (0.0)            4.0 (1.1)        -0.2 (-0.1)
Healthcare Ind. (Dummy)                        -2.0 (-6.9)          0.0 (0.1)            0.0 (0.2)         0.6 (3.7)
HC Policy # HC Industry                      -20.6 (-2.5)          -0.2 (-0.1)          -0.8 (-0.4)       -0.9 (-0.6)
HC Policy # Other Industries                   -5.1 (-0.4)         -0.4 (-0.1)           2.3 (0.8)         2.1 (0.6)
Green Sector (Dummy)                           -0.9 (-4.2)          0.0 (0.1)            0.2 (1.3)        -0.1 (-1.1)
E&E Regs # Green Sector                      -38.5 (-5.9)           0.9 (0.3)            5.6 (1.6)       19.8 (6.3)
E&E Regs # Brown Sector                        -6.3 (-0.9)          0.4 (-0.1)         13.8 (2.1)          9.3 (1.7)
Observations (Adj-R2)                        2384 (19.5)         2380 (6.3)           2376 (4.7)        2380 (7.5)
Taking Stock (Tentative)
1. The surprise election outcome triggered a large,
positive stock market response on 9 November 2016,
strongly contradicting pre-election assessments of the
likely market response to a Trump victory.
2. The structure of firm-level equity returns on 9 November
was highly dispersed, highly unusual, and clearly tied to
firm-level policy risk exposures, as derived from 10Ks.
– Firms with high exposures to regulatory risks saw
especially high equity returns on 9 November, except
for those reliant on “green” subsidies.
– Healthcare delivery firms and those with high
exposures to healthcare policy risks fared poorly in
relative terms and, in some case, in absolute terms.– High exposure to risks associated with Trade Policy,
Entitlement and Welfare Programs, and Government-
Sponsored Enterprises involved lower returns.
– High exposure to risks associated with Labor
Regulation, Food and Drug Policy, and IP Policy
involved higher returns.
3. The stock market did not fully digest the implications of the
election outcome by market close on 9 November.
– Instead, (conditional) firm-level abnormal returns over
the next 2-3 days strongly reinforced the initial market
response to the election surprise.
– The shift in the structure of conditional firm-level
abnormal returns over 3-4 days after the election was
about 65% greater than the initial shift from market
close on 8 November to market close on 9 November.4. These results suggest that equity prices do not immediately
and fully adjust to surprise events that (a) involve unusual
shifts in the structure of price-relevant risks and (b) require
large information processing resources to fully assess.
– Human collection and processing of available
information is costly, and it takes time. Thus, the surprise
realization of events that satisfy (a) and (b) need not be
fully and immediately incorporated into equity prices.
– This interpretation calls for study of other major surprise
events that meet conditions (a) and (b).
• Do they also involve a slow-working multi-day
response in the structure of firm-level equity returns?
• When (a) or (b) fails, do we instead see rapid
responses in the structure of firm-level equity returns?5. Asset price responses to prediction-market probability
changes are unreliable guides to the actual price effects
of major surprise outcomes, if they materialize, when
conditions (a) and (b) hold.
– Put more positively, asset price responses to shifts in
the probability of future outcomes are more reliable
when (^a) the prospective event involves a common,
well-understood shift in the structure of price-relevant
risks, and/or (^b) modest information processing
resources are sufficient to assess the pricing
implications of the prospective event.Some Next Steps
1. Improve our term sets and firm-level characterizations:
– Further parse instances of generic Regulation
– Tax policy: develop better term sets and code that
allocates “generic” tax terms
– Trade policy: distinguish among exporters, import-
competing and supply-chain dependent firms.
– Financial regulation: We find little here – a deficiency
in our Financial Regulation term set?
2. Examine firm-level returns on Wolfers-Zitzewitz dates:
– Initial work suggests that “signal” associated with
these episodes is too weak to say much.
3. Compare to Wagner, Zeckhauser and Ziegler papers:
– They take a different approach, consider a smaller
sample, and focus on tax considerations.What Triggers Stock Market Mumps?
Scott R. Baker (Kellogg, Northwestern)
Nick Bloom (Stanford)
Steven J. Davis (Chicago Booth and Hoover)
Marco Sammon (Kellogg, Northwestern)
2018Why does the stock market jump?
• Two broad views on what drives stock market moves:
– Eugene Fama: driven by discount rates, risk, dividends, etc.
– Robert Shiller: Hard to explain fully by fundamentals; narratives
develop and sometimes spread, affecting prices and returns.Why does the stock market jump? • We advance this discussion by considering several thousand large daily moves in national equity markets. • We read next-day newspaper accounts and record the journalist’s characterization of the jump.
How We Characterize Equity Market Jumps
1. Set daily jump threshold: Aim for about 1% of
   daily moves à |2.5%| for most countries.
2. Pull dates with market moves > threshold
3. Use newspaper articles to characterize jumps
  A. Go to online newspaper archive
  B. Enter newspaper, date range (next day) and search
     criteria (e.g., “stock market”)
  C. Select article
4. One or more humans read the article(s).
5. Record the reason for the jump, its geographic
   source, confidence of reporter in explanation,
   ease of coding for the reader, etc.              39
Jumps by Reason Template
Policy Categories Non-Policy Categories
Government spending Macroeconomic news & outlook
Taxes Corporate earnings & profits
Monetary policy & central banking Commodities
Trade & exchange rate policy Unknown/no explanation
Regulation (other than above) Foreign Stock Markets
Sovereign military & security Terrorist attacks & large-scale
actions violence by non-state actors
Other policy (specify) Other non-policy (specify)
40Preview of Selected Findings 1. Policy news is a major trigger of stock market jumps (according to newspapers) – Journalists attribute 40% of U.S. jumps to policy – More than Macro Outlook (27%) or Corporate Earnings (11%) – Policy share of jump attribution is smaller in most countries – Policy share rises with jump size 2. U.S. developments trigger a huge share of equity market jumps across the globe. – Excluding data for the United States, leading local newspapers attribute 34% of jumps in their national stock markets to developments that originate in the U.S. – The U.S. role in this regard dwarfs the role of Europe, China and other large regions and countries – U.S. role is especially pronounced during the GFC.
Preview of Selected Findings
3. The persistence of national equity
   return volatility varies by jump reason.
–    Jumps attributed to monetary policy exhibit much less post-
     jump return volatility.
4. The clarity of journalist perceptions as
   to jump reason varies among jumps
–    We quantify perception clarity in several ways.
5. Greater clarity about jump reason à
–    Lower intraday market volatility on the jump day
–    Lower volume on the jump day
–    Greater concentration of jump-day move in a short interval
–    Smaller jump-day gain in the VIX
100-Page Guidebook for Coders
More on the Coding Process
• Coders = authors and RAs
• Coders read article and record the jump
  reason, the geographic source of the jump-
  triggering news, journalist confidence about
  jump reason, and more.
• RA training process
• RA monitoring process
• We randomize the order in which RAs
  review jump days to avoid conflating coder-
  learning effects and calendar-time effects.
Selected Category Definitions
    and Examples from the
   Data Construction Guide
The examples on the next several slides give
an indication of how we provide guidance for
coding newspaper articles.

                                               45
Taxes
News reports, concerns or events related to current,
planned, or potential tax changes (e.g., income tax hikes,
payroll tax cuts, corporate tax reform, sales tax change,
etc.) and their consequences.
46Taxes, 2
This article is coded as Taxes
because it claims directly that if
anything could be cited as a reason
it would be the tax bill that was
passed. The confidence would be
medium to high because the article
spends some time discussing the
tax bill and claims that the bill was
almost certainly the reason, saying
if any one reason could be cited it
would be that one.
47Government Spending
News reports, forecasts, or concerns about
government spending and its consequences,
including spending matters related to stimulus
programs, publicly funded pensions, social
security, health care, etc.
48Government Spending, 2
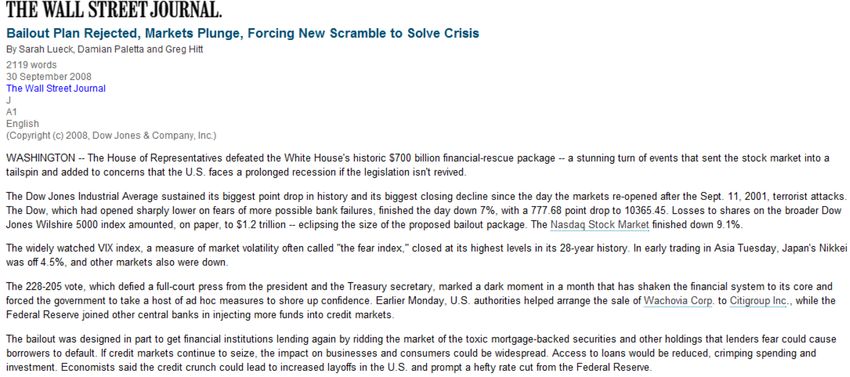
This article is coded as government spending because the first reason
listed for the stock market plunge is the rejection of the government’s
bailout plan. The bailout plan itself involves the government spending
money to help the economy, and even though it is a rejection of the plan, it
is still coded as government spending.
49Macroeconomic News and Outlook
News relating to macroeconomic forecasts or reports such
as inflation, housing prices, unemployment or employment,
personal income, industrial production, manufacturing
activity, etc.
Also included in this category:
• News about financial crisis developments that does not
fall into another category such as Monetary Policy and
Central Banking.
• Trade and exchange rate news NOT attributed to policy
(e.g., news about trade deficits or currency movements)
50Macroeconomic News and Outlook, 2
This article claims that the reason for the market move was a fear of a double-dip
recession, a change in the Macroeconomic Outlook. Therefore the article would be
coded as Macroeconomic News and Outlook. The confidence would be high because
the article clearly declares that the fear of recession was the cause for the movement.
51Monetary Policy and Central
Banking
Actions, possible actions, and concerns related to the
conduct and policies of the central bank or other chief
monetary authority. Such actions and policies pertain to
interest rate changes and monetary policy
announcements, inflation control, liquidity injections by the
monetary authority, changes in reserve requirements or
other bank regulations used by the monetary authority to
exercise control over monetary conditions, lender-of-last
resort actions, and extraordinary actions by the monetary
authority in response to bank runs, systemic financial crisis
and threats to the payments system.
52Monetary Policy and Central
Banking 2
This article is coded as Monetary
Policy because it cites the reason for
the market rally as a statement from
the Fed that they will pay less
attention to weekly swings in the
monetary supply, a change in their
policy. The confidence and ease of
coding would also be high because
the article clearly claims the Fed
statement is the reason for the jump.
53Distinguishing Monetary Policy &
Central Banking from Macroeconomic
News & Outlook
Some news articles that discuss market reactions to macro
developments also discuss the Fed’s normal response to the
macro development. Generally, we code an article as Macro
News & Outlook if it attributes the market move to news
about the macro economy. We code it as Monetary Policy &
Central Banking if the article attributes the market move to
(a) news about a change in how the Fed responds to a given
macro development or (b) news about unexpected
consequences of Fed actions.
It is helpful to approach this classification issue from a Taylor
Rule perspective. Consider the following cases:
54Distinguishing Monetary Policy &
Central Banking from Macroeconomic
News & Outlook, 2
1. Macro news: The market moves because it anticipates or
speculates (or sees) that the Fed will respond in its usual
manner to news about the macro economy. That is, the
market anticipates or speculates that the Fed will respond
to macro developments according to a well-understood
description of the Fed's interest-rate setting behavior.
2. Monetary policy: The market moves because of a surprise
change in the policy interest rate -- i.e., a surprise
conditional on the state of the macro economy. From a
Taylor Rule perspective, we can think of this change as a
new value for the innovation term in the Taylor rule.
55Distinguishing Monetary Policy &
Central Banking from Macroeconomic
News & Outlook, 3
3. Monetary policy: The market moves because of an
actual or potential change in the Fed’s policy rule. From
a Taylor Rule perspective, this event corresponds to an
actual or potential change in the form of the Taylor Rule
or a change in specific parameter values. A concrete
example would be a big market response to proposals to
increase the target interest rate.
4. Monetary policy: The market moves because of news
that leads to revised views or concerns about the
consequences of the Fed's actual or anticipated actions.
Articles in category 1 get coded as Macro News & Outlook.
Articles in categories 2, 3 and 4 get coded as Monetary
56
Policy & Central BankingExample 1 (2/8/2018, S&P 500 index return -3.75%): This article would receive a primary category of Macroeconomic News and Outlook (Non- Policy) because the article links rising inflationary pressures to tighter monetary policy. These explanations fit well with Taylor Rule-like conduct by central banks, and therefore would not be classified as monetary policy.
Coding U.S. Jumps
• Jumps: Days when CRSP Value-Weighted
  Index (VWI) has absolute return of at least
  2.5%, measured using closing prices.
• All jumps coded by 2+ persons for quality
  control and analysis of agreement rates.
• For jumps after WWII, we use five papers
  (WSJ, NYT, BG, WP & LAT) to compare
  interpretations and analyze agreement rates.
US Jumps by Year (policy 40%)
                                        Depression Lowest
                                          Growth (1932)
     50
                                                   Second
                                                Downturn (1937)
                                                                                         Global
                                                                                        Financial
            1893 Panic 1901                                                               Crisis
                      Panic                                                  Black
                                 WWI                              Oil Shock Monday
                                                     WWII
     0

                      Banking                                                         Tech
                      Panic of                                                       Boom/
                       1907                                                           Bust

                                       1929
                                       Crash
     -50

                                                     NY Times and WSJ

            1890         1910            1930          1950       1970       1990            2010

                                   Unknown + No Article                   Non-Policy
                                   Policy

Notes: Each bar shows the number of positive or negative jumps in the year. Shadings indicate the
number of jumps triggered by “Policy” and “Non-Policy” news. The residual category reflects jumps
attributed to unknown causes by the newspaper article and instances in which we found no article about
the jump, which never happens after 1925.
Breakdown of US jumps by Category:
Prewar vs. Postwar and Positive vs. Negative
1926-1945 1946-2016 Share of Jumps Within Each Period
Category Negative Positive Negative Positive 1926-1945 1946-2016 Share Negative
Commodities 27 21 6 4 9.2% 2.7% 56.5%
CorporateEarningsandProfit 30 19 26 24 9.2% 12.8% 57.1%
ElectionsandPoliticalTransitions 6 5 7 8 2.0% 3.8% 50.0%
ForeignStockMarkets 5 2 4 1 1.2% 1.2% 77.5%
GovernmentSpending 12 30 11 15 8.1% 6.6% 33.3%
MacroNews 57 61 83 45 22.6% 32.8% 56.8%
MonetaryPolicyCentralBanking 10 27 12 35 7.1% 11.9% 26.3%
NonSovMilitaryTerror 0 1 3 2 0.2% 1.3% 60.4%
OtherNonPolicy 15 6 7 3 4.0% 2.5% 70.9%
OtherPolicy 8 12 3 4 3.8% 1.8% 39.6%
Regulation 18 12 5 5 5.6% 2.4% 57.3%
SovMilitary 40 19 15 9 11.3% 6.1% 66.1%
Taxes 7 5 2 4 2.4% 1.5% 46.6%
TradeandExchangeRatePolicy 4 8 0 4 2.3% 1.0% 28.6%
Unknown 37 20 17 28 11.0% 11.6% 53.2%
Total 274 247 201 190 100.0% 100.0%
Sum Total 912
US jump definition: Days where the CRSP Value-Weighted
Index (VWI) has an absolute return of at least 2.5%.Validation Exercises, 1 1. Industry-Level Jump Responsiveness: For many jumps, the explanation offered in next-day accounts implies an amplified or dampened response of certain industries to the news that moved the overall market. Example 1, Banks: During the GFC, the stock market responded positively to upward revisions in the likelihood or generosity of bank bailouts. For this type of jump, we expect an even more favorable response for Bank stocks. That is, the response of Bank stocks is AMPLIFIED relative to the overall market response. Example 2, Guns: When bad news about the likelihood or duration of the Iraq war generated a negative jump, we expect the response for Guns (Defense firms) to be DAMPENED relative to the overall market response. While a longer war may be bad for the overall U.S. economy, it is less bad (or even good) for the Guns industry.
Validation Exercises, 2
Implementation:
• Obtain daily portfolio returns for 49 industries.
• Review coding detail for U.S. equity market jumps from 1960 to
  2016. If the detailed description for jump-date t implicates
  industry i, then assign values to !"#$% as follows:
!"#$% = 1, if jump description implies AMPLIFIED response of i.
      = -1, if jump description implies DAMPENED response of I;
      = 0, OTHERWISE.
• In making these industry assignments, we take a conservative
  approach, as follows:
   – We typically make industry assignments based on the Primary jump reason
     only, not the Secondary Jump reason (if there is a Secondary reason.
   – We set !"# to 0 when the detailed explanation for the Jump involved an
     overly broad industry group for our purposes. For example,
     “Manufacturing,” maps to at least 15 of the 49 industry groups.
Validation Exercises, 3
• Most jumps do not map readily to a particular industry.
Sometimes, we assign 2 industries to a given jump. Most, but not
all, of these dual assignments involve Sovereign Military Jumps,
which implicate both Guns and Aerospace.
• Among our 339 jumps from 1960 to 2016, we obtain 115 Jump-
Day X Industry observations with nonzero Tri values, as follows:
– Banks: 38 nonzero values
– Guns: 19
– Aerospace: 16
– Others, all with less than 10 nonzero Tri values: Oil, Coal, Building
Materials, Construction, Autos, Chips, Hardware, Household Goods,
Software, Electrical Equipment
• !"# = the daily return for industry portfolio i on day t.
• %!# = the daily return on market portfolio on day t.Validation Exercises, 4
One-industry-at-a-time approach
Consider daily industry-level returns for i :
89: = < + >?8: + @ABC9: + DABC9: ?8: + E:
Pooled-sample approach
Consider daily industry-level returns for industries
with at least 3 nonzero Tri values:
89: = ∑9 9 ?8: + ∑9 @9 ABC9: + DABC9: ?8: + E:
Under both approaches, the hypothesis of interest is
LM : D = 0, LP : D > 0Validation Exercises, 5
Banks Pooled Sample
All Days Jump Days All Days Jump Days
Coefficient 0.80*** 0.74*** 0.55*** 0.51***
(St. Error) (0.23) (0.24) (0.13) (0.13)
Observations 13,469 339 109,760 4720
R-Squared 0.67 0.83 0.56 0.81
A regression for Guns, yields results similar to the Pooled ones, but the standard
error is large and the coefficient estimate is insignificant. When we set Tri=-1 for
the Aerospace industry for jumps attributed to Sovereign Military Conflict, the
Aerospace regression yields a small, marginally significant coefficient of the wrong
sign. That may reflect the ambiguous nature of Aerospace firms’ responses to
military conflict: (relatively) good news for defense-oriented aerospace firms may,
at the same time, be bad for aerospace firms oriented toward civilian customers.
If we set Tri=1 for Aerospace in these cases, the anomalous Aerospace result
disappears, and the Pooled Sample results get stronger.Validation Exercises, 6
These results confirm that our classification of jumps (based on next-
day newspaper accounts) reflects useful information about actually
triggered the jump.
2. Announcement-Date Responses: We test
whether jumps attributed to:
– Monetary Policy & Central Banking are relatively
likely on FOMC announcement dates (Yes)
– Macroeconomic News & Outlook are relatively likely
on release dates for the Employment Situation
Report and the CPI Report (Yes)
– Elections & Political Transitions are relatively likely
the day after national elections (Yes)Countries, Time Periods, Newspapers and Jump Thresholds
Jump
Country Start End Primary Newspapers
Threshold
United States 1885 2016 Wall Street Journal and NY Times 2.50%
United Kingdom 1930 2011 Financial Times (UK Edition) 2.50%
Australia 1985 2011 Australian Financial Times 2.50%
Canada 1980 2012 The Globe and Mail 2.00%
China (Hong Kong) 1988 2011 South China Morning Post 3.80%
China (Shanghai) 1994 2013 Shanghai Securities Journal 4.00%
Germany 1985 2012 Handelsblat, FAZ 2.50%
Greece 1989 2015 Kathimerini, To Vima 4.00%
Ireland 1987 2012 The Irish Times 2.50%
Japan 1981 2013 Yomiuri and Asahi 3.00%
New Zealand 1996 2011 New Zealand Herald 2.50%
Saudi Arabia 1994 2013 Al Riyadh 2.50%
Singapore 1980 2013 Business Times and Straits Times 2.50%
South Africa 1986 2013 Business Day 2.50%
South Korea 1980 2013 Chosun Ilbo 2.50%
Notes: Jump thresholds vary somewhat across countries to account for
differences in unconditional volatility. We select a jump threshold such that
about 1% of daily moves satisfy the jump criterion.Breakdown of international jumps by category
Category Negative Positive Share Negative
Commodities 84 96 46.7%
CorporateEarningsandProfit 212 143 59.7%
ElectionsandPoliticalTransitions 36 34 51.4%
ForeignStockMarkets 280 221 55.9%
GovernmentSpending 56 93 37.6%
MacroNews 649 356 64.6%
MonetaryPolicyCentralBanking 120 206 36.8%
NonSovMilitaryTerror 39 11 78.0%
OtherNonPolicy 245 206 54.3%
OtherPolicy 67 111 37.6%
Regulation 54 47 53.5%
SovMilitary 55 44 55.6%
Taxes 7 11 38.9%
TradeandExchangeRatePolicy 13 17 43.3%
Unknown 212 243 46.6%
Total 2129 1839
Sum Total 3968
The sample for this table starts in 1980 and ends in 2013 to
maximize sample-period overlap across countries.Count by year for the UK (policy 33%)
Recession and
40
1976 IMF crisis
Global
Financial
Crisis
20
Tech
Great crash
Depression Sterling
Crisis
0
WWII Suez
Crisis Black
Monday
-20
1930 1950 1970 1990 2010
Unknown + No Article Non-Policy
PolicyYearly Count - All Countries (policy 26%)
Global
20
Financial Crisis
Early
1990’s
10
Recession
0
-10
Eurozone
Asian and Crises
Russian
Financial
-20
Crises
-30
1985 1990 1995 2000 2005 2010 2015
Unknown + No Article Non-Policy
Policy
Notes: Each bar is the average number of jumps per year across the following countries: Australia,
Canada, China (HK), China (Shanghai), Germany, Greece, Ireland, Japan, New Zealand, Saudi Arabia,
Singapore, South Africa, South Korea and UKPolicy share rises with jump threshold
Increase Initial
Threshold By # Jumps Policy Share
0.0% 4340 26.4%
0.50% 2933 28.4%
1.00% 2031 29.0%
1.50% 1479 30.9%
2.00% 1134 32.5%
2.50% 812 31.8%
Using our sample of 14 countriesShare of Jumps Attributed to U.S. Developments
.8
Sample excludes Jumps in U.S. stock market
.8
Global
Tech Boom/ Financial
Early 1980’s Bust Crisis
.6
.6
recession
US Share of Global GDP
US Share of Jumps
1987 Crash
.4
Asian/LTCM
.4
crises
Eurozone
.2
Crisis
.2
Gulf War I
0
1980 1990 2000 2010
U.S. Jump Share U.S. GDP Share
0
1980 1990 2000 2010
Notes: Average share of jumps attributed to U.S. developments by year in Australia, Canada,
China (HK), China (Shanghai), Germany, Greece, Ireland, Japan, New Zealand, Saudi Arabia,
Singapore, South Africa, South Korea and UK. Dot size is proportional to the average number of
jumps by country/year. U.S. Share of PPP-adjusted global GDP using IMF data.Geographic Source of Jumps by Country
and Bilateral U.S. Trade Share
North America: US
North America: Canada
Asia: Singapore
Other: South_Africa
Other: Australia
Europe: Ireland
Asia: Japan
Europe: Germany
Asia: Korea
Asia: Hong_Kong
Europe: UK
Other: New_Zealand
Europe: Greece
Other: Saudi_Arabia
Asia: Shanghai
0 .2 .4 .6 .8 1
US Europe
Asia Other
Notes: Red X shows the average bilateral trade share with the United States from
1999 to 2015, measured as (exports + imports) / (Domestic GDP).Jump Shares Attributed to U.S. & Europe
The sample for “US Jump Share” excludes the United States
The sample for “Europe Jump Share” excludes European countries
.8
.6
.4
.2
0
1980 1990 2000 2010
Europe Jump Share US Jump Share
Europe GDP Share US GDP Share
GDP shares computed using contemporaneous exchange rates.Jumps Attributed to Monetary Policy
Exhibit Less Post-Jump Volatility
Using Daily U.S. Data from 1946-2016
Average Cumulative Squared Returns
.01
.008
.006
.004
.002
0
0 5 10 15 20
Days After
No Jump Monetary Policy
Macro News All Other JumpsMonetary Policy Jumps Continue to Show Less Post-Jump
Volatility When We Control for Jump Size and Direction
U.S. Data
(3)
1946-2016
(4)
1990-2016
(5) Daily U.S. Data
Jump 0.83*** 0.43*** 0.29**
(0.13) (0.13) (0.13)
Return 10.36*** 10.96***
Note: The dependent variable is the
(1.42) (2.05) cumulative realized volatility over the
|Return| x Return < 0 25.70*** 30.82*** following 22 trading days. The category
(2.06) (3.07)
Commodities -0.77*** -0.64*** -0.34
variables are dummies equal to one for
(0.24) (0.23) (0.71) a jump of that type. The omitted
Corporate Profits -0.13 -0.08 -0.01 category is Macroeconomic News, the
(0.24) (0.23) (0.25)
Military -0.73*** -0.72*** -0.73***
most common jump category. In
(0.17) (0.16) (0.20) addition to the reported controls, we
Monetary Policy -0.57*** -0.48*** -0.47*** include an NBER recession dummy and
(0.16) (0.15) (0.17)
Other Non-Policy 0.78 0.61 -0.94*** a dummy for return less than zero on
(0.79) (0.82) (0.22) the jump day. Robust standard errors
Fiscal and other policy 0.33 0.32 0.90***
in parenthesis. *** pAre jump codings reliable and consistent?
Two potential concerns about the method:
1. Two persons reading same article may code jumps
differently
2. Results may depend on newspaper consulted
To evaluate these concerns we:
1. Use multiple RAs for same paper - calculate
agreement
2. Use multiple papers - Boston Globe, LA Times, NY
Times, WSJ, Washington Post - calculate agreementAverage Pairwise Agreement Rates
1
Across Coders, Same Paper
1 .8
average 89%
.8 .6
P(Agree)
average 75%
.6 .4
P(Agree)
.4 .2
.2 0
1980 1990 2000 2010
Policy Agreement 16 Category Agreement
0
Notes: Agreement is the share of codings (at the coder-level) that agree, averages are shown for each year.
1980 1990 2000 2010Average Pairwise Agreement Rates Across
Newspapers, Different Coders
1
average 79%
.8
.6
average 49%
P(Agree)
.4
.2
0
1980 1990 2000 2010
16 Categories Policy
Notes: There are 9 coders, across 5 newspapers each day. Agreement is the share of pairs that agree, out of
36 possible pairs. Dots represent an annual average of the share of pairs which agree.Measuring Perceived Jump Clarity
We measure Jump Clarity by averaging five
measures (all on 0-1 scale) for each jump:
1. Pairwise agreement rate among coders as to
jump reason (according to the journalist)
2. Pairwise agreement rate among coders for
same newspaper
3. Journal confidence about jump reason
4. Ease of coding the jump
5. Whether the article said the jump reason was
“Unknown” or offered No Explanation.
We reverse the sign on item 5 before combining
it with the items 1 to 4.Greater Jump Clarity Involves • Lower intraday volatility on jump day (sum of squared 5-minute returns) • Lower market volume on jump day (trades in SPY, largest and most liquid S&P 500 ETF) • Greater concentration of market move on jump day (share of day’s total return in 5-minute window with largest absolute return) • Smaller VIX gain on jump day (change from previous day’s close)
Jump-Day Volatility, Volume, Concentration and VIX Change
        Regressed on Clarity Index and Controls
 U.S. data from 1996 to 2011. All specifications include controls for day of the week,
 month of the year and year.
                        Volatility          Volume Concentration Change in VIX
  Clarity [Alternative] -0.11***           -0.05***   0.04**        -0.03*
                          (0.04)             (0.01)    (0.02)        (0.02)
         Return         95.02***           33.75***     10.7         -5.19
                         (21.36)             (7.97)    (6.85)        (5.98)
       Return < 0          1.23               0.34     -0.16       1.76***
                          (0.85)             (0.39)    (0.46)        (0.49)
 |Return| x Return < 0 160.44***           65.30***     9.61       43.36***
                         (28.20)            (12.11)   (12.65)       (14.34)
        Constant        -3.33***           -2.24***     0.42         -0.82
                          (0.80)             (0.49)    (0.55)        (0.54)

      Observations              235           224             235                223
       R-squared               0.587         0.864           0.356              0.753
Government Bonds and Exchange Rates We extend our method to U.S. and U.K government bond yields and U.S. exchange rates. 1. Macroeconomic News & Outlook is the main (65%) trigger for jumps in U.S. bond yields. Monetary Policy & Central Banking accounts for another 28%. 2. U.K. bond yields show a muted version of the same pattern: Macro = 43%, Monetary = 23%. 3. Macroeconomic News & Outlook is also the most important trigger for jumps in U.S. exchange rates, with Monetary Policy next.
10-Year U.S. Government Bonds, Jumps Per Year, 1970-2013,
Jump threshold: |relative yield change| > 0.04 OR |yield change| > 0.2

30

20

10

 0

-10

                        Policy-Triggered Increases    Other Increases
-20
                        No Article Found, Increases   Policy-Triggered Decreases
                        Other Decreases               No Article Found, Decreases
-30
   70

   72

   74

   76

   78

   80

   82

   84

   86

   88

   90

   92

   94

   96

   98

   00

   02

   04

   06

   08

   10

   12
 19

 19

 19

 19

 19

 19

 19

 19

 19

 19

 19

 19

 19

 19

 19

 20

 20

 20

 20

 20

 20

 20
                                                                                    86
10-Year U.K. Government Bonds, Jumps Per Years, 1979-2013,
Jump threshold: |relative yield change| > 0.04 OR |yield change| > 0.2
20
15
10
5
0
-5
-10
Policy-Triggered Increases Other Increases
-15
No Article Found, Increases Policy-Triggered Decreases
Other Decreases No Article Found, Decreases
-20
79
81
83
85
87
89
91
93
95
97
99
01
03
05
07
09
11
13
19
19
19
19
19
19
19
19
19
19
19
20
20
20
20
20
20
20
87U.S. Trade-Weighted Exchange Rate, Jumps per Year, 1973-2013,
Jump threshold: |relative change| > 0.015
15
10
5
0
-5
Policy-Triggered Appreciation Other Appreciation
Dollar No Article Found, Appreciation Policy-Triggered Depreciation
Depreciation Other Depreciation No Article Found, Depreciation
-10
73
75
77
79
81
83
85
87
89
91
93
95
97
99
01
03
05
07
09
11
13
19
19
19
19
19
19
19
19
19
19
19
19
19
19
20
20
20
20
20
20
20
88USD-GBP Exchange Rate, Jumps per Year, 1972-2013,
Jump threshold: |relative change| > 0.015
20
15
10
5
0
-5
-10
-15
Policy-Triggered Appreciation Other Appreciation
-20 No Article Found, Appreciation Policy-Triggered Depreciation
Dollar
-25
Depreciation Other Depreciation No Article Found, Depreciation
72
74
76
78
80
82
84
86
88
90
92
94
96
98
00
02
04
06
08
10
19
19
19
19
19
19
19
19
19
19
19
19
19
19
20
20
20
20
20
20
89Some Next Steps
1. Code additional jumps and extend sample.
2. Expand analysis of how post-jump market
behavior relates to jump reason.
3. Some (policy-induced) jumps mitigate market
volatility and uncertainty, others amplify it.
– Operationalize and apply this distinction.
4. Improve the Jump Clarity Index
– Relate Clarity to pre-, post- and jump-day outcomes.
– Is there more scope for “narratives” to emerge,
spread and affect asset prices when clarity is low?
5. Automate classifications and extend to smaller
market moves.References
Baker, Scott R., Nicholas Bloom and Steven J. Davis, 2016. “Measuring Economic Policy
Uncertainty,” Quarterly Journal of Economics, 131, no. 4 (November), 1593-1636.
Baker, Scott, Nicholas Bloom, Steven J. Davis and Marco Sammon, 2018. “What Triggers
Stock Market Jumps?” American Economic Association Meetings, January.
Blanchard, Olivier J. Beth Anne Wilson, Mohammad Jahan-Parvar, Juan M. Londono,
Chris Collins and Thomas Pellet, 2018. “Why Has the Stock Market Risen So Much
Since the Election?” Peterson Institute for International Economics Working Paper.
Campbell, John L., Hsinchun Chen, Dan S. Dhaliwal, Hsin-min Lu and Logan B. Steele,
2014. “The Information Content of Mandatory Risk Factor Disclosures in Corporate
Filings,” Review of Accounting Studies, 19, 396-455.
Cutler, David, James M. Poterba and Lawrence H. Summers, 1989. “What Moves Stock
Prices?” Journal of Portfolio Management, 15, no. 3 (Spring), 4-12.
Davis, Steven J., 2017. “Regulatory Complexity and Policy Uncertainty: Headwinds of
Our Own Making.” Prepared for the Hoover Institution Conference on “Restoring
Prosperity: Contemporary and Historical Perspectives” at Stanford University on 9-
10 February 2017. Becker Friedman Institute Working Paper.
Davis, Steven J. and Cristhian Seminario, 2018. “Diagnosing the Stock Market Reaction
to Trump’s Surprise Election Victory,” University of Chicago, in progress.References
Pastor, Lubos and Veronesi, Pietro, 2012. “Uncertainty about government policy and
stock prices,” Journal of Finance, 67, 1219-1264.
Pastor, Lubos and Veronesi, Pietro, 2013. “Political Uncertainty and Risk Premia,”
Journal of Financial Economics, 110, no. 3 (December), 520-545.
Schwert, G. William, 1981. “Using Financial Data to Measure Effects of Regulation,”
Journal of Law and Economics, 24, 121-158.
Shiller, Robert, 2017. “Narrative Economics,” American Economic Review, 107, no.4
(April), 967-1004.
Wagner, Alexander F., Richard J. Zeckhauser and Alexandre Ziegler, 2017. “Company
Stock Price Reactions to the 2016 Election Shock: Trump, Taxes and Trade,” Journal
of Financial Economics, forthcoming.
Wagner, Alexander F., Richard J. Zeckhauser and Alexandre Ziegler, 2018. “Paths to
Convergence: Stock Market Behavior after Donald Trump’s Election,” CEPR
Discussion Paper DP 12657.
Wolfers, Justin and Eric Zitzewitz, 2018. “What Did Financial Markets Think of the
2016 Election?” American Economic Association, Papers & Proceedings,
forthcoming.You can also read