Testing the effectiveness of a novel approach to measure a large roosting congregation in a wetland ecosystem.
←
→
Page content transcription
If your browser does not render page correctly, please read the page content below
Sandoval
New Zealand
 et al.:
 Journal
 Measuring
 of Ecology
 roosting
 (2023)
 congregations
 47(1): 3513in©forests
 2023 New Zealand Ecological Society. 1

 RESEARCH

Testing the effectiveness of a novel approach to measure a large roosting congregation
in a wetland ecosystem.

Nicolas Sandoval1*, Karen Denyer2, Sasha Dowling3, Dip Barot1 and Nathan Fan1
1
 Wintec-Te Pukenga, Centre for Applied Science and Primary Industries, Hamilton, New Zealand
2
 National Wetland Trust, Ohaupo, New Zealand
3
 Predator Free Hauraki Coromandel Community Trust, Coromandel Peninsula, New Zealand
*Author for correspondence (Email: Nicolas.Sandoval@wintec.ac.nz)

Published online: 26 January 2023

 Abstract: The National Wetland Trust constructed a 1400 m long pest exclusion fence around a 11 hectare site at
 Rotopiko and all mammals except mice have been eradicated from inside the fenced area. Since the completion
 of the pest proof fence, the number of roosting birds has increased dramatically. By removing mammalian pests,
 an unexpected sanctuary has been created for communal roosting birds such as starlings (Sturnus vulgaris) and
 sparrows (Passer domesticus). There is growing concern about the large amounts of bird faeces produced each
 day and the associated nutrient load particularly as the pest fence encircles a low nutrient peat lake. In this study
 two methods were developed for estimating the relative abundance of the large roosting congregation, based on
 (1) gridded plates for gathering guano and (2) the acoustic energy of the roost cacophony. The results showed
 that these methods were suitable for measuring the characteristics of the roosting community at multiple scales.
 For example, large variance in the abundance of roosting and diurnal birds, and minor changes in the roosting
 community according to seasonal fluctuations. The methods could support the management of the issue through
 being applied to assess and quantify the relative efficacy of preventive or control methods deployed to reduce
 the number of exotic birds. The findings of this study are site specific; however, the guano plates and sound
 recorders could be implemented to estimate large bird numbers at other sites facing a roosting bird problem.
 Keywords: abundance estimation, communal birds, competitive release, population assessment, colony
 management, roosting impacts

Introduction this approach being implemented to the New Zealand mainland.
 The mainland ecosanctuary model has gradually increased
New Zealand’s early separation from Gondwanaland, since the completion of Warrenheip in Waikato and Zealandia
approximately 80 million years ago, and the long period of in Wellington in 1999, as the principle of conservation efforts
isolation that followed, might mean that New Zealand’s biota targeted to restore ecosystems instead of single species
lack mechanisms to defend themselves against terrestrial continues to develop. This concept involves designing and
mammalian predators (Monks et al. 2019). Prey-predator constructing a fence that acts as a barrier for mammalian pests
relationships and competition for resources between introduced around an area of interest, which is then intensively managed
and endemic species are key issues associated with biodiversity to eradicate all the pests inside. The National Wetland Trust
decline. For example, rats and possums are generalist species (NWT) has constructed a 1400 m pest exclusion fence around
with a more aggressive and competitive nature that helps a 11 hectare site comprising a c. 10 000 year old, 1 hectare
them to appropriate niches exploited by the more sensitive peat lake with swampy margins, a c. 400 year old kahikatea
New Zealand biota (Adams et al. 2013). forest stand, and restoration plantings of various ages. All
 The susceptibility of New Zealand’s biota to alien species mammals except mice have been eradicated from inside the
has driven the development of various strategies to control and fenced area. The (NWT) is an organisation that aims to protect
manage introduced mammals. For example, offshore islands wetland ecosystems and their functions, and to increase public
have been used for biological conservation in New Zealand awareness of wetland values, including ecosystem services.
since the late 1800s, when Little Barrier Island was selected Rotopiko is a community-led restoration project frequently
as a sanctuary for birds (Pryde 1997). Miskelly & Powlesland used by local schools and youth groups to introduce young
(2013) revealed that 55 species of New Zealand birds have New Zealanders to conservation and nature. For the local
been translocated to sanctuaries where their populations are hapu, Ngāti Apakura, Rotopiko is an important cultural site
able to survive and grow without the threat of predators. The that has provided Māori with food, medicines, and traditional
conservation success observed in the offshore islands resulted in construction materials for hundreds of years. Taonga species
DOI: https://dx.doi.org/10.20417/nzjecol.47.3513
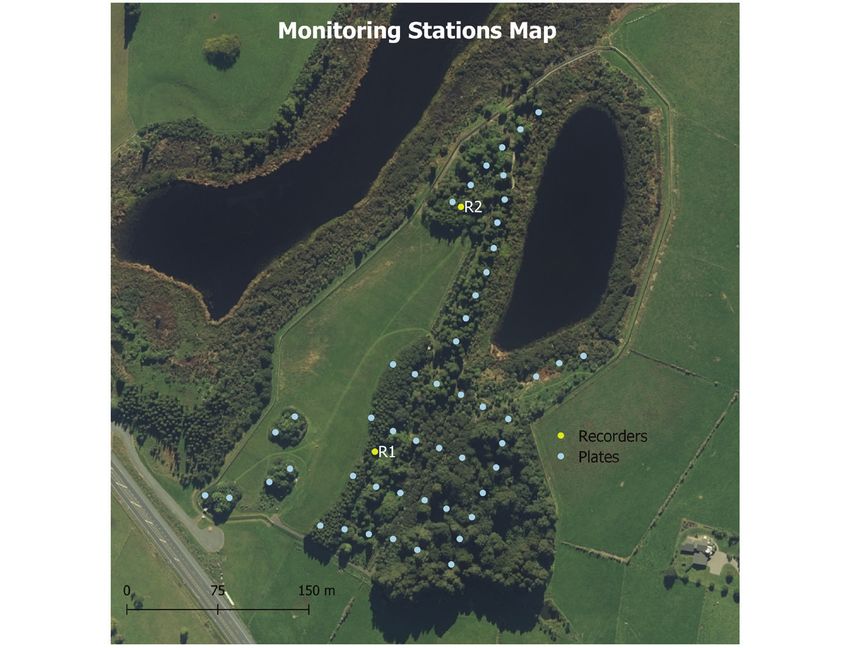
2 New Zealand Journal of Ecology, Vol. 47, No. 1, 2023

such as eels are an important food source for Māori and are still roosting congregations. Symonds (1961) developed a direct
present at the site. The pest exclusion fence was completed in monitoring system based on the entry flying behaviour of
2013; however, since the completion of the pest proof fence, starlings to the roost. The dimensions (depth, width, length,
the number of roosting and diurnal exotic birds has increased time) of the entering bird stream was used to estimate the
dramatically. Roosting birds are the individuals that arrive at roosting population. This method could be hampered by the
the site before sunset and leave after sunrise the following development time, as it took eight years to develop because
morning. Communal roosting birds spend the night as a large of variation in the birds entering the roosting site and observer
group to assist with survival strategies such as body temperature bias. Stewart (1973) developed an indirect technique based
regulation and predation avoidance (Mazumdar et al. 2017; on estimating the number of roosting birds according to the
Manzoor et al. 2021). Diurnal birds are the individuals droppings produced from individuals and the entire roost. The
present at the site during the daytime. The eradication of method involved deploying paper sheets and sticks of different
mammalian pests has created an unexpected sanctuary for dimensions to accumulate droppings in the area of interest.
communal roosting birds such as starlings (Sturnus vulgaris) Then, dried samples were weighed to calculate an estimate of
and sparrows (Passer domesticus) which now form a roosting the roosting population. While these approaches have proved
community comprising in the hundreds of thousands. Every useful, there is a need for a reliable method to estimate large
night approximately an hour before sunset, birds arrive at roosting populations in wooded areas.
the site to roost in the pest-free sanctuary. Challenges like Restoration projects such as Rotopiko fit into current
this could potentially arise throughout New Zealand as the central government policies that aim to restore, and avoid
Predator Free 2050 goal approaches. the loss of, wetland areas. The National Policy Statement
 There is increasing concern about the large amount of bird for Freshwater Management 2020 included several new
faeces produced each day at Rotopiko and the associated high policies to guide local governments towards more efficient
concentration of nutrients, such as nitrogen and phosphorous. management of wetlands. This wetland restoration also fits
Fujita and Koike (2007), from their study of nutrient inputs to with the purpose of the Te Ture Whaimana o Te Awa o Waikato
different habitats via birds, demonstrated that forest areas with (Vision and Strategy for the Waikato River) part of the Waikato
high roosting populations had elevated nutrient concentrations. Tainui River settlement, which is has a high priority in the
The phosphorous input from birds accounted for 12.4% of the proposed Healthy Rivers Plan developed by Waikato Regional
phosphorous input to a non-roosting forest and 52.9% to a Council. The aim of this project therefore was to develop a
roosting forest, while nitrogen inputs were estimated at 5.2% monitoring tool for estimating the relative abundance of the
in a non-roosting forest and 27% in a roosting forest. Peat roosting population and to assess the efficacy of future control
lakes like Rotopiko have unique characteristics, such as low measures at Rotopiko. The system was based on droppings that
nutrient levels and naturally acidic waters, and provide habitat accumulated on a gridded plate without the time limitation for
for animals and plants suited to those conditions (Clarkson & drying samples reported in the method of Stewart (1973). The
Peters 2012). The community of roosting birds at Rotopiko method was supplemented and validated using sound recorders
must be controlled to prevent potential negative effects, such as that measured the acoustic energy emitted by the roost.
long-term effects on the chemical and physical characteristics
and biota of the site, decline in low nutrient-requiring species,
and an increase in nutrient-demanding species. In addition, Methods
the roosting birds compromise the visual impacts and public
health and safety. In recent years, the NWT has implemented Study site
several options to deter the birds such as noise disturbance and Rotopiko is located approximately 15 km south-east of
laser lights. While the NWT initially relied on twice yearly Hamilton, New Zealand (Fig. 1). The current complex of three
five-minute bird counts and visual assessments of guano plates peat lakes has evolved from a larger peat lake formed in the
to monitor the effects, the sheer number of birds precluded last glaciation (Green & Lowe 1985). The pest proof fence
reliable results, and highlighted the need for a monitoring was constructed around what is currently known as the East
system that was capable of accurately estimating changes in Lake. The fenced area includes a drain receiving outflow from
the roosting bird community. adjacent land and surrounding catchment discharging to the
 Different methods are currently used to monitor birds in lake. The East Lake has unique native aquatic plant assemblages
New Zealand. Some methods, such as distance sampling, aim to (Potamogeton ochreatus, Potamogeton cheesemanii) and
estimate the absolute density while others, such as five minute native fish, such as long-fin eels (Anguilla dieffenbachia) and
bird counts, aim to achieve indexes of relative abundance common bully (Gobiomorphus cotidianus) (Wu et al. 2013;
(Greene 2012). Both distance sampling and five minute bird Waikato Regional Council 2021).
counts, rely on the detection of individual birds, which is
difficult to achieve at Rotopiko because of the magnitude Study design
of the issue. Photography techniques are commonly used to
count birds in large numbers, aerial photographs are often During the initial site visit in July 2020, roosting locations
used for sea birds as they can detect individual birds without were identified from evidence of bird droppings on the
any impediments. (Cantos et al. 1999) developed a more ground. The roosting locations were delimited, and the
sophisticated method to directly count large congregations of projected coordinates were recorded using a Garmin eTrex-20.
birds using remote techniques via thermal infra-red sensors; Geographic information system (GIS) technology was then
this method was also used to count sea birds. In a forest used to create a grid map of the monitoring stations in the
environment, photography counts are less useful for birds parts of the reserve disturbed by roosting birds (Fig. 2). The
roosting within the vegetation, as visuals are obstructed by monitoring stations were selected remotely, to randomise the
the canopy (Moore & Powlesland 2012). Historical attempts direction of monitoring lines and create a systematic sampling
have been made to develop robust methods to count large approach that avoided selecting stations that only contained
Sandoval et al.: Measuring roosting congregations in forests 3

 Figures and Tables

Figures
 Figure 1. Map showing
 Rotopiko location in the
 Waikato region of the North
 Island of New Zealand.

 Hamilton

 Rotopiko
 Te Awamutu

 0 10 20 30 40 km

 Figure 1. Map showing Rotopiko location.

 Data were collected about the roosting and diurnal birds
 from September 2020 to November 2021. The data from the
 roosting birds were collected as follow: on each monitoring day,
 the plates were deployed one hour before sunset. A plate was
 fastened to the ground at each monitoring station with metal
 pegs and a flagging tape, displaying the station code, was hung
 from a branch near each station to ensure the measurements
 were taken from the same place each time. The following
 morning, approximately one hour after sunrise, the data were
 recorded from each plate. Measurements were only carried out
 on nights/days without rainfall as the bird droppings would
 have been washed off the plates by the rain. Approximately
 35% of potential surveying events were affected by rainfall
 and excess moisture at ground level. To collect data about
 diurnal birds, plates were deployed one hour after sunrise after
 all roosting birds had left the site meaning that only droppings
 from diurnal birds were deposited on the plates. Data were
 collected one hour before sunset, before the roosting birds
 arrived at the site. The plates had grids on both sides which
 mean that, by flipping the plate, diurnal birds’ data could
 be collected directly after the data from roosting birds were
 collected. After the data collection, the plates were taken to the
 lab and cleaned in preparation for the next collection event.
 Figure 2. Map of the monitoring stations used to measure bird
 droppings at Rotopiko and the sound recorder locations. In addition, two AR4 wildlife sound recorders, developed
 by the Department of Conservation, were deployed each
 time that the plate measurements were made. The recordings
 were taken at a sample rate of 32 kHz at 16 bits for one hour,
 evidence of heavy roosting. A total of 50 stations were created. from 30 minutes before sunset to 30 minutes after sunset.
 At each station plastic plates were deployed to collect birds’ The recorders were hung from the same tree branch at each
 faeces which was used as an indirect measure to estimate the location. These AR4 recorders are generally used in the field
 Figure 2. Map of the monitoring stations used to measure bird droppings
 relative abundance of the roosting community. The plates at to record
 Rotopiko sounds
 and the soundfrom species
 recorder or communities at low densities
 locations.
 were made from 2mm thick green polypropylene sheets and where individuals are relatively easy to identify. However, for
 measured 300 × 300 mm. A nine-module grid was drawn on the large congregation of birds at Rotopiko, individuals could
 each side of each plate with permanent marker, with each not be identified because the bird calls constantly overlapped.
 square measuring 100 × 100 mm. This nine module grid on The sound from the bird community at Rotopiko was therefore
 1
 the plates was critical for measuring change relative to the converted into a measurable quantity using the specialised
 number of roosting birds instead of a simple presence/absence Raven Pro software. Pérez-Granados & Traba (2021) review
 observation. The stations were distributed 20 m apart. studies using passive acoustic monitoring to obtain estimates
4 New Zealand Journal of Ecology, Vol. 47, No. 1, 2023

of wildlife population density and abundance, with 31 studies animals such as breeding and reproduction (Kutty 2021).
having evaluated the use of sound recorders to estimate An understanding of the yearly behavioural patterns of the
bird densities during 2014–2019. The review highlights the roosting community at Rotopiko was therefore critical for
capability of sound recorders to estimate bird numbers from interpreting the data. The distribution characteristics of
individual vocalizations and expressed potential improvements seasonally distinctive data sets of the roosting community and
such as assessing the sampling radius of the sound recorder the abundances of diurnal and roosting birds were compared
used to improve population density estimates. A particular with box plots. In addition, the 95% confidence intervals for
method reviewed was sound pressure levels (SPL) of bird the medians of each group were calculated using the following
calls which measures the energy emitted by the call. Yip et al. equation:
(2020) specified the extensive fieldwork required by SPL to
 ± 1.57 × (1)
estimate bird density as data from bird distance to the recorder √n
and robust calibrations are necessary. This research uses the
principle of measuring the energy of bird calls but without the where IQR is the inter-quartile range, n is the sample size and
limitation of knowing the distance of birds to the recorder, as m is the median) to estimate whether the data sets presented
in Rotopiko the location of the roost is defined, and measures on the box plots showed indicative differences (Krzywinski
of population density are not pursued. In addition, energy & Altman 2014). Finally, Pearson’s correlation coefficient
of individual bird calls was not measured per se, rather we was used to determine the extent of the relationship between
measured the energy of the community calls for our research the two indexes. In addition, 95% prediction interval was
objective. calculated to show the range for the Y-values for given specific
 X-values, and 95% confidence interval to show the range for
Data analysis all potential best-fit lines.
Each module of the gridded plates grid represented 1/9 (0.11) of
the whole plate. Data were recorded by observing the number
of modules in the grid that contained bird droppings. For Results
example, a plate with droppings in 4 modules was recorded
 Index trends
as 0.44. Then the average from the 50 plates was calculated.
Data from the plates for the diurnal and roosting birds were The trends in the acoustic energy and gridded plate trends
compared at different times of the year, to determine whether of the roosting population were similar. Energy remained
changes in the bird community and community fluctuations between 50–48 dB in September 2020 and then gradually
were detected by the index. decreased to 29.3 dB at the end of January 2021, which was
 Files (.wav) from the AR4 recorders were analysed using the lowest energy recorded in this period (Fig. 3). The energy
Raven Pro software, which was developed by researchers then increased sharply at the end of February to 40.5 dB,
in the ornithology lab at Cornell University in the United and then increased further to a maximum of 51.3 dB in June
States. Raven Pro includes the option to select advanced 2021. The plate loading rates increased to a maximum 74.4
measurements from a particular time-frequency recording loading rate in September 2020 and then decreased sharply to
beyond spectrograms and amplitude graphs. Changes in the bird a minimum loading rate of 32.0 at the end of November 2020.
community were measured with the acoustic energy option, as During the summer months, the plate loads tended to increase
this gave a quantifiable estimate of the bird community. Raven but, unlike the energy that remained constantly increasing,
Pro expresses the ratio of joules per meter square in decibels. the plates showed an irregular increase between 40.9–54.2
The energy was measured at frequencies 4000–9000 Hz, and loading rate. Mid-autumn, the plates loading rate increased
anthropogenic noise occurring below 4000 Hz was masked. to 77.9 and reached the maximum record for this period of
As also reported by Wood & Yezerinac (2006), anthropogenic 79.5 loading rate in winter 2021.
noise, i.e. from vehicles, was detected in the results from initial
data at frequencies below 4000 Hz. Even though some calls of Gridded Plates
sparrow and starlings are outside the standardised frequency For roosting birds, the winter-early spring period showed
range used, the range captured the calls in the 4000–9000 Hz lower variability of the dataset relative to the other two
range. Each monitoring day, the total energy released by the roosting periods. The interquartile range (the middle 50%
roosting community was recorded for a one minute period 20 of the data) of roosting birds increased considerably from
minutes before sunset when birds were at their loudest. For 5.1 during the winter-early spring period to 27.7 during the
the diurnal birds, the energy was measured for a one-minute late summer-autumn period. The median loading rate for
period eight hours after sunrise. Then, the energy recorded the roosting community reached a maximum of 72.7 during
was compared and correlated with the index obtained from winter-early spring, then decreased to 41.8 during late
the plates. spring-early summer and increased again to 53.8 in the late
 summer-autumn period. Besides the clear differences in the
 median and interquartile range spreads, the late spring-early
Statistical analysis
 summer and winter-early spring periods for roosting birds
The data were analysed to assess the ability of the developed varied in the overall distribution of the dataset. While the
methods to detect seasonal fluctuations in the roosting interquartile range for late summer-autumn was larger than
community and compare differences between the sizes of the late spring-early summer, all the quartiles in the distribution
roosting and diurnal communities. Trends from both indices’ were relatively evenly scattered; however, late spring-early
plates and acoustic energy, were correlated by using data summer tended to be skewed towards high loadings rates. In
obtained from clearly defined ecological seasons. Seasonal addition, all the medians for the roosting dataset were outside
climatic changes regulate different ecological processes in of the interquartile boxes of the other two periods.
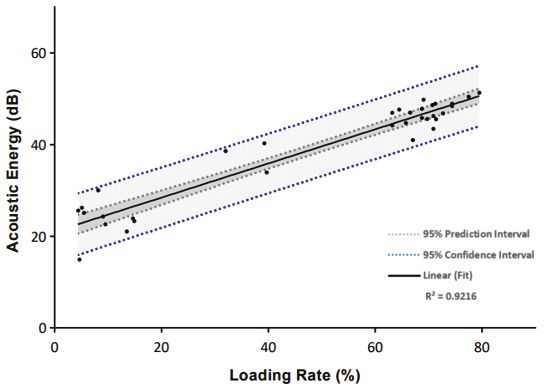
Sandoval et al.: Measuring roosting congregations in forests 5

 100 60 Figure 3. Comparison of the
 acoustic energy and gridded plate
 90 indexes of the roosting community
 Energy
 80
 50 at Rotopiko from September 2020
 Plates
 to July 2021. The solid line shows

 Acoustic Energy (dB)
 70 the acoustic energy in decibels
 Loading rate (%)

 40 captured by the AR4 recorders and
 60 analysed via Raven Pro acoustic
 50
 software. The dashed line shows
 30
 the gridded plates loading rate.
 40
 20
 30

 20
 10
 10

 0 0
 21-Sep 21-Nov 21-Jan 21-Mar 21-May 21-Jul

Figure 3. Comparison of the acoustic energy and gridded plate indexes of the roosting community at Rotopiko from
September 2020 to July 2021. The solid line shows the acoustic energy in decibels captured by the AR4 recorders and
analysed via Raven Pro acoustic software. The dashed line shows the Diurnal
 Roosting gridded plates loading rate. Figure 4. Box plots comparing
 different distributions from
 80 roosting and diurnal birds plates
 loading rate datasets from winter
 70 2020 to autumn 2021 at Rotopiko.
 Each period, winter-early spring,
 60 late spring-early summer, and late
 summer-autumn was determined
 according to the natural fluctuations
 50
 Loading rate (%)

 of the roosting community of
 birds. Data were collected using
 40 the gridded plates developed for
 this research.
 30

 20

 10

 0
 Winter-Early Late Spring-Early Late Summer- Winter-Early Late Summer-
 Spring Summer Autumn Spring Autumn

 For diurnal birds, data were recorded for two periods, ranged from 69.1 to 76.0 and the diurnal bird loading rate
 winter-early spring, and late summer-autumn. The interquartile ranged from 8.2 to 14.9. The 95 % confidence intervals of
 ranges show that the data were more variable, in the winter-early the medians confirm the clear differences in the roosting and
 spring (6.3 interquartile range) than in late summer-autumn diurnal groups, as shown in Fig. 4. The table complements the
 (0.20 interquartile range). The loading rate median for the box plot by providing the numerical ranges of the differences
 winter-early spring period was 13.5 and was higher than the between the groups.
 median of 4.7 during the late summer-autumn period. As for
 roosting birds, the medians for the diurnal birds were outside Gridded Plates-Acoustic Energy Correlation
 the interquartile box of the other period and the interquartile The two indexes were strongly correlated and 92.16% of the
 boxes of the diurnal birds did not overlap. Comparison of the variation in the acoustic energy was explained by the model.
 box plots of the diurnal birds and the roosting birds shows The data show a positive relationship, with an increase in the
 that there is a clear difference in the relative abundance range loading rate accompanied by an increase in the dB measured by
 recorded for each community. For example, the highest loading the recorder. However, the relationship between the variables
 rate for the diurnal birds was 14.9 and was lower than the seemed to be stronger for high bird numbers than for low bird
 lowest loading rate recorded for the roosting birds (32.0). numbers. Data points were clustered near the regression line
 In addition, for the same period in late summer-autumn, the when the loading rate was higher than 60% and were further
 roosting loading rate ranged from 39.7 to 79.5 whereas the from the regression line when the loading rate was less than
 diurnal loading rate ranged from 2.2 to 5.6. Similarly, for the 22% (Fig. 5).
 winter-early spring period, the roosting birds loading rate
6 New Zealand Journal of Ecology, Vol. 47, No. 1, 2023

 Figure 5. Correlation between
 acoustic energy (dB) and loading
 rate (%) measured at Rotopiko from
 60 winter 2020 to spring 2021.
Acoustic Energy (dB)

 40

 20 95% Prediction Interval
 95% Confidence Interval
 Linear (Fit)
 R2=0.9216

 0
 0 20 40 60 80
 Loading Rate (%)

Figure 5. Correlation between acoustic energy (dB) and loading rate (%) measured at Rotopiko from winter 2020 to spring
Discussion
2021. birds box plot were more spread out for the summer months
 than for the winter months, which suggests that the bird
Initially, the purpose of this research was to develop a method numbers fluctuated more during summer. The late spring-early
for measuring the size of the roosting bird community at summer period was less variable than the late summer-autumn
Rotopiko. This was achieved by using plates to collect guano but the low bird numbers in this period seemed to skew the
from roosting and diurnal birds and was validated by comparing distribution, as more data points coincided at the lower end
the results with data from sound recorders. This means that, of the distribution. This again reinforce the limited sensitivity
in this study, two independent methods that are capable of of the plates at lower bird numbers. The interquartile range
estimating the relative abundance of roosting birds at Rotopiko for winter-spring was narrower than for the other two periods
were developed and the methods effectively measured seasonal in the roosting community, indicating stable bird numbers in
fluctuations in the size of the roosting bird community (Fig. this period. However, this could also indicate that the plates
3). Communal roosting of birds helps to minimise predation reached an upper threshold at approximately 72.7 loading rate.
pressure and maintain body temperature during the winter Diurnal birds also showed a narrow interquartile range and a
months (Bijleveld et al. 2010). Rotopiko, as a mammal-free median of 4.7 during summer. According to the medians (Fig.
site, offers a low risk of predation and provides a relatively 4), the results from this study therefore suggest that the current
safe place to roost all year round. The seasonal variations plate resolution can measure from a lower threshold of 4.7%
in the air temperature in the Waikato (20–25 ºC in summer, to a higher threshold of 72.7%. An alternative reason for the
0–8ºC in winter) (Chappell 2013) were reflected in our data, upper limit value could be the shelter space at Rotopiko. The
as birds roosted in large groups in the colder months, to reduce carrying capacity is generally defined as the highest number
thermoregulation costs. The highest indexes levels calculated of individuals in a population that an environment is capable
from the plates and acoustic energy were 74.4 loading rate and of sustaining at a particular time (Hartvigsen 2017). Chapman
51.3 dB during winter and were 48% (plates) and 43% (acoustic & Byron (2018) stated that shelter was a critical factor of
energy) lower in summer, and then increased again when the carrying capacity models in their review of ecosystem studies.
colder months arrived. The observed seasonal fluctuations The interquartile ranges suggested upper and lower
align with bird behaviour during nesting and breeding seasons. threshold limits for the plates and the medians confidence
In New Zealand, the sparrow and starling breeding seasons intervals highlighted differences between the datasets. The
are between September and February (Dawson 2013) and medians of each group were outside the comparable box plots
September and December (Flux 2017). Even though starlings (Fig. 4), which suggests a difference between the groups. In
tend to visit the roosting site all year-round, females stay at the addition, the difference between the roosting and diurnal bird
nesting sites during the breeding season (Flux 2017). For the appeared to be larger according to the contrasting values, with
roosting community, the decibels of acoustic energy showed 72.7 and 13.5 in winter-early spring and 53.8 and 4.7 in late
a gradual decrease from winter to summer while the plates summer-autumn for roosting and diurnal birds respectively.
declined sharply towards December (Fig. 3). This suggests The median 95% confidence intervals (Table 1) also suggest
that the plates had limited sensitivity to detect changes in bird differences between the groups as the confidence intervals
numbers as the roosting community decreased. of the groups do not overlap (Krzywinski & Altman 2014).
 The distribution patterns shown in Fig. 4 provide an This finding is important for this study, as it suggests that the
insight into the ability of the guano plates to detect changes in plates were able to detect large changes in the bird numbers,
the bird community. The interquartile ranges on the roosting such as the differences between roosting and diurnal birds,
Sandoval et al.: Measuring roosting congregations in forests 7

Table 1. Comparison of the 95% confident Interval of the plates loading rate medians from the roosting and diurnal communities
at Rotopiko. Equation (1) was applied to calculate the confidence intervals where IQR = interquartile range (Q3–Q1).
__________________________________________________________________________________________________________________________________________________________________

 Roosting Resident
__________________________________________________________________________________________________________________________________________________________________

 Winter–Spring Spring–Summer Summer–Autumn Winter–Spring Summer–Autumn
__________________________________________________________________________________________________________________________________________________________________

IQR 0.17 0.15 1.025 0.65 0.2
Median 72.7 41.8 53.8 13.5 4.7
Sample Size 7 7 6 7 7
95% CI (69.7, 75.7) (46.4, 37.2) (71.6, 36.1) (17.2, 9.8) (4.8, 4.6)
__________________________________________________________________________________________________________________________________________________________________

but also detected small fluctuations in the bird communities. should be studied to understand how vegetation affects the
The addition of the median 95% confidence interval to imply plates, mainly at low bird numbers. This further research could
differences in the group’s distribution must be considered support the identification of an optimal loading rate threshold
cautiously as sample sizes are small and the distributions that the Rotopiko management team could use as reference.
assumed to be nonnormal. It is recommended to support the Roosting exotic birds could potentially evolve as a major
observations from medians and IQR to suggest differences challenge for New Zealand as more sites become free of
between the distributions with median 95% confidence intervals mammalian predators. While the findings of this study are
for sample size > 20. However, the data suggest that the site specific, the guano plates and sound recorders could be
efficacy of control methods to either drastically or gradually implemented to estimate the bird numbers at any site with a
reduce the pest bird numbers at Rotopiko could be assessed roosting bird issue.
and monitored using the plates.
 There was a strong relationship between the two monitoring
systems, as shown by the regression analysis and the coefficient Acknowledgments
of determination (0.9216; Fig. 5), but the relationship between
the two systems weakened as number of birds declined. The We would like to acknowledge Nathan Fan, Sasha Dowling,
residuals (distance from the points to the trendline) increased and Dip Barot for their contributions to the field work aspect
as the values decreased (Fig. 5), the points appear to be more of this project. We would like to thank the National Wetland
spread-out. Residuals in a regression line represent irregularities Trust, in particular Karen Denyer, for allowing us to contribute
between variables (Weisburg 2005). As mentioned previously, to the pursuit of the trust goals. The support from the Waikato
the capacity of the plates to measure bird numbers seemed Institute of Technology research office is highly appreciated,
to be affected more by the low bird numbers than the sound as well as the encouragement and guidance from Deborah
recorders. This could explain the greater distance between Ballantine, Applied Science Manager at the Waikato Institute
the points when the indexes estimated low bird numbers. of Technology.
This limitation in the plate system reflects how vegetation
prevented droppings from reaching the plates. The effect of
vegetation could be analysed further by comparing the trends Data and code availability
from the plates and the sound recorders as vegetation has less
influence on acoustic energy than the plates. Regarding the There is no code associated with this article; the data from
confidence bands, the narrow 95% confidence interval band this article are openly available at https://doi.org/10.6084/
(Fig. 5) provides certainty about the location of the best fit line m9.figshare.21424986.v1
and the 95% prediction band showed that all values except
one at low bird numbers fell between the range predicted for
any future individual values.
 The pursuit of a tool to measure roosting birds at
 Author Contributions
Rotopiko has resulted in the development of two reliable
 NS conceptualisation, methodology, data analysis, field
methods, gridded plates, and acoustic energy, for estimating
 work, writing original draft and reviewing editing. KD
the relative abundance of a large roosting community. If the
 conceptualisation, writing-reviewing and editing. DB
gridded plates are used at the same resolution as this study,
 methodology and data collection-analysis. SD methodology
the methods should be used in tandem as the plates appeared
 and data collection-analysis. NF data collection.
to decrease in sensitivity at low bird numbers. To overcome
this limitation, we recommend increasing the resolution of the
guano plates by decreasing the size of the modules, so that the
length of the grids decreased from 100 to 50mm. This would References
improve the sensitivity of the plates from 9/9 to 36/36. With
higher sensitivity, the plates will be more useful for detecting Adams AL, Dickinson KJM, Robertson BC, van Heezik Y 2013.
changes at low bird numbers and will also be more effective at Predicting summer site occupancy for an invasive species,
assessing the upper limit measurements. The higher resolution the common brushtail possum (Trichosurus vulpecula), in
could be applied at the upper limit to determine the potential an urban environment. PLoS ONE 8(3): e58422.
carrying capacity of Rotopiko as a roosting site. In addition, Bijleveld AI, Egas M, van Gils JA, Piersma T 2010. Beyond
data from the plates, recorders, and from vegetation growth the information centre hypothesis: communal roosting
8 New Zealand Journal of Ecology, Vol. 47, No. 1, 2023

 for information on food, predators, travel companions Stewart PA 1973. Estimating numbers in a roosting congregation
 and mates? Oikos 119(2), 277–285. of blackbirds and starlings. The Auk 90(2): 353–358.
Cantos FJ, Jiménez M, Fernández-Renau A, Gómez J A, De Symonds AEJ 1961. The counting of starlings at country
 Juan F, De Miguel E, Sanglier, G 1999. Application of roosts. Bird Study 8(4): 185–193.
 sensors and thermal cameras for the census of winter Waikato Regional Council 2021. Lake Rotopiko (Serpentine
 roosts of birds. Ardeola 46(2), 187–193. Lakes) https://www.waikatoregion.govt.nz/environment/
Chapman EJ, Byron CJ 2018. The flexible application natural-resources/water/lakes/shallow-lakes-of-the-
 of carrying capacity in ecology. Global Ecology and waikato-region/peat-lakes/lake-rotopiko/ (accessed 10
 Conservation 13: e00365. December 2021).
Chappell PR 2013. The climate and weather of Waikato. NIWA Weisburg S 2005 Applied linear regression. 3rd edn. Hoboken,
 science and technology series No. 61. Wellington, National Wiley-Interscience. 310 p.
 Institute of Water and Atmospheric Research – Taihoro Wood WE, Yezerinac SM 2006. Song sparrow (Melospiza
 Nukurangi. 38 p. melodia) song varies with urban noise. The Auk 123(3):
Clarkson B, Peters M 2012. Wetland restoration. A handbook 650–659.
 for New Zealand freshwater systems. Lincoln, Manaaki Wu N, Daniel AJ, Tempero GW 2013. Fish biomass and gonad
 Whenua – Landcare Research. 273 p. development in the Rotopiko (Serpentine) lakes. Client
Dawson DG 2013. House sparrow | tiu. In: Miskelly CM ed. report prepared for Department of Conservation. Hamilton,
 New Zealand birds online https://nzbirdsonline.org.nz/ Environmental Research Institude. 27 p.
 species/house-sparrow (accessed 21 January 2022). Yip DA, Knight EC, Haave-Audet E, Wilson SJ, Charchuk
Flux JEC 2017. Common starling | tāringi. In: Miskelly CM C, Scott CD, Sólymos P, Bayne EM 2020. Sound level
 ed. New Zealand birds online https://nzbirdsonline.org. measurements from audio recordings provide objective
 nz/species/common-starling (accessed 21 January 2022). distance estimates for distance sampling wildlife
Fujita M, Koike F 2007. Birds transport nutrients to fragmented populations. Remote Sensing in Ecology and Conservation
 forests in an urban landscape. Ecological Applications 6(3): 301–315.
 17(3): 648–654.
Green JD, Lowe DJ 1985. Stratigraphy and development of c. Received: 28 March 2022; accepted: 31 October 2022
 17000-year-old lake Maratoto, North Island, New Zealand, Editorial board member: Jamie Wood
 with some inferences about postglacial climatic change.
 New Zealand Journal of Geology and Geophysics 28(4):
 675–699.
Greene T 2012. A guideline to monitoring populations.
 Wellington, Department of Conservation. 58 p.
Hartvigsen G 2017. Carrying capacity, concept of. In: Reference
 module in life sciences. New York, Elsevier. Pp. 695–701.
Krzywinski M, Altman N 2014. Points of significance:
 Visualizing samples with box plots. Nature Methods
 11(2): 119–120.
Kutty CI 2021. Uniqueness of seasons in Kerala – Implications
 on thermal stress and productivity of animals. Journal of
 Veterinary and Animal Sciences 52(1): 48–54.
Manzoor S, Khan HA, Hameed M 2021. Communal roosting
 habitats of some passerine birds in Central Punjab,
 Pakistan. Pakistan Journal of Agricultural Sciences 58(1):
 143–150.
Mazumdar S, Ghose D, Saha G 2017. Communal roosting
 behaviour of the black kite (Milvus migrans govinda) in
 an urban metropolis. Journal of Ethology 35(3): 269–277.
Miskelly CM, Powlesland RG 2013. Conservation
 translocations of New Zealand birds, 1863-2012. Notornis
 60(1): 3–28.
Monks JM, Nelson NJ, Daugherty CH, Brunton DH,
 Shine R 2019. Does evolution in isolation from
 mammalian predators have behavioural and chemosensory
 consequences for New Zealand lizards? New Zealand
 Journal of Ecology 43(1): 3359.
Moore P, Powlesland R 2012. Birds: complete counts—aerial
 photo counts. Wellington, Department of Conservation.
 15 p.
Pérez-Granados C, Traba J 2021. Estimating bird density using
 passive acoustic monitoring: a review of methods and
 suggestions for further research. Ibis 163(3): 765–783.
Pryde PR 1997. Creating offshore island sanctuaries for
 endangered species: The New Zealand experience. Natural
 Areas Journal 17(3): 248–254.
You can also read


