Temporal trends in sperm count: a systematic review and meta-regression analysis of samples collected globally in the 20th and 21st centuries
←
→
Page content transcription
If your browser does not render page correctly, please read the page content below
Human Reproduction Update, pp. 1–20, 2022
https://doi.org/10.1093/humupd/dmac035

                                   Temporal trends in sperm count: a
                                   systematic review and meta-regression
                                   analysis of samples collected globally in
                                   the 20th and 21st centuries
                                   Hagai Levine 1,*, Niels Jørgensen 2,3, Anderson Martino-Andrade                                                                    4
                                                                                                                                                                        ,
                                   Jaime Mendiola 5, Dan Weksler-Derri6,7, Maya Jolles1,
                                   Rachel Pinotti 8, and Shanna H. Swan 9
                                   1
                                     Braun School of Public Health and Community Medicine, Hadassah Medical Center, The Faculty of Medicine, Hebrew University of
                                   Jerusalem, Jerusalem, Israel 2Department of Growth and Reproduction, Rigshospitalet, University of Copenhagen, Copenhagen, Denmark
                                   3
                                     International Center for Research and Research Training in Endocrine Disruption of Male Reproduction and Child Health (EDMaRC),
                                   Rigshospitalet, University of Copenhagen, Copenhagen, Denmark 4Department of Physiology, Federal University of Parana, Curitiba, Brazil
                                   5
                                     Division of Preventive Medicine and Public Health, University of Murcia School of Medicine and Biomedical Research Institute of Murcia
                                   (IMIB-Arrixaca-UMU), Murcia, Spain 6Clalit Health Services, Kiryat Ono, Israel 7Faculty of Health Sciences, Ben-Gurion University of the
                                   Negev, Beer Sheva, Israel 8Gustave L. and Janet W. Levy Library, Icahn School of Medicine at Mount Sinai, New York, NY, USA
                                   9
                                     Department of Environmental Medicine and Public Health, Icahn School of Medicine at Mount Sinai, New York, NY, USA

                                   *Correspondence address. Braun School of Public Health and Community Medicine, Hadassah Medical Center, The Faculty of Medicine,
                                   Hebrew University of Jerusalem, Ein Kerem Campus, POB 12272, Jerusalem 9110202, Israel. Tel: þ972-505172895;
                                   E-mail: hagai.levine@gmail.com https://orcid.org/0000-0002-5597-4916
                                   Submitted on June 10, 2022; resubmitted on September 29, 2022; editorial decision on October 11, 2022

                                   TABLE OF CONTENTS
                                   ................................................................................................................................
                                   • Introduction
                                   • Methods
                                         Systematic review and study selection
                                         Data extraction
                                         Quality control
                                         Statistical analysis
                                   • Results
                                         Systematic review and summary statistics
                                         Simple linear models
                                         Meta-regression models for SC
                                         Meta-regression models for TSC
                                         Meta-regression models for recent periods
                                         Sensitivity analyses
                                   • Discussion
                                         Key findings
                                         Comparison to prior studies
                                         Other issues
                                         Strengths
                                         Limitations
                                   • Conclusion and wider implications

C The Author(s) 2022. Published by Oxford University Press on behalf of European Society of Human Reproduction and Embryology. All rights reserved.
V
For permissions, please email: journals.permissions@oup.com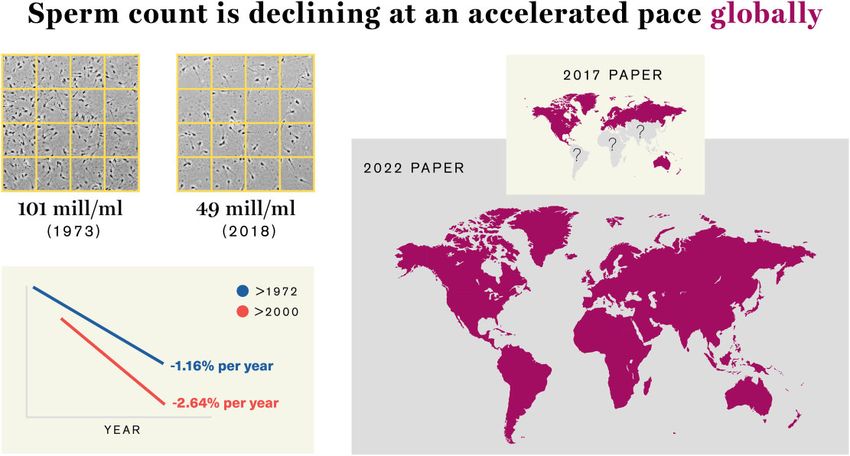
2 Levine et al.
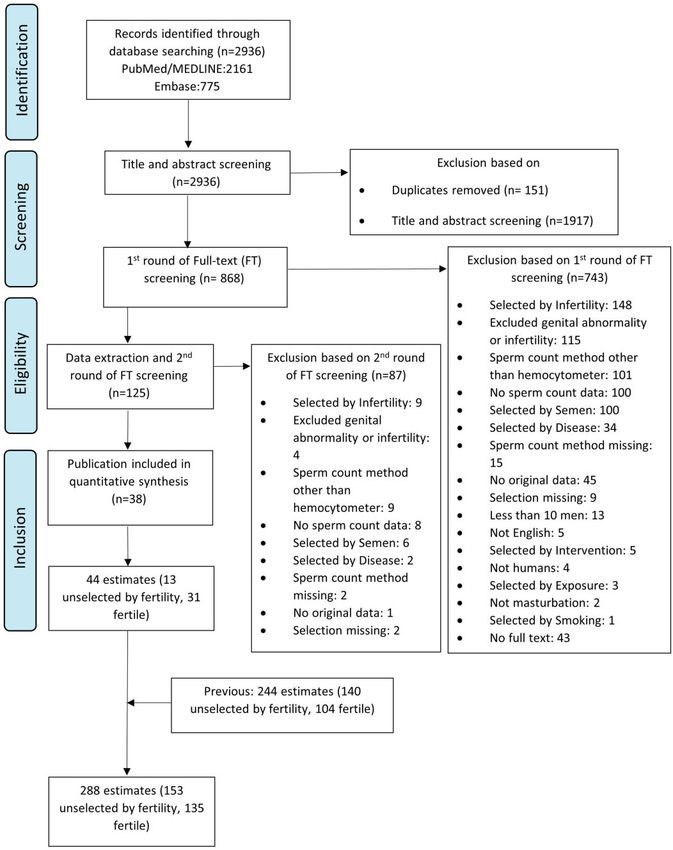
GRAPHICAL ABSTRACT
Sperm count is declining at an accelerated pace globally.
BACKGROUND: Numerous studies have reported declines in semen quality and other markers of male reproductive health. Our previ-
ous meta-analysis reported a significant decrease in sperm concentration (SC) and total sperm count (TSC) among men from North
America–Europe–Australia (NEA) based on studies published during 1981–2013. At that time, there were too few studies with data from
South/Central America–Asia–Africa (SAA) to reliably estimate trends among men from these continents.
OBJECTIVE AND RATIONALE: The aim of this study was to examine trends in sperm count among men from all continents.
The broader implications of a global decline in sperm count, the knowledge gaps left unfilled by our prior analysis and the controversies
surrounding this issue warranted an up-to-date meta-analysis.
SEARCH METHODS: We searched PubMed/MEDLINE and EMBASE to identify studies of human SC and TSC published during
2014–2019. After review of 2936 abstracts and 868 full articles, 44 estimates of SC and TSC from 38 studies met the protocol criteria.
Data were extracted on semen parameters (SC, TSC, semen volume), collection year and covariates. Combining these new data with data
from our previous meta-analysis, the current meta-analysis includes results from 223 studies, yielding 288 estimates based on semen sam-
ples collected 1973–2018. Slopes of SC and TSC were estimated as functions of sample collection year using simple linear regression as
well as weighted meta-regression. The latter models were adjusted for predetermined covariates and examined for modification by fertility
status (unselected by fertility versus fertile), and by two groups of continents: NEA and SAA. These analyses were repeated for data col-
lected post-2000. Multiple sensitivity analyses were conducted to examine assumptions, including linearity.
OUTCOMES: Overall, SC declined appreciably between 1973 and 2018 (slope in the simple linear model: –0.87 million/ml/year, 95%
CI: –0.89 to –0.86; P < 0.001). In an adjusted meta-regression model, which included two interaction terms [time fertility group
(P ¼ 0.012) and time continents (P ¼ 0.058)], declines were seen among unselected men from NEA (–1.27; –1.78 to –0.77; P < 0.001)
and unselected men from SAA (–0.65; –1.29 to –0.01; P ¼ 0.045) and fertile men from NEA (–0.50; –1.00 to –0.01; P ¼ 0.046). Among
unselected men from all continents, the mean SC declined by 51.6% between 1973 and 2018 (–1.17: –1.66 to –0.68; P < 0.001). The
slope for SC among unselected men was steeper in a model restricted to post-2000 data (–1.73: –3.23 to –0.24; P ¼ 0.024) and the per-
cent decline per year doubled, increasing from 1.16% post-1972 to 2.64% post-2000. Results were similar for TSC, with a 62.3% overall
decline among unselected men (–4.70 million/year; –6.56 to –2.83; P < 0.001) in the adjusted meta-regression model. All results changed
only minimally in multiple sensitivity analyses.
WIDER IMPLICATIONS: This analysis is the first to report a decline in sperm count among unselected men from South/Central
America–Asia–Africa, in contrast to our previous meta-analysis that was underpowered to examine those continents. Furthermore, data
suggest that this world-wide decline is continuing in the 21st century at an accelerated pace. Research on the causes of this continuing de-
cline and actions to prevent further disruption of male reproductive health are urgently needed.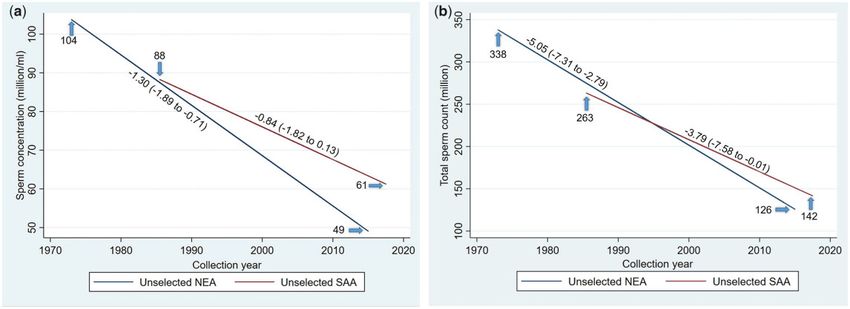
Review and meta-regression of trends in sperm count 3
Key words: human reproduction / male infertility / andrology / semen quality / sperm count / semen analysis / environmental effects /
epidemiology / systematic review / meta-analysis
..
Introduction .. Methods
..
In 2017, ‘Temporal Trends in Sperm Count: A Systematic Review
.. This systematic review and meta-regression analysis was conducted,
..
and Meta-Regression Analysis’ was published by this journal (Levine .. and the results reported, in accordance with Meta-analysis in
et al., 2017). That article, which was widely discussed and highly
..
.. Observational Studies in Epidemiology (Stroup et al., 2000)
cited, includes all eligible English-language publications in 1981– .. (Supplementary Table SI) and Preferred Reporting Items for
2013 that contained data on sperm count. We reported a very
..
.. Systematic reviews and Meta-Analysis guidelines (Liberati et al., 2009;
strong decline in sperm concentration (SC) and total sperm count .. Moher et al., 2009). Our research team included epidemiologists,
..
(TSC) in North America, Europe, Australia/New Zealand (hereaf- .. andrologists and a medical librarian. Our predefined protocol was de-
ter NEA) but too few studies have been published in South/ .. veloped following best practices (Borenstein et al., 2009; Higgins and
..
Central America, Asia and Africa (hereafter SAA) to draw a conclu- .. Green 2011; National Toxicology Program 2015) and informed by
sion about trends in those continents. We examined mean SC and ..
.. our previous study. Throughout, unless otherwise noted, the methods
TSC as a function of collection year, as approximated by the mid- .. of the current study are those employed and published in the previ-
year of the sample collection period. Because sample collection ..
.. ous study (Levine et al., 2017), including keywords and databases
preceded the year of publication by an average of 6 years, our .. searched, eligibility criteria and statistical methods.
results were already somewhat dated by the time we published our ..
..
analysis in 2017. Therefore, we conducted a new literature search ..
in the spring of 2020 to identify eligible studies published between .. Systematic review and study selection
..
1 January 2014 and 31 December 2019. Here, we report on global .. A comprehensive search of the PubMed/MEDLINE and EMBASE was
trends in SC and TSC in publications 1981 through 2019, which
.. conducted, to identify English-language publications that reported pri-
..
combines results of both searches and analyses. This expanded .. mary data on human sperm count, published in 2014–2019, i.e. from
analysis addresses two important questions. With increased sample
..
.. the last date included in our prior search through 2019. On 15 May
size, was a trend seen in South America, Africa and Asia? Did the .. 2020, we searched MEDLINE/PubMed and Embase (Excerpta Medica
trends we reported continue post-2011?
..
.. database) for peer-reviewed publications meeting our inclusion criteria.
Recognition of the importance of male reproductive function, .. Following the recommendation of the Cochrane Handbook for
..
and sperm count, has increased since 2017 (Levine et al., 2018; .. Systematic Reviews, we searched in title and abstract for both index
United Nations Human Rights Office of the High Commissioner, ..
.. (MeSH) terms and keywords and filtered out animal-only studies. We
2019). The economic and societal burden of male infertility is now .. used the MeSH term ‘sperm count’, which includes seven additional
widely recognized, as is the unequal burden of male infertility which ..
.. terms, and to increase sensitivity, we added 13 related keywords (e.g.
falls most heavily on low-income populations (Winters and Walsh, .. ‘sperm density’, ‘sperm concentration’).
2014; Hauser et al., 2015; Dupree, 2016; Skakkebaek et al., 2016). ..
.. All English-language studies that reported primary data on human
Increasingly strong evidence links reduced sperm count and concen- .. SC were considered eligible for abstract screening. We evaluated the
tration to increases in all-cause mortality and morbidity (Latif et al., ..
.. eligibility of all subgroups within a study. For example, in a case–con-
2017; Del Giudice et al., 2021; Ferlin et al., 2021). Links between ..
sperm count and infertility are well-recognized (Bonde et al., 1998;
.. trol study, the control group might have been eligible for inclusion
.. even though, based on our exclusion criteria, the case group was not.
Skakkebæk et al., 2022). Furthermore, the decline in sperm count is ..
paralleled by declines in testosterone and increases in testicular
.. We divided eligible studies into two fertility-defined groups: (i) stud-
.. ies of men unselected by fertility status, hereafter ‘Unselected’ (e.g.
cancer and male genital anomalies (Skakkebæk et al., 2022). In fact, ..
the decline in semen quality and male reproductive health has re-
.. young men unlikely to be aware of their fertility, such as young men
.. being screened for military service or college students) and (ii) studies
cently been described as a crisis (De Jonge and Barratt, 2019). ..
.. of men whose partners had born a child or whose partners were
Relative to declines in sperm counts, these latter trends are far ..
more difficult to document. There is currently no systematic collec- .. pregnant regardless of pregnancy outcome, hereafter ‘Fertile’. ‘Total’
.. refers to both groups.
tion of such data, making the examination of those trends difficult.
... A study was excluded if participants were selected based on: (i) in-
Therefore, an international group of scientists, including several of ..
the authors, has suggested the formation of a multidisciplinary mon- .. fertility or sub-fertility; (ii) their range of semen parameters (e.g. stud-
.. ies selecting normospermic men); and (iii) genital abnormalities,
itoring system for reproductive health indicators that would provide ..
ongoing surveillance of reproductive health outcomes (Le Moal .. diseases or medications. We also excluded studies limited to men
..
et al., 2016). .. with exposures that may affect fertility, such as an occupational expo-
The broad implications of a global decline in sperm count, the data .. sure, post-clinical trial intervention or smoking. Studies of candidates
..
gaps left unfilled by our prior analysis and the controversies surround- .. for vasectomy or semen donation were included only if semen quality
ing these issues warrant an up-to-date meta-analysis. This meta-
.. was not a criterion for men’s study participation. We excluded studies
..
analysis was conducted to address these aims. . that used non-standard methods for sperm collection (e.g. methods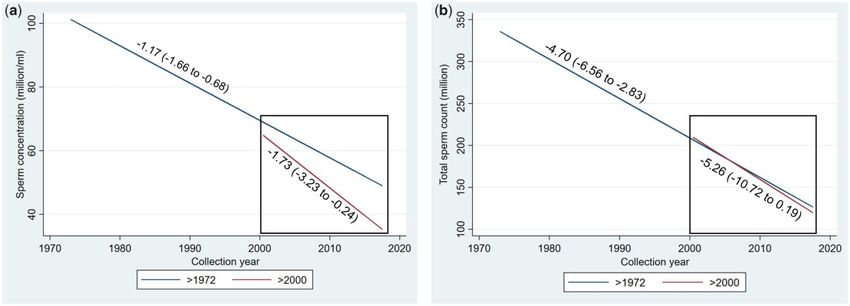
4 Levine et al.
..
other than masturbation) or counting methods other than hemocy- .. sample size. Beside a model for all men (Unselected plus Fertile), we
tometer and studies with fewer than 10 men. .. also ran a model stratified by fertility status.
..
First, the publication was either excluded or advanced to full-text .. Then, we used random-effects meta-regression to model both SC
screening based on the title and abstract. Any publication without an ... and TSC as linear functions of time, weighting estimates by the stan-
abstract was automatically referred for full-text screening. Second, we .. dard error (SE).
..
reviewed the full text and assigned it to exclusion (and categorized the .. In the meta-regression models, we controlled for a predetermined
reason for exclusion) or to data extraction. We then confirmed study
.. set of potential confounders: fertility group, age, abstinence time,
..
eligibility and identified multiple publications from the same study to .. whether semen collection and counting methods were reported, num-
.. ber of samples per man and indicators for exclusion criteria
ensure that estimates from the same population were not used more ..
than once. .. (Supplementary Table SII). The method used to determine sample vol-
.. ume was included when modeling TSC. In all meta-regression analyses,
..
Data extraction .. we included indicator variables to denote studies with more than one
.. SC/TSC estimate.
..
For each estimate, we extracted summary statistics on SC and TSC .. Several variables were imputed including mean SC (and TSC), as de-
(mean, standard deviation, minimum, maximum, median and percen- ..
.. scribed in our 2017 study. For example, for studies that reported me-
tiles), semen volume (mean and measured method), sample size, sam- .. dian (not mean) SC or TSC, we estimated the mean by adding the
ple collection years, data on covariates (fertility group, country, age, ..
.. average difference between the mean and median in studies for which
ejaculation abstinence time reported and per protocol, method of se- .. both were reported.
men collection, method of assessing of SC and semen volume, selec-
..
.. We included indicators in all models for imputed values. We in-
tion of population, study exclusion criteria and number of samples per .. cluded continental group (NEA or SAA) and fertility group
..
man). The range of permissible values, both for categorical and numer- .. (Unselected or Fertile), as variables in the model when applicable.
ical variables and information on data completeness were recorded. .. We ran several meta-regression models for both SC and TSC:
..
Data were extracted on the total population as well as on all eligible .. (i) basic, unadjusted model; (ii) adjusted model for all men; (iii) strati-
subgroups. .. fied by fertility; (iv) unselected men only with time continent interac-
..
.. tion; (v) all men with two interactions: time fertility and time
.. continent.
Quality control ..
.. These analyses were repeated for subsets of data collection to ex-
The current study followed the same protocol as used in the previous .. amine recent trends (>1972, >1985, >1995 and >2000).
study. For the new search, we used Covidence systematic review soft- ..
.. We conducted several sensitivity analyses: (i) adding cubic and qua-
ware for the process of screening the articles that were not available ..
for our prior search. In addition, one member of the research team
.. dratic terms for collection year in meta-regression analyses to assess
.. non-linearity; (ii) removing covariates one at a time from the model;
was replaced. Screening of this extensive systematic review was con- ..
.. (iii) excluding a specific group, i.e. the group with no information on
ducted by a team of eight reviewers (H.L., N.J., A.M.-A., J.M., .. age, for each covariate; (iv) replacing age group by mean age, excluding
D.W.-D., M.J., R.P., S.H.S.). As in our previous analysis, the screening ..
.. studies that did not report mean age; (v) adding a covariate for high
protocol was piloted and reviewers were trained by screening of 50 .. smoking prevalence (>30%); (iv) removing each continent one at a
abstracts by all reviewers followed by a comparison of results, resolu- ..
.. time; (vii) excluding studies with five or more data points to examine
tion of any inconsistencies and clarification of the protocol as needed. .. the influence of large studies; and (viii) removing studies with SEs
The same quality control process was followed for full-text screening
..
.. >20 million/ml.
and data extraction by all reviewers. All data were entered into digital .. All analyses were conducted using STATA version 14.1 (StataCorp).
..
spreadsheets with explicit permissible values (no open-ended entries) ..
to increase consistency. After data extraction, an additional round of ..
..
data editing and quality control of all studies was conducted by H.L. ..
and M.J. The process ensured that each study was evaluated by at
.. Results
..
least two different trained reviewers. .. Systematic review and summary statistics
..
.. Using PubMed/MEDLINE and Embase searches, we identified 2936
Statistical analysis ..
.. new publications meeting our criteria for abstract screening (Fig. 1). Of
We ran all models both on the data used in our 2017 study (for qual- ..
.. these, 151 duplicate records were removed and 1917 were excluded
ity control) and for the dataset including all years. In all models, the .. based on title or abstract screening. Full texts of the remaining 868
midpoint of the sample collection period was the independent variable
..
.. articles were reviewed for eligibility and 743 studies were excluded.
(‘collection year’) and mean SC (or TSC) was the dependent varia- .. Of the remaining 125 articles, 87 were excluded during data extraction
..
ble(s). Units were million/ml for SC and million for TSC (reported or .. through the second round of full-text screening; 44 of them were
defined as SC sample volume). All slopes denote unit change per .. multiple publications. The remaining 38 studies of semen samples from
..
calendar year, reported with 95% confidence intervals (CI). We also .. 14 233 men included 44 unique mean SC estimates that met the
reported values for the first and last years, and the % change/year. .. protocol criteria. Combining these new data with data from our
..
We first used simple linear regression models to estimate SC and .. previous meta-analysis, the current meta-analysis includes results from
TSC as functions of collection year, with each study weighted by
.. 223 studies, yielding 288 estimates based on semen samples collected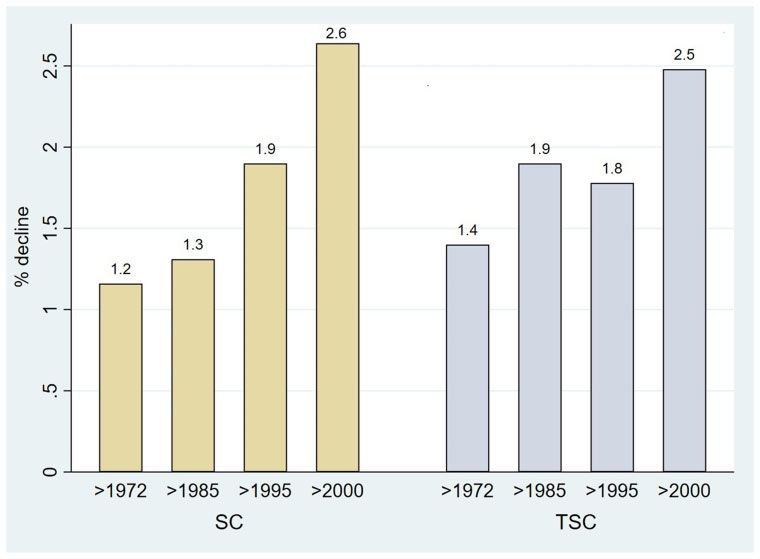
Review and meta-regression of trends in sperm count                                                                                               5

  Figure 1. PRISMA flow chart showing the selection of studies eligible for meta-regression analysis.

                                                                          ..
1973–2018 provided by 57 168 men. Data were available from 6 con-          ..     Unselected NEA, 35 (12%) were Unselected SAA, 81 (28%) were
tinents and 53 countries (complete list in Supplementary Table SIII and     ..    Fertile NEA and 54 (19%) were Fertile SAA. The number of estimates
                                                                             ..
Supplementary Fig. S1). Of the 288 estimates, 118 (41%) were                  .   from SAA increased by 29%.
6 Levine et al.
..
Data from the 223 publications included in the meta-analysis are .. et al., 2013; Mendiola et al., 2013; Redmon et al., 2013; Thilagavathi
available upon reasonable request through contact with corresponding .. et al., 2013; Valsa et al., 2013; Zalata et al., 2013; Zareba et al., 2013;
..
author (Abyholm, 1981; Fariss et al., 1981; Leto and Frensilli, 1981; .. Huang et al., 2014; Castiglione et al., 2014; Giagulli et al., 2014;
Wyrobek et al., 1981a,b; Aitken et al., 1982; Nieschlag et al., 1982; ... Kavitha and Malini, 2014; Liu et al., 2014; Mendiola et al., 2014; Tainio
Obwaka et al., 1982; Albertsen et al., 1983; Fowler and Mariano, .. et al., 2014; Evgeni et al., 2015; Franken, 2015; Hosen et al., 2015;
..
1983; Sultan Sheriff, 1983; Wickings et al., 1983; Asch et al., 1984; de .. Layali et al., 2015; Mohammed et al., 2015; Ramzan et al., 2015;
Castro and Mastrorocco, 1984; Fredricsson and Sennerstam, 1984; .. Romero-Otero et al., 2015; Tsao et al., 2015; Valsa et al., 2015;
..
Freischem et al., 1984; Ward et al., 1984; Ayers et al., 1985; Heussner .. Altintas et al., 2016; Karimian and Colagar, 2016; Malic Voncina et al.,
et al., 1985; Rosenberg et al., 1985; Aribarg et al., 1986; Comhaire .. 2016; Shirota et al., 2016; Malini, 2017; Mınguez-Alarcón et al., 2017;
..
et al., 1987; Kirei, 1987; Giblin et al., 1988; Kjaergaard et al., 1988; .. Pullar et al., 2017; Azad et al., 2018; Fanny et al., 2018; Inih et al.,
Mieusset et al., 1988, 1995; Jockenhovel et al., 1989; Sobowale and .. 2018; López-Espın et al., 2018; Lotti et al., 2018; Palani, 2018; Priskorn
..
Akiwumi, 1989; Svanborg et al., 1989; Zhong et al., 1990; Culasso .. et al., 2018; Recio-Vega et al., 2018; Ahmed et al., 2019; Bassey et al.,
et al., 1991; Dunphy et al., 1991; Gottlieb et al., 1991; Nnatu et al.,
.. 2019; Dhawan et al., 2019; Garcıa Rodrıguez et al., 2019; Lazzarino
..
1991; Pangkahila, 1991; Weidner et al., 1991; Levine et al., 1992; .. et al., 2019; Rodprasert et al., 2019; Antonio et al., 2020; Dias et al.,
Sheriff and Legnain, 1992; Ali et al., 1993; Arce et al., 1993; Bartoov
.. 2020).
..
et al., 1993; Fedder et al., 1993; Noack-Füller et al., 1993; World ..
..
Health Organization and Task Force on Methods for the Regulation of .. Simple linear models
Male Fertility, 1993; Hill et al., 1994; Rehan, 1994; Rendon et al., ..
1994; Taneja et al., 1994; Vanhoorne et al., 1994; Auger et al., 1995;
.. Combining results from all men, SC declined steeply (slope per year
.. –0.87 million/ml; 95% CI: –0.89 to –0.86; P < 0.001) between 1973
Cottell and Harrison, 1995; Figà-Talamanca et al., 1996; Fisch et al., ..
.. and 2018 when using simple linear models, unadjusted and weighted
1996; IrVine et al., 1996; Van Waeleghem et al., 1996; Vierula et al., .. by sample size (Supplementary Table SIV, Supplementary Fig. S2). For
1996; Vine et al., 1996; Auger and Jouannet, 1997; Jensen et al., 1997; ..
.. all men combined, SC declined by 0.93% per year and overall, by
Lemcke et al., 1997; Handelsman, 1997a,b; Chia et al., 1998; Muller .. 41.5% between 1973 and 2018. In a model stratified by fertility group,
et al., 1998; Naz et al., 1998; Gyllenborg et al., 1999; Kolstad et al., ..
.. the slope was much steeper for Unselected (–1.23; –1.25 to –1.20;
1999; Kuroki et al., 1999; Larsen et al., 1999; Purakayastha et al., .. P < 0.001) than for Fertile men (–0.30; –0.33 to –0.27; P < 0.001)
1999; Reddy and Bordekar, 1999; De Celis et al., 2000; Glazier et al., ..
.. (Supplementary Table SIV). A similar trend was seen for TSC when
2000; Mak et al., 2000; Selevan et al., 2000; Wiltshire et al., 2000; .. combining the two fertility groups (slope per year ¼ –2.80 million;
Zhang et al., 2000; Foppiani et al., 2001; Guzick et al., 2001; ..
.. –2.86 to –2.74; P < 0.001), and the slope was steeper for the
Hammadeh et al., 2001; Jørgensen et al., 2001, 2002, 2011, 2012; .. Unselected group (–3.77; –3.83 to –3.71; P < 0.001) (Supplementary
Kelleher et al., 2001; Lee and Coughlin, 2001; Patankar et al., 2001; ..
.. Table SIV, Supplementary Fig. S2). Semen volume did not change over
Tambe et al., 2001; Xiao et al., 2001; Costello et al., 2002; Junqing ..
et al., 2002; Kukuvitis et al., 2002; Luetjens et al., 2002; Punab et al., .. the study period (slope per year ¼ 0.0002 ml; –0.0001 to 0.0005;
.. P ¼ 0.249).
2002; Richthoff et al., 2002; Danadevi et al., 2003; de Gouveia Brazao ..
et al., 2003; Firman et al., 2003; Liu et al., 2003; Lundwall et al., 2003;
..
.. Meta-regression models for SC
Roste et al., 2003; Serra-Majem et al., 2003; Uhler et al., 2003; Xu ..
et al., 2003; Ebesunun et al., 2004; Rintala et al., 2004; Toft et al.,
.. In a basic meta-regression model for SC, in which estimates were
..
2004, 2005; Bang et al., 2005; Mahmoud et al., 2005; Muthusami and .. weighted by their SE but without covariate adjustment, slopes were
Chinnaswamy, 2005; O’Donovan, 2005; Tsarev et al., 2005, 2009;
.. slightly less steep than for the simple regression model, and with wider
..
Durazzo et al., 2006; Fetic et al., 2006; Giagulli and Carbone, 2006; .. CIs (slope per year –0.66 million/ml; 95% CI: –0.92 to –0.40;
Haugen et al., 2006; Iwamoto et al., 2006, 2013a,b; Pal et al., 2006;
.. P < 0.001). Covariate adjustment did not appreciably alter the slope
..
Yucra et al., 2006; Aneck-Hahn et al., 2007; Garcia et al., 2007; .. but widened the CI further (–0.59; –0.90 to –0.27; P < 0.001)
.. (Table I, betas for covariates in Supplementary Table SII).
Multigner et al., 2007; Plastira et al., 2007; Rignell-Hydbom et al., ..
2007; Wu et al., 2007; Akutsu et al., 2008; Bhattacharya, 2008; .. After stratifying by fertility group and adjusting for all covariates in-
..
Gallegos et al., 2008; Goulis et al., 2008; Jedrzejczak et al., 2008; .. cluding continental group, there was a strong decline in SC among un-
Kobayashi et al., 2008; Korrovits et al., 2008; Li and Gu, 2008; Lopez- .. selected men (–1.17; –1.66 to –0.68; P < 0.001) but not among fertile
..
Teijon et al., 2008; Paasch et al., 2008; Peters et al., 2008; Recabarren .. men (–0.11; –0.54 to 0.32; P ¼ 0.615) (Table I, Fig. 2). Using SC
et al., 2008; Recio-Vega et al., 2008; Saxena et al., 2008; Shine et al., .. model estimates of 101.2 million/ml in 1973 and 49.0 million/ml in
..
2008; Andrade-Rocha, 2009; Kumar et al., 2009, 2011; Rylander et al., .. 2018, SC declined among unselected men by 1.16% per year and
2009; Stewart et al., 2009; Vani et al., 2009, 2012; Verit et al., 2009; .. 51.6% overall (Table I).
..
Engelbertz et al., 2010; Hossain et al., 2010; Ortiz et al., 2010; Rubes .. In an adjusted meta-regression model among unselected men that
et al., 2010; Tirumala Vani et al., 2010; Al Momani et al., 2011; Auger .. included interaction by geographic group (P for interaction ¼ 0.44), the
..
and Eustache, 2011; Axelsson et al., 2011; Brahem et al., 2011; .. slope for Unselected NEA was –1.30 (–1.89 to –0.71; P < 0.001) and
Jacobsen et al., 2011; Khan et al., 2011; Linschooten et al., 2011; .. the slope for Unselected SAA was –0.84 (–1.82 to 0.13, P ¼ 0.088)
..
Venkatesh et al., 2011; Vested et al., 2011; Absalan et al., 2012; Al- .. (Table I, Fig. 3).
Janabi et al., 2012; Katukam et al., 2012; Mostafa et al., 2012;
.. In an adjusted meta-regression model, which included all men and
..
Nikoobakht et al., 2012; Rabelo-Junior et al., 2012; Splingart et al., .. two interaction terms [time fertility group (P ¼ 0.012) and time
2012; Bujan et al., 2013; Girela et al., 2013; Halling et al., 2013; Ji
.. continents (P ¼ 0.058)], declines were seen among Unselected NEAReview and meta-regression of trends in sperm count 7
Table I Sperm concentration (SC) and total sperm count (TSC) in first and last years of meta-regression analysis, adjusted for
continents and potential confounders,a with % change and slope per year: (i) total; (ii) stratified by fertility; (iii) unselected
men only with time continent interaction; (iv) two interactions: time fertility and time continent.
Model Category N First First year Last Last year %change/ Slope (95% CI),
(estimates) year SC (million/ml) year SC (million/ml) year million/ml/year
.............................................................................................................................................................................................................................
Total All men 288 1973 83.5 2018 57.1 –0.71 –0.59 (–0.90 to –0.27)
Stratified Unselected 153 1973 101.2 2018 49.0 –1.16 –1.17 (–1.66 to –0.68)
Fertile 135 1977 77.3 2017 72.8 –0.14 –0.11 (–0.54 to 0.32)
Unselected Unselected NEAb 118 1973 103.7 2015 49.1 –1.25 –1.30 (–1.89 to –0.71)
with interaction Unselected SAAb 35 1986 88.3 2018 61.2 –0.96 –0.84 (–1.82 to 0.13)
Two interactions Unselected NEAb 118 1973 100.3 2015 46.8 –1.27 –1.27 (–1.78 to –0.77)
Unselected SAAb 35 1986 75.8 2018 54.9 –0.86 –0.65 (–1.29 to –0.01)
Fertile NEA 81 1977 85.5 2017 65.1 –0.59 –0.50 (–1.00 to –0.01)
Fertile SAA 54 1978 71.5 2016 76.4 0.18 0.13 (–0.42 to 0.67)
Model Category N First First year Last Last year %change/ Slope (95% CI),
(estimates) Year TSC (million) year TSC (million) year million/year
.............................................................................................................................................................................................................................
Total All men 288 1973 297.4 2018 205.6 –0.69 –2.06 (–3.25 to –0.87)
Stratified Unselected 153 1973 335.7 2018 126.6 –1.40 –4.70 (–6.56 to –2.83)
Fertile 135 1977 305.8 2017 296.1 –0.08 –0.24 (–1.99 to 1.52)
Unselected Unselected NEAb 118 1973 337.9 2015 125.9 –1.49 –5.05 (–7.31 to –2.79)
with interaction Unselected SAAb 35 1986 263.2 2018 141.7 –1.44 –3.79 (–7.58 to –0.01)
Two interactions Unselected NEAb 118 1973 350.9 2015 153.3 –1.34 –4.71 (–6.53 to –2.88)
Unselected SAAb 35 1986 229.8 2018 173.0 –0.77 –1.78 (–4.10 to 0.55)
Fertile NEA 81 1977 303.8 2017 219.3 –0.69 –2.09 (–3.86 to –0.32)
Fertile SAA 54 1978 216.6 2016 250.2 0.40 0.87 (–1.11 to 2.85)
a
Meta-regression model, adjusted for continents, age, abstinence time, semen collection method reported, counting method reported, having more than one sample per men, indica-
tors for study selection of population and exclusion criteria (some vasectomy candidates, some semen donor candidates, exclusion of men with chronic diseases, exclusion by other
reasons not related to fertility, selection by occupation not related to fertility), whether collection year was estimated, whether arithmetic mean of SC was estimated, whether SE of
SC was estimated and indicator variable to denote studies with more than one estimate. Sperm concentration (SC) meta-regression models weighted by SC SE, adjusted for similar
covariates and method used to assess semen volume. Total sperm count (TSC) meta-regression models weighted by TSC SE, adjusted for similar covariates and method used to assess
semen volume.
b
NEA, North America–Europe–Australia; SAA, South/Central America–Asia–Africa.
(–1.27; –1.78 to –0.77; P < 0.001), Unselected SAA (–0.65; –1.29 to
.. In an adjusted meta-regression model, which included all men and
..
–0.01; P ¼ 0.045) and Fertile NEA (–0.50; –1.00 to –0.01; P ¼ 0.046) .. two interaction terms [time fertility group (P ¼ 0.013) and time
.. continents (P ¼ 0.015)], declines were seen among Unselected NEA
(Table I, Supplementary Fig. S3). ..
.. (–4.71; –6.53 to –2.88; P < 0.001), Unselected SAA (–1.78; –4.10 to
..
Meta-regression models for TSC .. 0.55; P ¼ 0.133) and Fertile NEA (–2.09; –3.86 to –0.32; P ¼ 0.021)
.. (Table I, Supplementary Fig. S3).
Overall, TSC trends were similar to those for SC. In an adjusted ..
meta-regression model for all men, there was a steep decline in TSC
..
.. Meta-regression models for recent periods
(slope per year –2.06 million, –3.25 to –0.87; P ¼ 0.001) (Table I). ..
.. We also restricted the analysis of unselected men (in all continents) to
After stratifying by fertility group and adjusting for all covariates in- ..
cluding continent, there was a strong decline in TSC among unselected .. recent time intervals (Table II, Fig. 2). Post-1995, the slope for SC was
.. somewhat steeper (–1.33; –2.41 to –0.26; P ¼ 0.016) and was steeper
men (–4.70; –6.56 to –2.83; P < 0.001) but not among fertile men ..
(–0.24; –1.99 to 1.52; P ¼ 0.788) (Table I, Fig. 2). Using TSC model .. still post-2000 (–1.73; –3.23 to –0.24; P ¼ 0.024). There was a marked
.. increase in the percent decline in SC per year in the recent period,
estimates of 335.7 million in 1973 and 126.6 million in 2018, SC de- ..
clined among unselected men by 1.40% per year and 62.3% overall
.. from 1.16% post-1972 to 2.64% post-2000 (Fig. 4). Post-2000, the
..
(Table I). .. slope for TSC (–5.26, –10.72 to 0.19; P ¼ 0.058) was also steeper
.. than that for post-1972 (Table II, Fig. 2).
In an adjusted meta-regression model among unselected men, in- ..
cluding interaction by geographic group (P for interaction ¼ 0.44), the ..
.. Sensitivity analyses
slope for Unselected NEA was –5.05 (–7.31 to –2.79; P < 0.001) and ..
the slope for Unselected SAA was –3.79 (–7.58 to –0.01, P ¼ 0.049) .. We performed multiple analyses to examine the sensitivity of results
..
(Table I, Fig. 3). . to assumptions about our model, linearity, influence of covariates and8 Levine et al.
Figure 2. Meta-regression models for mean sperm concentration (SC) and total sperm count (TSC) by collection year among
unselected men from all continents, adjusted for potential confounders, for the whole period and restricted to studies post
2000. (a) Sperm concentration. (b) Total sperm count. Meta-regression model weighted by sperm concentration (SC) SE, adjusted for continents,
age, abstinence time, semen collection method reported, counting method reported, having more than one sample per man, indicators for study
selection of population and exclusion criteria (some vasectomy candidates, some semen donor candidates, exclusion of men with chronic diseases,
exclusion by other reasons not related to fertility, selection by occupation not related to fertility), whether collection year was estimated, whether
arithmetic mean of SC was estimated, whether SE of SC was estimated and indicator variable to denote studies with more than one estimate. Total
sperm count (TSC) meta-regression models weighted by TSC SE, adjusted for similar covariates and method used to assess semen volume. SE,
standard error.
Figure 3. Meta-regression models for mean sperm concentration (SC) and total sperm count (TSC) by collection year with in-
teraction for continents among unselected men, adjusted for potential confounders. (a) Sperm concentration (SC). (b) Total sperm
count. NEA, North America–Europe–Australia; SAA, South/Central America–Asia–Africa. Meta-regression model weighted by sperm concentration
(SC) SE, adjusted for continents, age, abstinence time, semen collection method reported, counting method reported, having more than one sample
per man, indicators for study selection of population and exclusion criteria (some vasectomy candidates, some semen donor candidates, exclusion of
men with chronic diseases, exclusion by other reasons not related to fertility, selection by occupation not related to fertility), whether collection year
was estimated, whether arithmetic mean of SC was estimated, whether SE of SC was estimated and indicator variable to denote studies with more
than one estimate. Total sperm count (TSC) meta-regression models weighted by TSC SE, adjusted for similar covariates and method used to assess
semen volume. SE, standard error.Review and meta-regression of trends in sperm count 9 Table II Stratified meta-regression modela for mean sperm concentration (SC) and mean total sperm count (TSC) among unselected men, by periods. Period N First First year Last Last year % change/ Slope (95% CI), (years) (estimates) year SC (million/ml) year SC (million/ml) year million/ml/year ............................................................................................................................................................................................................................. >1972 153 1973 101.2 2018 49.0 –1.16 –1.17 (–1.66 to –0.68) >1985 131 1985 82.3 2018 47.1 –1.31 –1.08 (–1.68 to –0.49) >1995 89 1995 70.1 2018 40.1 –1.90 –1.33 (–2.41 to –0.26) >2000 60 2000 65.6 2018 35.3 –2.64 –1.73 (–3.23 to –0.24) Period N First First year Last Last year % change/ Slope (95% CI), (years) (estimates) year TSC (million) year TSC (million) year million/year ............................................................................................................................................................................................................................. >1972 153 1973 335.7 2018 126.6 –1.40 –4.70 (–6.56 to –2.83) >1985 131 1985 275.2 2018 105.6 –1.90 –5.22 (–7.62 to –2.82) >1995 89 1995 231.1 2018 138.5 –1.78 –4.11 (–8.21 to –0.02) >2000 60 2000 212.1 2018 120.0 –2.48 –5.26 (–10.72 to 0.19) a Stratified meta-regression model, adjusted for continents, age, abstinence time, semen collection method reported, counting method reported, having more than one sample per men, indicators for study selection of population and exclusion criteria (some vasectomy candidates, some semen donor candidates, exclusion of men with chronic diseases, exclusion by other reasons not related to fertility, selection by occupation not related to fertility), whether collection year was estimated, whether arithmetic mean of SC was estimated, whether SE of SC was estimated and indicator variable to denote studies with more than one estimate. Sperm concentration (SC) meta-regression models weighted by SC SE, adjusted for simi- lar covariates and method used to assess semen volume. Total sperm count (TSC) meta-regression models weighted by TSC SE, adjusted for similar covariates and method used to as- sess semen volume. Figure 4. Percent of decline according to periods, for mean sperm concentration (SC) and total sperm count (TSC) among un- selected men using stratified meta-regression model. Stratified meta-regression model weighted by sperm concentration (SC) SE, adjusted for continents, age, abstinence time, semen collection method reported, counting method reported, having more than one sample per man, indica- tors for study selection of population and exclusion criteria (some vasectomy candidates, some semen donor candidates, exclusion of men with chronic diseases, exclusion by other reasons not related to fertility, selection by occupation not related to fertility), whether collection year was esti- mated, whether arithmetic mean of SC was estimated, whether SE of SC was estimated and indicator variable to denote studies with more than one estimate. Total sperm count (TSC) stratified meta-regression models weighted by TSC SE, adjusted for similar covariates and method used to assess semen volume. SE, standard error.
10 Levine et al.
..
imputation of missing data. Results from sensitivity analyses are only .. The distribution of contributing countries has changed since our
shown here for SC in unselected men (slope ¼ –1.17 million/ml/year .. 2017 analysis. The new analysis appreciably increases the number
..
in the main model). In all sensitivity analyses (except one elaborated .. of studies from SAA. With this increase in sample size, there is
hereafter), there was a strong (>1.0 million/ml/year) decline in SC in ... now adequate power to examine trends in SC and TSC in those
the Unselected group, with P < 0.01. .. continents. This analysis provides strong evidence, for the first
..
Adding a quadratic or cubic function of year to meta-regression .. time, of an appreciable decline in sperm counts among unselected
model did not substantially change the association between year and .. men from SAA. Importantly, this analysis also demonstrates an ac-
..
SC or improve the model fit: coefficient for the quadratic term: 0.04; .. celerated decline in SC and TSC post-2000. In summary, this up-
95% CI: –0.07 to 0.08, P ¼ 0.135; for the cubic term 0.0005; 95% CI:
.. date confirms, extends and strengthens the results of our 2017
..
–0.0007 to 0.001, P ¼ 0.086). .. analysis.
For each covariate, we conducted two sensitivity analyses: (i) re-
..
..
moving the covariate and (ii) by excluding a specific group, for each co- .. Comparison to prior studies
..
variate (Supplementary Table SV). Excluding 47 estimates with no data .. Table III compares basic characteristics and results of the current study
on mean age and adjusting for mean age instead of age group, yielded ..
.. with those of Carlsen et al. (1992), Swan et al. (2000) and Levine et al.
a slope of –1.27 million/ml/year (–1.86 to –0.68; P < 0.001), which is .. (2017), studies that together include data collected over more than
similar to the main model. The sensitivity analysis which showed a ..
.. 80 years. It is notable that although search and statistical analysis meth-
more than minimal change in slope was the exclusion of 39 estimates .. ods have become more sophisticated, and the distribution of studies
with no information on age, which yielded a slightly diminished slope ..
.. has changed (with the proportion from SAA increasing), these slopes
of –0.94 million/ml/year (–1.51 to –0.37, P ¼ 0.002). .. are remarkably consistent.
The proportion of smokers was reported in only 26.0% of studies
..
.. Comparing the current analysis with Levine et al. (2017), we note
and in 18.1% of studies of unselected men. To examine this variable, .. that the methods for searching and screening the literature, which are
we ran a sensitivity analysis including a covariate for ‘high proportion
..
.. well documented in both, have not changed, nor have the analytic
of smokers’ (> 30%), and the slopes changed only slightly (–1.20 mil- .. methods.
..
lion/ml, –1.70 to –0.71; P < 0.001). .. In both our current and past analyses, we excluded studies that
Results for Unselected men did not materially change with additional .. selected men based on criteria that were likely to affect sperm
..
sensitivity analysis, by exclusion of estimates from any specific .. count (e.g. requiring a minimum sperm count, or men’s participation
continent (Supplementary Table SVI). Slopes were also robust after .. in a sperm bank) with one exception. Studies of fertile men were in-
..
excluding the four studies with five or more data points (–1.04, –1.55 .. cluded as a separate stratum (denoted Fertile). This group of studies
to –0.53; P < 0.001), or excluding five estimates with a SE of SC .. includes fathers or partners of pregnant women. Thus, these men
..
> 20 million/ml (1.11, –1.61 to –0.62; P < 0.001). .. had either themselves helped to conceive a pregnancy, or the preg-
Due to a typo in the value extracted for Rubes et al. (2010) in the
..
.. nancy was the result of in vitro fertilization (IVF). The proportion of
previous meta-analysis, we repeated the analysis without this study as .. IVF births has increased over the study period of this analysis, with
well as with the corrected value. The results did not materially change.
..
.. eight million IVF babies born worldwide since the world’s first IVF
.. birth in 1978 (European Society of Human Reproduction and
..
.. Embryology, 2018). Among the 135 studies categorized as Fertile in
.. this analysis, only 27.4% explicitly excluded pregnancies conceived
Discussion ..
.. by IVF.
The results of the present study extend those of our 2017 meta- .. Here, as in our 2017 analysis, we stratified countries into two
analysis. As further elaborated below, the new data allow for new
..
.. groups, because of the potential for confounding of trends by geogra-
analyses and new results. We provide strong evidence, for the first .. phy. In the past, we referred to these two groups of countries as
..
time, of a decline in sperm counts among men from South/Central .. ‘Western’ and ‘Other’. Though not our intent, it became apparent
America, Asia, and Africa, as well as a world-wide decline in the 21st .. that these terms had the potential to be misinterpreted and become
..
century, with data suggesting that the pace of this decline has .. politicized. Therefore, we now refer to these two groups of studies by
accelerated. .. the continent in which data were collected: ‘NEA’ (North America,
..
.. Europe, and Australia) and ‘SAA’ (South/Central America, Africa, and
Key findings .. Asia). We present results stratified by continental group, as well as
..
In our prior systematic review and meta-analysis (Levine et al., 2017),
.. combined.
..
we reported a marked, continuing decline in both SC and TSC in ..
.. Other issues
North America, Europe and Australia based on samples collected be- ..
tween 1973 and 2011. What is new in the current analysis? .. Could the declines we report be simply the result of a random de-
..
Our current analysis, the largest ever to examine temporal trends in .. crease in a pattern of fluctuations (termed ‘sperm variability’)
sperm counts, extends both the study period and the number of esti- .. (Boulicault et al., 2021)? The continued decline demonstrated in this,
..
mates. This new analysis includes seven additional years of sample col- .. and earlier, meta-analyses provide strong evidence that this is not the
lection and adds 44 estimates to the 244 included in the earlier .. case. If, in fact, the declines we are reporting were merely the result
..
analysis. It is therefore both more robust and more temporally .. of random fluctuation in sperm count, we would expect, on average,
relevant.
.. some percent of studies to report no change and the remainder toReview and meta-regression of trends in sperm count 11 Table III Characteristics and results of fitting a simple linear regression model (without adjustment, weighted by sample size) for trends of sperm concentration in the current study compared to previous studies. First author (publication year) Carlsen et al. (1992) Swan et al. (2000) Levine et al. (2017) Levine et al. (2022), current paper ............................................................................................................................................................................................................................. Publication years 1938–1990 1934–1996 1981–2013 1981–2019 Number of studies 61 101 185 223 Number of countries 20 28 50 53 Fertility group: N (%) Unselected 22 (36%) 50 (50%) 140 (57%) 153 (53%) Fertile 39 (64%) 51 (50%)a 104 (43%) 135 (47%) Continents: N (%) NEAb 45 (74%) 78 (77%) 175 (72%) 199 (69%) SAA 16 (26%) 23 (23%) 69 (28%) 89 (31%) Slope –0.93 –0.94 –0.70 –0.87 P-value
12 Levine et al.
..
both those whose partner has conceived without medical assistance ..
..
Acknowledgements
and with medical assistance, the fraction of which varied by time and lo-
.. We thank Alexandria Albert for her assistance in the literature review.
cation. Second, men with lower semen quality are underrepresented ..
among fertile men. Changes in the proportion of fertile men in the pop- ...
ulation over time could lead to a selection bias in the Fertile group. In ..
..
contrast, the Unselected group is not prone to such selection bias. .. Authors’ roles
It is also possible that men providing a semen sample differ from those
..
.. H.L. had full access to all the data and takes responsibility for the integ-
who do not. We previously studied this important question by comparing ..
testosterone and Inhibin B levels in unselected men (potential military
.. rity of the data and the accuracy of the data analysis. Study concept
..
recruits undergoing a compulsory routine physical exam to determine .. and design: H.L. and S.H.S. Search strategy design and execution: H.L.
.. and R.P. Acquisition, analysis or interpretation of data: H.L., N.J.,
their fitness for military service) who agreed to deliver a semen sample to ..
those in men who only agreed to give a blood sample. In both groups of .. A.M.-A., J.M., D.W.-D., M.J., R.P. and S.H.S. Drafting of the manu-
.. script: H.L., S.H.S. and M.J. Critical revision of the manuscript for im-
men, the hormone levels were similar (Andersen et al., 2000). Therefore, ..
recruitment bias is unlikely in studies of unselected men. .. portant intellectual content: H.L., N.J., A.M.-A, J.M., D.W.-D., M.J.,
..
As in our prior analysis, we included only English-language publica- .. R.P. and S.H.S. Statistical analysis: H.L. and M.J. Administrative, techni-
tions, which was unavoidable given the size of the task and the limited
.. cal or material support: H.L., R.P., S.H.S. and M.J. Study supervision:
..
size of our study team. However, of the 2936 publications identified .. H.L. and S.H.S.
through our database searches in 2020, only 49 were excluded be-
..
..
cause of language. ..
..
In addition, it would be interesting to explore trends in sperm count .. Funding
in a specific continent or even within countries and sub-populations. ..
.. We gratefully acknowledge financial support from The Grantham
However, we had inadequate statistical power to examine this ques- ..
tion at a finer geographic level. Repeated studies on semen quality in .. Foundation for the Protection of the Environment. None of the funding
..
specific populations would complement the current study by providing .. sources played a role in the design and conduct of the study; collection,
information about local trends.
.. management, analysis and interpretation of the data; preparations, re-
..
.. view or approval of the manuscript; or decision to submit the manu-
..
Conclusion and wider implications .. script for publication. Anderson Martino-Andrade is a scholarship
.. recipient from the National Council for Scientific and Technological
Our new data and analyses confirm our prior findings of an apprecia- ..
.. Development (CNPq, Brazil).
ble decline in sperm count between 1973 and 2018 among men from ..
North America, Europe and Australia and support a decline among ..
unselected men from South/Central America, Africa and Asia. This ..
..
decline has continued, as predicted by our prior analysis, and has be- ..
..
Conflict of interest
come steeper since 2000. This substantial and persistent decline is ..
.. All authors declare they have no conflict of interest.
now recognized as a significant public health concern. In 2018, a group
..
of leading clinicians and scientists called for governments to acknowl- ..
edge decreased male fertility as a major public health problem and to ..
.. References
recognize the importance of male reproductive health for the survival ..
of the human (and other) species (Levine et al., 2018). Research on ..
.. Abyholm T. An andrological study of 51 fertile men. Int J Androl
the causes of this continuing decline and an immediate focused re- .. 1981;4:646–656.
sponse to prevent further disruption of male reproductive health are
..
.. Ahmed FK, Memon AS, Khan AM, Burney I, Bano K. Effect of BMI
needed. .. on semen parameters in male infertility in tertiary care hospital of
We hope that the new evidence provided here will receive atten-
..
.. Karachi. Natl Editor Advis Board 2019;30:104.
tion not only from clinicians and scientists, but also from decision- ..
.. Aitken RJ, Best FS, Richardson DW, Djahanbakhch O, Lees MM.
makers and the general public. .. The correlates of fertilizing capacity in normal fertile men. Fertil
..
.. Steril 1982;38:68–76.
.. Aitken RJ. The changing tide of human fertility. Hum Reprod 2022;37:
..
Supplementary data .. 629–638.
.. Akutsu K, Takatori S, Nozawa S, Yoshiike M, Nakazawa H,
Supplementary data are available at Human Reproduction Update ..
online.
.. Hayakawa K, Makino T, Iwamoto T. Polybrominated diphenyl
..
.. ethers in human serum and sperm quality. Bull Environ Contam
.. Toxicol 2008;80:345–350.
..
.. Al-Janabi AS, Al-Mehdawi FA, Al-Lami MQ. Relationship of seminal
Data availability .. biochemical parameters and serum reproductive hormones with
..
The data underlying this article will be shared on reasonable request .. sperm function tests in asthenospermic patients. Jordan Med J
to the corresponding author.
.. 2012;46:97–107.Review and meta-regression of trends in sperm count 13
..
Al Momani W, Abu Shaqra QM, Wahed AA. Relationship between .. Bang AK, Carlsen E, Holm M, Petersen JH, Skakkebaek NE,
the recovery of aerobic bacteria from semen and male infertility in .. Jorgensen N. A study of finger lengths, semen quality and sex hor-
..
Jordan. Jordan Med J 2011;45:62–69. .. mones in 360 young men from the general Danish population.
Albertsen PC, Chang TS, Vindivich D, Robinson JC, Smyth JW. A .. Hum Reprod 2005;20:3109–3113.
..
critical method of evaluating tests for male infertility. J Urol 1983; .. Bartoov B, Eltes F, Pansky M, Lederman H, Caspi E, Soffer Y.
130:467–475.
.. Estimating fertility potential via semen analysis data. Hum Reprod
..
Ali ST, Shaikh RN, Siddiqi NA, Siddiqi PQ. Semen analysis in insulin- .. 1993;8:65–70.
dependent/non-insulin-dependent diabetic men with/without neu-
.. Bassey IE, Isong KP, Esiere KUS, Essien OE, Udoh AE, Akpan UO.
..
ropathy. Arch Androl 1993;30:47–54. .. Seminal Oxidative Stress Markers, Calcium, Magnesium, and
Altintas R, Ediz C, Celik H, Camtosun A, Tasdemir C, Tanbek K,
.. Semen Profile of Infertile Diabetic and Nondiabetic Nigerian Men.
..
Tekin S, Colak C, Alan C. The effect of varicocoelectomy on the .. Int J Appl Basic Med Res 2019;9:159–164.
..
relationship of oxidative stress in peripheral and internal spermatic .. Bhattacharya SM. Association of various sperm parameters with
vein with semen parameters. Andrology 2016;4:442–446. .. unexplained repeated early pregnancy loss–which is most impor-
..
Andersen AA, Jørgensen N, Andersson A, Skakkebæk NE, Jensen .. tant? Int Urol Nephrol 2008;40:391–395.
TK, Keiding N, Swan SH, Berg G. Serum levels of testosterone do .. Bonde JP, Ernst E, Jensen TK, Hjollund NH, Kolstad H, Henriksen
..
not provide evidence of selection bias in studies of male reproduc- .. TB, Scheike T, Giwercman A, Olsen J, Skakkebaek NE. Relation
tive health. Epidemiology 2000;11:232–234. .. between semen quality and fertility: a population-based study of
..
Andrade-Rocha FT. Colonization of Gardnerella vaginalis in semen of .. 430 first-pregnancy planners. Lancet 1998;352:1172–1177.
infertile men: prevalence, influence on sperm characteristics, rela- .. Borenstein M, Hedges LV, Higgins J, Rothstein HR. Introduction to
..
tionship with leukocyte concentration and clinical significance. .. Meta-Analysis. Chichester: Wiley, 2009.
Gynecol Obstet Invest 2009;68:134–136. .. Boulicault M, Perret M, Galka J, Borsa A, Gompers A, Reiches M,
..
Aneck-Hahn NH, Schulenburg GW, Bornman MS, Farias P, de Jager .. Richardson S. The future of sperm: a biovariability framework for
C. Impaired semen quality associated with environmental DDT ex-
.. understanding global sperm count trends. Hum Fertil 2021;9:1–15.
..
posure in young men living in a malaria area in the Limpopo .. doi: 10.1080/14647273.2021.1917778.
Province, South Africa. J Androl 2007;28:423–434.
.. Brahem S, Mehdi M, Elghezal H, Saad A. The effects of male aging on se-
..
Antonio L, Priskorn L, Nordkap L, Bang AK, Jensen TK, Skakkebaek NE, .. men quality, sperm DNA fragmentation and chromosomal abnormali-
Petersen JH, Vanderschueren D, Jørgensen N. Bone mineral density is
.. ties in an infertile population. J Assist Reprod Genet 2011;28:425–432.
..
preserved in men with idiopathic infertility. Andrology 2020;8:315–322. .. Bujan L, Walschaerts M, Moinard N, Hennebicq S, Saias J, Brugnon
..
Arce JC, De Souza MJ, Pescatello LS, Luciano AA. Subclinical altera- .. F, Auger J, Berthaut I, Szerman E, Daudin M et al. Impact of che-
tions in hormone and semen profile in athletes. Fertil Steril 1993; .. motherapy and radiotherapy for testicular germ cell tumors on
..
59:398–404. .. spermatogenesis and sperm DNA: a multicenter prospective study
Aribarg A, Kenkeerati W, Vorapaiboonsak V, Leepipatpaiboon S, .. from the CECOS network. Fertil Steril 2013;100:673–680.
..
Farley TM. Testicular volume, semen profile and serum hormone .. Carlsen E, Giwercman A, Keiding N, Skakkebaek NE. Evidence for
levels in fertile Thai males. Int J Androl 1986;9:170–180. .. decreasing quality of semen during past 50 years. Br Med J 1992;
..
Asch RH, Fernandez EO, Siler-Khodr TM, Pauerstein CJ. Peptide and .. 305:609–613.
steroid hormone concentrations in human seminal plasma. Int J .. Chia SE, Tay SK, Lim ST. What constitutes a normal seminal analysis?
..
Fertil 1984;29:25–32. .. Semen parameters of 243 fertile men. Hum Reprod 1998;13:
Auger J, Eustache F. Second to fourth digit ratios, male genital devel- .. 3394–3398.
..
opment and reproductive health: a clinical study among fertile men .. Castiglione R, Salemi M, Vicari LO, Vicari E. Relationship of semen
and testis cancer patients. Int J Androl 2011;34:e49–e58.
.. hyperviscosity with IL-6, TNF-a, IL-10 and ROS production in
..
Auger J, Jouannet P. Evidence for regional differences of semen qual- .. seminal plasma of infertile patients with prostatitis and prostato-
ity among fertile French men. Federation Francaise des Centres
.. vesiculitis. Andrologia 2014;46:1148–1155.
..
d’Etude et de Conservation des Oeufs et du Sperme humains. .. Comhaire FH, Vermeulen L, Schoonjans F. Reassessment of the ac-
Hum Reprod 1997;12:740–745.
.. curacy of traditional sperm characteristics and adenosine triphos-
..
Auger J, Kunstmann JM, Czyglik F, Jouannet P. Decline in semen qual- .. phate (ATP) in estimating the fertilizing potential of human semen
..
ity among fertile men in Paris during the past 20 years. N Engl J .. in vivo. Int J Androl 1987;10:653–662.
Med 1995;332:281–285. .. Costello MF, Sjoblom P, Haddad Y, Steigrad SJ, Bosch EG. No decline
..
Axelsson J, Rylander L, Rignell-Hydbom A, Giwercman A. No secular
... in semen quality among potential sperm donors in Sydney, Australia,
trend over the last decade in sperm counts among Swedish men .. between 1983 and 2001. J Assist Reprod Genet 2002;19:284–290.
from the general population. Hum Reprod 2011;26:1012–1016. .. Cottell E, Harrison RF. The value of subcellular elemental analysis in
..
Azad N, Nazarian H, Nazari L, Novin MG, Piryaei A, Heidari MH, .. the assessment of human spermatozoa. Hum Reprod 1995;10:
Farahani RM, Sadjadpour SS. Evaluation of PAWP and PLCf ex- .. 3186–3189.
..
pression in infertile men with previous ICSI fertilization failure. Urol .. Culasso F, Lenzi A, Favilli S, Dondero F. Statistical analysis in androl-
J 2018;15:38–43. .. ogy. Arch Androl 1991;26:163–172.
..
Ayers JW, Komesu Y, Romani T, Ansbacher R. Anthropomorphic, .. Danadevi K, Rozati R, Reddy PP, Grover P. Semen quality of Indian
hormonal, and psychologic correlates of semen quality in
.. welders occupationally exposed to nickel and chromium. Reprod
..
endurance-trained male athletes. Fertil Steril 1985;43:917–921. . Toxicol 2003;17:451–456.You can also read