Temporal Analysis of Worldwide War
←
→
Page content transcription
If your browser does not render page correctly, please read the page content below
Temporal Analysis of Worldwide War

                                                               Devansh Bajpai and Rishi Ranjan Singh

                                                       Department of Electrical Engineering and Computer Science
                                                                 Indian Institute of Technology, Bhilai
                                                                          Chhattisgarh, India.
arXiv:2107.01098v1 [econ.GN] 27 Jun 2021

                                                                 {devanshb,rishi}@iitbhilai.ac.in

                                                 Abstract. Analysis of wars and conflicts between regions has been an
                                                 important topic of interest throughout the history of humankind. In the
                                                 latter part of the 20th century, in the aftermath of two World Wars
                                                 and the shadow of nuclear, biological, and chemical holocaust, more was
                                                 written on the subject than ever before. Wars have a negative impact on a
                                                 country’s economy, social order, infrastructure, and public health. In this
                                                 paper, we study the wars fought in history and draw conclusions from
                                                 that. We explore the participation of countries in wars and the nature of
                                                 relationships between various countries during different timelines. A big
                                                 part of today’s wars is fought against terrorism. Therefore, this study
                                                 also attempts to shed light on different countries’ exposure to terrorist
                                                 encounters and analyses the impact of wars on a country’s economy in
                                                 terms of change in GDP.

                                           Keywords: Temporal Network Analysis, War Networks, Data Visualization

                                           1   Introduction
                                           Wars are one of the most important factors in deciding the state of the world.
                                           These are the major turning points in any country or empire’s history. Sev-
                                           eral literature study about cause [19,12,17], damage [18,9] and outcomes [16,21]
                                           associated with interstate and civil wars. In the network of military alliances,
                                           wars and international trade, the relation between the international trade and
                                           wars happening among the countries have been studied [10,13]. In [14], authors
                                           have done a neural network based analysis of militarized disputes for a timeline
                                           from 1885 till 1992. Network theoretic analysis for international relations is done
                                           in [10]. A similar work to this paper [11], analysed temporal network of inter-
                                           national relations based on the wars fought between 1816 and 2007. Since the
                                           events are historical we already know the facts. Therefore, it becomes easier to
                                           connect the reported results with the cause that triggered it.
                                               In this paper, we carry out a temporal analysis of the wars that have been
                                           fought in the history and report the inter-country relationships during different
                                           timelines. We focus only on the wars fought after 1500 CE due to availability
                                           of data and with the assumption that wars fought before 1500 CE might have
                                           only minor effects on the present inter-country relationships. We use temporal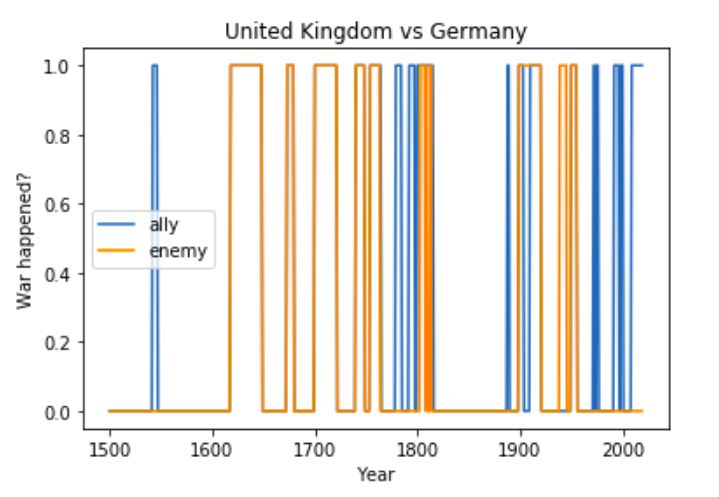
2       Bajpai and Singh

multi-graph to analyze the wars fought during 1500-2020 timeline. Some basic
graph properties are used for the analysis of temporal data. The distribution of
wars over the timeline, countries participating in most of the wars in different
timelines, rival relationship between countries, countries which fought most wars
along the same side during different timelines are few of the focal points of this
study. The relevant statistics and crucial conclusions are reported. Some of the
major events related to wars in the history are marked and also mapped to
respective roots and causes. Terrorist organizations are also considered as nodes
in the temporal graphs to analyze the terrorist activities and encounters with
different countries. Finally, the impact of wars on a country’s economy has been
studied in terms of change in GDP.

2     Data Collection

One of the main reasons for limited related research is the limited availability
of data-sets. A data-set maintained by Sarkees and Wayman[22] covers the wars
from 1816 - 2007 timeline. It only covers a small portion of time-line that we
plan to cover. Their study also did not cover the impact of wars on economy
of countries. Therefore, we create a data-set for more wider timeline which we
collect based on the data available on Wikipedia pages [1]. These set of pages
list war history of 165 different countries. Each country has a different page
listing wars and conflicts that the country has participated in. The temporal
multi-graph was built based on the data available on these pages. Requests and
Beautiful Soup libraries available with Python3 are used for scraping the web
pages. These libraries can fetch the content written inside HTML tags. A python
script is used which processes every country’s page and scrapes the details of the
wars that country has participated in. Most of the pages have the same format
and contain information such as, name of wars, countries participated in wars
and timelines of wars. The raw data from most of the pages is retrieved and
stored in a CSV file. Next, the raw data collected in CSV file is used to create
a temporal multi-graph from it.
     The MPD [4,8,7,5,3,23,20,15,2,6] is a freely available excel spread-sheet (Mad-
dison, 2016) that provides per capita income for 184 countries upto 2016 CE.
We have used the MPD data to study the impact of wars on country’s economic
growth. The data for years 1850-2016 has been used since most of the values
were missing for years before 1850.

2.1   Challenges in Network Formation

Out of 165 around 25 pages had a different format. The difference was in the
formatting of available data. Since the scraping script is automated for general
format, therefore, it failed to process those 25 pages. After some further modifi-
cations in the script and manually writing some entries directly in CSV file, the
complete data was collected.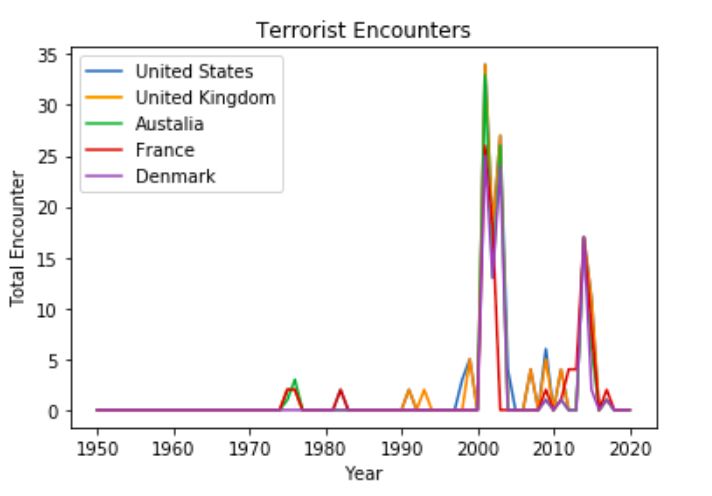
Temporal Analysis of Worldwide War        3

     Entries in the CSV file with different formats made it difficult to directly
read data from the CSV file and create the network. For example, different for-
mats used for representing timeline shows why temporal network could not be
made directly: 1948, 1948-1948, May 1948 September 1948, 5th May 1948-9th
September 1948. 18th century, Early 17th century to 19th century.
A data processing script is used to process each input and convert it into a stan-
dard format. Python’s regular expression library RE and some string processing
are used in this script. Next, an integer id is assigned to each opponent, as well
as a node is added for it and the adjacency list is created.
     Some countries are known by many names and a separate node was created
for all of them. For example, Argentina was mentioned as: Argentine Repub-
lic, Argentine Armed Forces, Argentine Air Force, Exiled Argentines, Argentine
Army, Argentine Navy, Argentine Unitarians, Government of Argentina and Ar-
gentine Confederation i.e. 9 different names. To counter this issue, another pro-
cessing layer was used before assigning an id to an opponent as well as adding
a node for it, which replaced each opponent’s name from a map entry. Map
contained standard names for countries which were present with multiple names
in our data-set. The map was created manually after observing entries in the
data-set.

3   Network Description

Nodes in the network represent the fighting entity which could be a nation(e.g.
India), an empire (e.g. Ottoman empire), countries or empires which existed
in history (e.g. Saxony), terrorist organisations (e.g. ISIS), inter-governmental
country alliances (e.g. NATO). Edges of the network represent the wars fought
between nodes. Network is in the form of a temporal multi-graph with a total
of 3000 nodes and 27721 edges. The average degree of the graph, considering
edges over the whole timeline, is 18.5. The maximum degree is 1321 and the
minimum degree is 1. Here, the degree of a node represents the number of wars
that country/empire/terrorist organization was a part of.

                  Fig. 1: Degree Distribution of The Network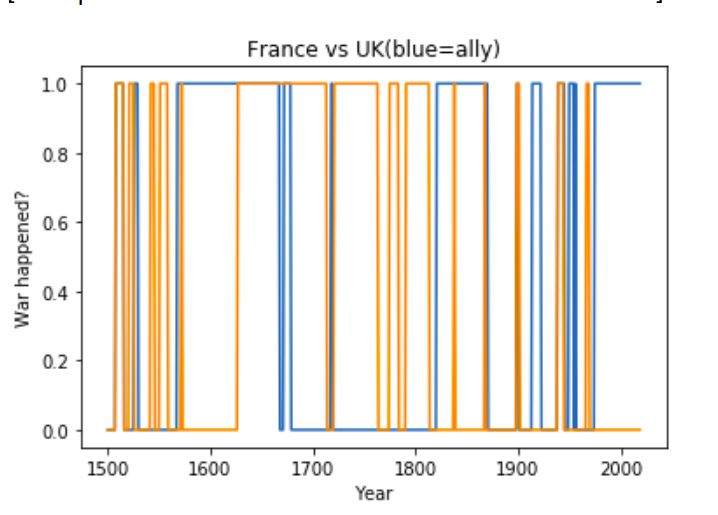
4 Bajpai and Singh
In Figure 1, the degree distribution has been plotted, where the x-axis rep-
resent the degree of a node, i.e., the number of wars a country/empire/terrorist
organization was a part of. The y-axis denotes the number of nodes with degree
x, i.e., the number of countries/empires/ terrorist organizations with x number
of war participation.
Table 1: Degree Distribution
Total Nodes 3000
Number of nodes with degree 1 682
Number of nodes with degree ≤ 10 2205
Number of nodes with degree ≤ 50 2832
Number of nodes with degree ≤ 100 2896
Number of nodes with degree ≤ 300 2975
Number of nodes with degree ≥ 301 25
Degree distribution of the network in the presence of all edges is skewed. The
degree distribution curve follows power law. Table 1 summarises the cumulative
degree for some of degree values. It is clear from the table that only 0.833%
of the total number of node have more than 300. 73.5% of the nodes are with
at most 10 degree. Very few entities have been there that have been engaging
in a lot many number of wars. A large number of countries/empires/ terrorist
organizations do not participate in several wars.In next section, we identify these
nodes with high degree over different timelines.
4 Results and Discussion
In this section, we note down all the statistical findings as well as conclusions
drawn from these over the considered timeline.
4.1 Timeline analysis:
We have considered wars that have happened between 1500 CE and 2020 CE.
It is a period of 520 years. Analysis of the whole timeline at once doesn’t give
us good results as an ally in the fifteenth century might be enemy in the twenty
first century. It is also difficult to do analysis on each year separately as there
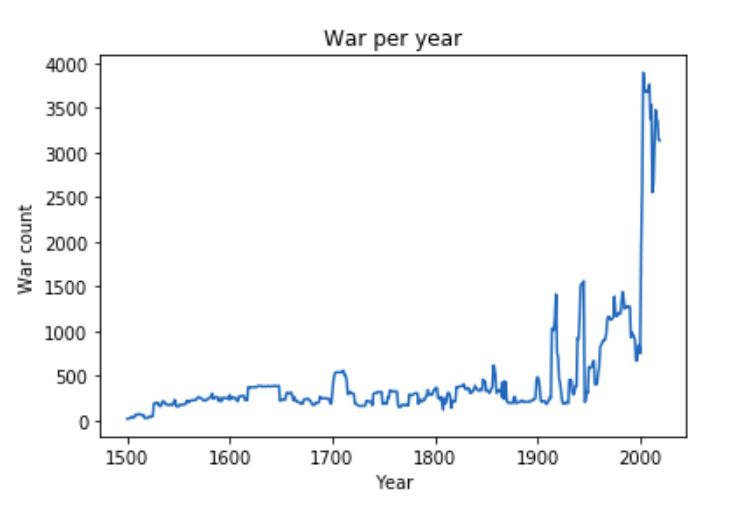
are a total of 520 years. To decide the segments, we created a plot Figure 2a
between years and number of wars fought in a specific year. In Figure 2a, It
can be observed there is a huge increase in the number of wars after 2001. In
particular, the height of the curve at year 2003 is 3895 which is more than twice
of the cumulative number of wars during the second world war. We found that
many countries had around 30 edges every year because of encounters with dif-
ferent terrorist organisations like Tahrik-i-Taliban Pakistan, HI-Khalis, Islamic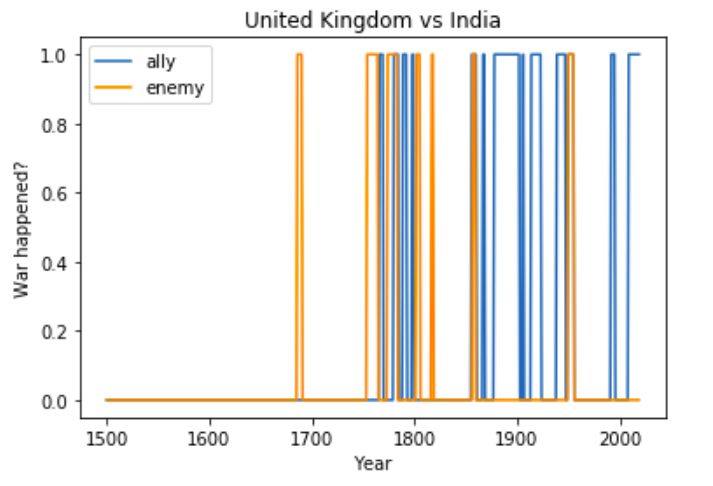
Temporal Analysis of Worldwide War          5

 (a) Considering all nodes (b) Ignoring terrorist units   (c) For each continent

                        Fig. 2: Year-wise number of wars

Emirates, Boko Haram etc. We drew, another plot, given in Figure 2b, similar
to Figure 2a, but without the terrorist encounters. In the new plot total wars
fought reduced heavily, e.g. wars fought in 2016, 2017, 2018 and 2019 reduced
from 3351, 3370, 3153, 3148 to 1008, 994, 871 and 870 respectively. Which are
less than 2/3 of the wars fought during the second world war. In Figure 2b, it is
observed that the number of wars are almost constant before 1800. After, 1800
spikes start occurring in the curve. There are 3 big spikes after 1800 and before
2000. First spike is at year 1914 which is in the timeline of the first world war,
and there are 1411 edges in that year. Second spike is at year 1945 which is in
timeline of the second world war, and there are 1560 edges in that year. Third
spike is at year 1987. After analyzing the edges, it was found out that this spike
is because of the different individual wars which happened in 1987 e.g. Iran-Iraq
war, Cold War, Baltic states vs Soviet Union etc.
    After analyzing the plot in Figure 2a and Figure 2b, we concluded to divide
the timeline from 1500 CE to 2020 CE into three parts and study all of them
separately as well.

1. Early wars[1500-1800]: This is the part in the graph which has almost same
   number of wars. The wars are mostly dominated by European countries.
   4413 wars started in this timeline, which is least of the three timelines.
2. During and pre-world wars[1801-1945]: This timeline covers the incidents of
   World wars. Both the world wars fall in this timeline, 9064 wars started in
   this timeline and total 9510 war were fought in this timeline.
3. Post world wars[1946-2020]: Post world war era. This timeline’s results are
   most effective in influencing the present state of different countries. 14244
   wars started in this timeline and 14358 wars were fought in this timeline.

Wars in different Continents: We also plot the number of wars fought by
countries from different continents. The plot is given in Figure 2c where the
x-axis denotes the years and the y-axis denotes the number of wars fought by
countries from a continent. For each continent, a curve with a different color is
plotted. The nodes having degree more than 40 are only considered for respective
continents. We have only plotted curve for Asia, Europe, Africa, North America,
South America and Australia. We haven’t included Antarctica as none of the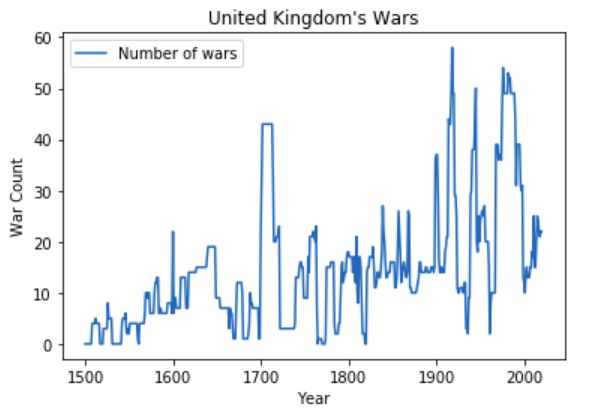
6      Bajpai and Singh

country with degree more than 40 belonged to it. We also added a continent with
name Euro-Asia to cover the countries which exist partially in Asia and partially
in Europe. From Figure 2c, we can observe that European countries dominated
the world in terms of participating in wars between 1500 to 1800. 1800-1900
period had relatively lesser number of war. This period wasn’t solely dominated
by European countries as other continents’ degree had increased. Number of wars
increased significantly during the world war timelines and European nations had
the highest degree. Asia, Europe and Africa continents have mostly participated
in wars after 2000.

4.2   High Degree Nodes
The nodes having high degrees in the constructed network correspond to the
countries or empires fighting most number of wars in that timeline. The power-
ful countries generally become condescending and fight more wars. So, the high
degree nodes in the graph represent the powerful countries of the timeline. Ta-
ble 2 shows the list of top 10 countries/empires that participated in maximum
number of wars during different timelines.

Timeline 1: Early Wars[1500-1800]: This was an era where countries had
to fight against each other to establish their control and show dominance. We
can observe in the [1500-1800] section of Table 2 Ottoman Empire is the node
with highest degree. During 16th and 17th centuries, the Ottoman Empire was a
multinational, multilingual empire controlling most of Southeast Europe, parts
of Central Europe, Western Asia, parts of Eastern Europe and the Caucasus
and North Africa. The presence of its name at the top of the list reflects its
dominance in the timeline. Most of the nodes in the list are European countries
as they were participating in a lot of wars in trying to establish their colonies.

Timeline 2: Pre-world wars [1801-1945]: In the first world war, Germany,
Ottoman Empire and Bulgaria were the major participants of the first side which
were opposed by Russia, United Kingdom. In the second world war, Germany,
Italy and Japan were major participants of the first side which were opposed

                               Table 2: High Degree Nodes
       [1500 – 1800]              [1801 – 1945]            [1946 – 2020]             [1500 – 2020]
       Node        Degree         Node       Degree         Node     Degree          Node       Degree
Ottoman Empire       376    Russia            608     United States      632   Russia            1279
France               364    Germany           587     Russia             455   United Kindom     1276
United Kindom        334    Italy             564     United Kindom      433   France            1253
Spain                333    France            543     Al-Qaeda           410   United States     1065
Russia               237    United Kindom     526     France             351   Germany           999
Holy Roman Empire 207       United States     424     Australia          334   Spain             865
Turkey               199    Ottoman Empire 405        Germany            292   Italy             848
Dutch Republic       191    Japan             330     China              287   Ottoman Empire 781
Sweden               185    Spain             324     Iraq               285   Romania           583
Portugal             161    Bulgaria          316     Italy              250   Bulgaria          495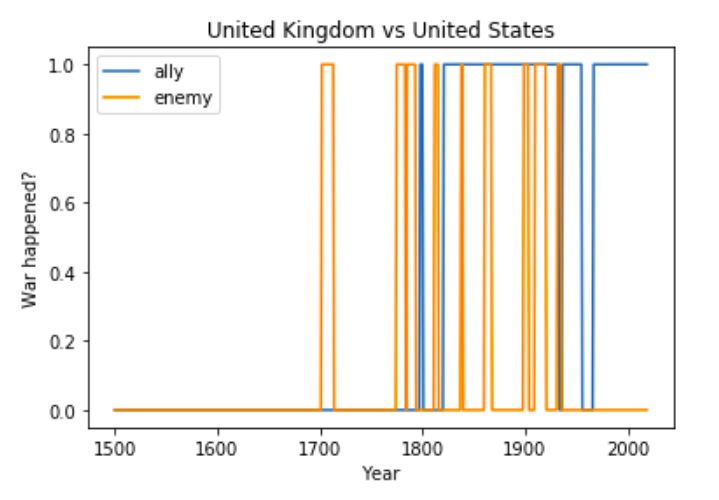
Temporal Analysis of Worldwide War        7

by France, United Kingdom, Russia and United States. Clearly all the nodes
except Spain in the [1801-1945] section of Table 2 are among the major par-
ticipants of one of the world war. Russia, Germany, Italy, France and United
Kingdom actively participated in both the world wars so they are at the top
of list, where as United States, Ottoman Empire and Bulgaria were active in
one of the world wars so they are towards the bottom of list. Spain is present
in the list as it also participated in WW2 and also fought wars during 1800-1900.

Timeline 3: Post-World wars[1946-2020]: United States is at the top of
the [1946-2020] section of Table 2 as it is known for its efforts in trying to
mitigate terrorism, US army is fighting against terrorism in various areas like
Afghanistan, Iraq and Syria. USA also fought the cold war against Russia. It is
followed by other countries like Russia, United Kingdom, France, Australia etc,
all of these nations are undoubtedly powerful nations of the present era. This
is the only timeline in which we see a terrorist organisation (al-Qaeda) present
in the list, which supports the fact that this timeline is dominated by the wars
against terrorism.

Overall [1500-2020]: Now, since the timeline is much bigger the nodes present
in the list could be the node which were powerful throughout the timeline or the
nodes which dominated a specific timeline. Nodes like Russia, United Kingdom,
France, Germany are the ones which were powerful in all three timelines as we
have seen in the timeline specific analysis. Whereas nodes like United States,
Ottoman Empire and Bulgaria were not very strong in all three timelines. For
example, USA was not active in the first timeline but dominated the next two,
Ottoman Empire on the other side was powerful in the first two timelines and
disappeared from the list in the third timeline.

4.3   Rival Countries
The nodes having highest number of edges between them in our graph corre-
sponds to the pair of countries fighting most number of wars against each other
during a timeline. List of pair of nodes with highest number of edges between
them gives us the list of countries with strong rivalries between them. Table 3
shows the list of such rival countries.

Timeline 1: Early Wars[1500-1800]: We can observe in [1500-1800] section
of Table 3 that all of these rivalries are among the European Countries. United
Kingdom-France is at the top of the list. Anglo-French wars which were happen-
ing for almost throughout this timeline are example of conflicts between England
and France. Similarly all other pairs are also of European countries fighting for
dominance.

Timeline 2: Pre-world wars [1801-1945]: Germany, Ottoman Empire and
Bulgaria fought against Russia, United Kingdom in world war 1. Germany, Italy
and Japan fought against France, United Kingdom, Russia and United States.
8       Bajpai and Singh

                             Table 3: Rival Countries
                [1500 – 1800]                                [1801 – 1945]
    Node1            Node2       Edge Count     Node1            Node2       Edge Count
United Kingdom France                43     United Kingdom Germany               22
France         Spain                 40     Russia         Germany               20
France         Holy Roman Empire     36     Russia         Italy                 21
United Kingdom Spain                 36     United Kingdom Italy                 21
Ottoman Empire Spain                 30     Indonesia      Dutch East Indies     21
                [1946 – 2020]                                [1500 – 2020]
    Node1            Node2       Edge Count     Node1            Node2       Edge Count
Russia         United States         23     United Kingdom France                61
United States  China                 18     United Kingdom Spain                 50
Al-Qaeda       United States         17     France         Spain                 46
Thailand       Vietnam               16     France         Holy Roman Empire     37
China          Vietnam               16     Russia         France                35

United kingdom and Russia fought against Germany in both the world wars
rooting for the first two entries of [1801-1945] section of Table 3. United king-
dom and Russia fought against Italy in the second world war rooting for the next
two entries of table. Indonesian national revolution was a major armed conflict
that happened in 1945-1949 which included a number of military encounters
between Dutch and Indonesia rooting for the presence of last entry in the list.

Timeline 3: Post-World wars[1946-2020]: As mentioned earlier this time-
line is the most recent and stats of this timeline are most effective in deciding
the current situations. All the rival nodes present in the [1946-2020] section of
Table 3 are well known rivals of present era. United States and Russia fought
long cold war against each other. United states-china, Thailand-Vietnam, China-
Vietnam our well known conflicts. Al-Qaeda attacked on United States in 2001
and straight after that USA declared war against it which is still going on.

Overall [1500-2020]: The [1500-2020] section of Table 3 shows the pairs of
nodes which constantly fought against each other or the pairs of nodes which
fought many battles against each other in specific timeline. We can see that
United Kingdom- France is at the top of the list because they fought against
each other in the first timeline and in the beginning of second timeline. Whereas
Russia and United states fought against each other majorly in the third timeline.

4.4   Countries With highest number of wars fighting against
      common enemy
Next we analyzed the countries who fought the most number of wars against the
same side at the same time. If a pair of node is present in the rival country list
and also in this list, this implies that the pair of nodes was fighting against each
other and also against a common enemy at the same time. This would represent
a clique like situation where many countries were fighting against each other.
Whereas if two countries have fought most wars fighting against the same side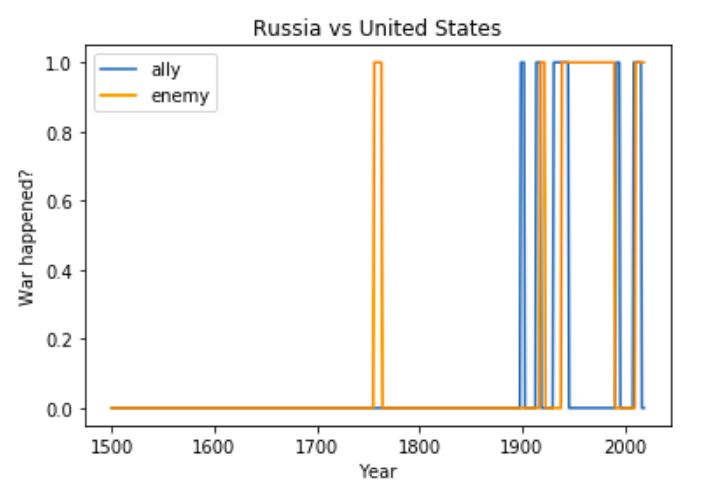
Temporal Analysis of Worldwide War                    9

                         Table 4: War Against Common Enemy
                       [1500 – 1800]                                      [1801 – 1945]
       Node1                Node2      Number of Wars        Node1             Node2     Number of Wars
Spain                Holy Roman Empire      44        United Kingdom       France             35
Ottoman Empire       Turkey                 26        United Kingdom       India              29
Portugal             State of Brazil        23        Russia               United Kindom      28
Spain                Papal States           22        United Kingdom       United States      26
France               Spain                  20        Germany              Italy              24
                       [1946 – 2020]                                      [1500 – 2020]
       Node1                Node2      Number of Wars        Node1             Node2     Number of Wars
United Kingdom       United States          47        United Kingdom       France             79
United States        Australia              39        United Kingdom       United States      73
United States France France                 37        United States France France             57
United Kingdom       Australia              33        United Kingdom       Italy              37
United Kingdom       France                 32        France               Spain              35

and very few or no war against each other it give us a sense of friendship among
the two. Table 4 shows the list of such nodes.

Timeline 1: Early Wars[1500-1800]: Pair of France and Spain was present
in the [1500-1800] section of Table 3, and is also present in the same section for
Table 4. This follows the first scenario and shows that the countries were fighting
against each other. This follows the reasoning that we gave while introducing
the timeline that many European Countries were fighting against each other.

Timeline 2: Pre-world wars [1801-1945]: United Kingdom-France, Russia-
United Kingdom, United Kingdom-United States all have very small number of
wars against each others and large number of wars along the same side so this
reflects friendship among these pair of nodes. This is also evident from the world
war facts as United Kingdom, France and Russia were part of ally countries dur-
ing second world wars. USA also joined ally countries during later part of second
world war. India helped the United kingdom in the world wars so India-United
Kingdom pair is also present in the list. We can see these stats clearly reflect the
dominance of world wars in this timeline.

Timeline 3: Post-World wars[1946-2020]: All the nodes present in [1946-
2020] section of Table 4 are powerful nations. We will see in the later section
that these are the nodes which are fighting most against the different terrorist
organizations as allies.

Overall Analysis [1500-2020]:The reasoning given in the beginning of Sec-
tion 4.4 fails here. Recall, we noted that if a pair of node is present in the rival
country list and also in this list, this shows that the pair of nodes were fighting
against each other and also against a common enemy at the same time. This
represents a clique like situation where many countries are fighting against each
other. Where as if two countries have fought most wars fighting against the same
side and very few or no against each other it gives us a sense of friendship among
the two. As the size of timeline is much larger, there is a possibility that two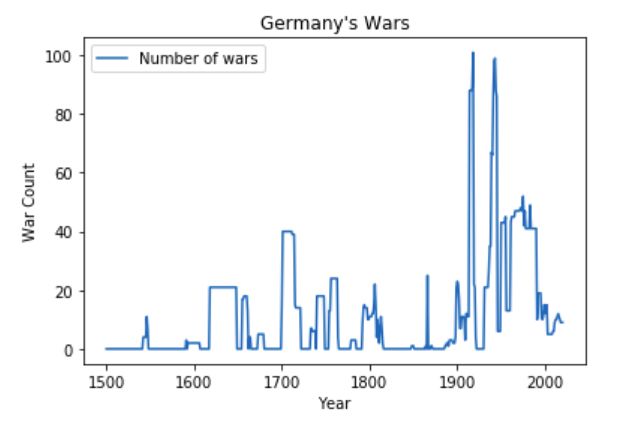
10 Bajpai and Singh
countries fought many wars against each other at some time and fought along
the same side at a different time and this would not imply a clique like situation.
Table 4 shows the list of such nodes. Pairs at the top of the list are the pairs
which fought together during the world wars and are also fighting against ter-
rorism in the present era e.g United Kingdom-France, United Kingdom-United
States, United states-France.
4.5 Inter-country Relations
We studied the inter-country relations between different countries by analyzing
the number of wars they fought against each other and number of wars they
fought along the same side. To analyze this we plotted two lines for each pair
of nodes. The blue line indicates if the two nodes fought a war along the same
side in that year, where as the orange line indicates if two nodes fought against
each other in that year. In the graph we plot both the lines and depending on
the values of lines 4 scenarios are possible. Orange line is at 1 and blue line is
at 0: Countries were fighting against each other in that particular year. Orange
line is at 1 and Blue line is at 1: Countries were fighting against each other and
also against some common opponent in that particular year. Orange line is at
0 and Blue line is at 1: Countries were fighting against some common opponent
in that particular year. Orange line is at 0 and Blue line is at 0: Countries did
not have any direct interaction with each other. Analysis of some inter-country
relationship pairs are plotted in Figure 3.
(a) UK and France (b) USA and Russia (c) UK and USA
(d) UK and Germany (e) UK and India (f) USA and China
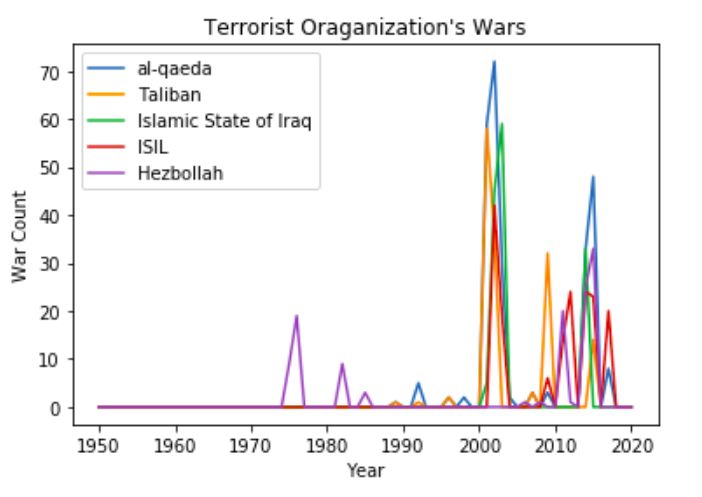
Fig. 3: Relations between two countriesTemporal Analysis of Worldwide War 11 United Kingdom and France: Figure 3a shows the plot of the relationship between United Kingdom and France based on the wars fought between them and against common enemies. Orange line has value 1 for almost all the time between 1500 CE and 1820 CE. This is because of the Anglo-French war which happened during that time. Blue line has value 1 for some time between 1550 CE to 1650 CE. This is because of the 80 years long war in which France and UK both fought against Spain from 1568 CE to 1648 CE. In 1830 France accepted Britain as ally so orange line doesn’t touch y=1 value for long duration after that. Blue line touches y=1 constantly after 1970 as both developed nations were helping other countries in fighting civil wars and in mitigating terrorism. United Kingdom and Germany: Figure 3d plots the relationship between United Kingdom and Germany. Germany didn’t fight many wars against other countries between 1500 CE to 1600 CE as a result except for one spike both orange and blue lines move along y=0 during that time. Between 1615 CE and 1775 CE blue and orange line move along each other at value 1 because during this timeline, European countries were fighting against each other for dominance. In later part of 18th century, Britain and Prussia became allies, so only blue line touches y=1 in that area. Both blue and orange lines are at y=0 between 1800 CE and 1900 CE indicating not much direct interaction among two countries. Both the lines start to touch y=1 after 1900 as pre-world war activities were happening. Orange line has value 1 around 1915 and 1945 indicating the world war in which both the countries fought against each other. Blue line touches y=1 constantly after somewhere around 1980. United States and Russia: Figure 3b plots the relationship between United States and Russia. There is no interaction between countries before 1900 CE except for a small period around 1770 CE which is because of involvement of Russia in United States’ revolution. Blue lines touches y=1 around 1914 and 1945 as countries participated together in world wars. Orange line touches y=1 after 1946 up to 1991 because of the cold war. Blue line touches y=1 and re- mains there afterward as both nations were helping other countries in fighting civil wars and in mitigating terrorism. United Kingdom and India: Figure 3e plots the relationship between United Kingdom and India. Their is no interaction between countries before 1700 CE. Orange line touches y=1 many times between 1700 CE and 1800 CE because of multiple Anglo-Indian wars. Orange line touches y=1 several times between 1800 CE and 1950 CE e.g. at 1847 CE because of the Revolutionary war of India. After 1800, Britain started gaining control over India and Indian troops fought along with them in certain wars. As a result we see blue line touching y=1 from around 1800 CE to 1950 CE, as India got freedom in 1947. Blue line again touches y=1 as both India and United Kingdom were fighting against terrorism.
12      Bajpai and Singh

United States and China: Figure 3f plots the relationship between United
States and China. Orange line touches y=1 for the first time at 1900 CE as in
1900 CE, China fought against USA during Boxer Rebellion. Blue line touches
y=1 around the timeline of world wars as both USA and China fought on the
same side. Orange line touches y=1 after the second world war, as USA and
China supported opposing countries in different wars. Korean war is one such
example in which USA supported South Korea and China supported North Ko-
rea. Blue line again touches y=1 after 1990.

United States and United Kingdom:Figure 3c plots the relationship be-
tween United States and United Kingdom. Choctaw (Native American) had
conflict with British government in 1702 CE -1713 CE due to which Orange line
touches y=1 at that time. Orange line touches y=1 again at around 1777 CE
because of USA’s revolutionary war. After the revolution, two countries became
ally so we can see blue line touches y=1 again. Conflict among countries started
again in 1812 CE (War of 1812) After that both countries remain ally for most of
the time from 1812 CE to 2020 CE excluding some small duration. Some dispute
happened between these. countries due to which orange line also touches y=1
for small intervals. Both USA and UK fought along the same sides in world war
and remained allies afterward.

4.6   Analysis of Countries’ History
This sections sheds light on the year-wise number of war-fronts in which some
countries and empires were involved in. In these analysis, wars involving terrorist
organizations are ignored to have a clear understanding of inter-country wars.
The analysis for considered countries is plotted in Figure 4.

United States: Figure 4a plots year-wise number of wars fought by United
States. First significant increase in the curve is at 1702 CE - 1712 CE because of
conflict between Native Americans and Britain. United States’ revolution hap-
pened in 1776 CE so it hasn’t participated in any war before that. After 1775 CE,
curve starts increasing because of the Revolutionary War(1776). Curve shows sig-
nificant increase around 1861 because of United States’ Civil War. Two spikes
in curve in the timeline of world wars. United States participated in various
different wars during 1970 CE to 2000 CE e.g. Cold war, Gulf war, Tanker war,
Tobruk wars etc. due to which curve attains its peak value around this time.
United States is still sending its forces to help countries in need, therefore, curve
remains at a significant value even after 2000 CE.

Germany: Figure 4d plots year-wise number of wars fought by Germany. First
Considerable value is around 1610 CE to 1640 CE because of the 30 years
war(1618-1658). Huge Spike in 1914 CE because of the first world war. Curve
almost touches 0 after 1918 CE because of the restrictions imposed on Germany
after the first world war. Another huge spike in 1945 CE because of the second
Temporal Analysis of Worldwide War       13

     (a) United States        (b) United Kingdom          (c) Ottoman Empire

       (d) Germany                  (e) China                  (f) India

    Fig. 4: Number of wars participated by countries/Empires over timeline

world war. Number of wars significantly reduce after that.

United Kingdom: Figure 4b plots year-wise number of wars fought by United
Kingdom. UK has been a strong country throughout the 520 years period in
terms of fighting most number of wars. First significant increase in 1700 CE as
United Kingdom participated in two big wars: Great Northern war, and War
of Spanish succession at the same time. The curve shows huge increase around
the timeline of world wars reflecting the active participation of United Kingdom
in it. United Kingdom participated in various different wars during 1970 CE to
2000 CE e.g. Bosnian war, Gulf war, Falklands wars, Cod wars etc.

China: Figure 4e plots year-wise number of wars fought by China. The republic
of china was formed in 1912 CE. Curve takes significant values after 1912. The
curve takes value approximately 15 in 1914 CE reflecting China’s participation
in the first world war. Curve achieves its peak value around 1945-1955 period,
as China fought against Japan in the second world war and also participated
in battle of Chamdo, Korean war and the war against Taiwan. Curve has sig-
nificant value throughout second half of 20th century reflecting its participation
in Taiwan Crisis, Tibetan Uprising, Xinjiang conflict, Sino-Indian war, Vietnam
war etc. As China is still sending its forces to help countries like Somalia as a
result curve keeps a significant value even after 2000s.

India: Figure 4f plots year-wise number of wars fought by India. The curve
has lower values as compared to the above 4 plots. Small number of wars up to
1850 CE, because of wars between different empires (Maurya, Maratha, Sikkha,
14 Bajpai and Singh
British Rule). First spike in 1857 CE because of Indian revolution movement
during that time. Curve attains largest value around 1945 CE - 1955 CE period
as India participated in the second world war to help Britain and got freedom in
1947 CE. India fought with Pakistan in 1947-48 CE for the state of Jammu and
Kashmir. India also conducted military operations for annexation of Hyderabad
and Junagadh. India had a conflict with Portugal for annexation of Dadra and
Nagar Haveli in 1954. Curve doesn’t vanish even though India isn’t participating
in war directly. It is because India is part of NATO which is helping different
countries in fighting their wars.
Ottoman Empire: Figure 4c plots year-wise number of wars fought by Ot-
toman Empire. We can observe that the curve takes significant value after 1520
CE, as Ottoman Empire came in the total power after 1520 CE. This curve gains
significantly larger value as compared to rest of 5 plots from 1520 CE to 1700
CE. Empire starts loosing power as the number of war starts reducing after 1710
CE. Curve has a huge spike in 1914 CE reflecting its participation in the first
world war. The Empire was defeated in 1918 and officially ended in 1922 as a
result the curve vanishes after that.
4.7 Wars involving Terrorist Organisations
In this section, we analyse the wars involving terrorist organization. These wars
consider both: the attacks by terrorist organization on a country and attack by
nations on the hubs of terrorist organizations. All the plots in this section is
for timeline 1950 CE to 2020 CE because before 1950 CE, there is very limited
number of such wars. Year-wise number of wars involving terrorist organization
is plotted in Figure 5a. It is observed that the total number of wars involving
terrorist organization are close to zero in the begin. The curve increases slowly
till 2000. Curve increases sharply and attains its maximum value in 2001. The
number of terrorist encounters have decreased since then. Still the count is high.
(b) For most involved ter- (c) Against most exposed
(a) Against all countries rorist organization countries
Fig. 5: Year-wise number of wars involving terrorist organizations
The list of the top 5 terrorist organisations which have been involved in most
wars. It reports that Al-Qaeda has been the most active terrorist organization.
Table 5 also lists the top 5 countries with maximum engagement with variousTemporal Analysis of Worldwide War 15
terrorist organisations in wars along with the number of wars. The timeline
analysis for these top five entities is given in Figure 5b. It becomes clear from
these plots, when these organization became active and when they are at peak
for getting involved in wars.
Table 5: Wars involving Terrorist Organisations
Most Active Terrorist Organizations Countries with Most Terrorist Encounters
Terrorist Organisation Total Number of Wars Country Number of terrorist Encounters
Al-Qaeda 422 United States 212
Taliban 235 United Kingdom 201
Islamic States of Iraq 208 Australia 168
ISIL 199 France 149
Hezbollah 148 Denmark 135
Table 6 contains the number of engagement a country had in wars with each
specific terrorist organizations. It turns out that Al-qaeda and United States are
the top engaging nodes. Al-qaeda is the terrorist organisation in all top five node
pairs that exhibits the reach and engagement of this organization across several
continent. Al-Qaeda has been the most active terrorist organization. Further, it
also helps us to analyse the names of the countries which are fighting most in
trying to mitigate the terrorism. It reports that United States has participated
most in the wars against terrorist organizations. It becomes clear from these
plots, when these countries were first exposed against terrorism and when these
get most engaged in wars against terrorist organization. Finally, we analyse the
number of engagement a country had in wars with each specific terrorist organi-
zations. It turns out that Al-qaeda and United States are the top engaging nodes.
Al-qaeda is the terrorist organisation in all top five node pairs that exhibits the
reach and engagement of this organization across several continent.
Table 6: Most wars for Country-Terrorist Org. pairs:
Country Terrorist Organisation Number of encounters
United States Al-Qaeda 18
United Kingdom Al-Qaeda 13
Australia Al-Qaeda 12
Netherland Al-Qaeda 11
Denmark Al-Qaeda 10
4.8 Economic Effects of War
We have plotted the number of wars fought by each country and their GDP value
and we can clearly see the correlation among the two. We have plotted the two
stats represented by blue and orange line across the timeline (X axis). The blue
line represents the GDP of the country in that particular year. We have scaled
it down by dividing with a constant to show correlation properly. The Orange
line represents the number of wars fought by the country in past 3 years. We
have plotted the cumulative sum of wars for past 3 years instead of the wars in
that particular year since wars impact the GDP of upcoming years as well. We
observe that the spikes in the orange lines are always followed by a dip in the16 Bajpai and Singh
(a) Germany (b) United Kingdom (c) USA
Fig. 6: Economic Effects of War
blue curve for all countries. We have attached few of those plots in the Figure 6.
The dips are deeper for few countries and shallower for the others. Note that all
the countries have a dip around 1945-50 because of the second world war but
the size of dip (relative to their GDP) for United States and United Kingdom is
smaller in comparison to that of Germany and Japan. It seems that the countries
which won the wars tend to have smaller dips. The impact of outcome of the
wars require further investigation.
5 Conclusion
Temporal analysis of wars fought after 1500 CE is done by curating data available
on Wikipedia. The analysis results comply with the historical events. The pow-
erful and dominating nations are identified during different timelines. Rivalries
and allies based on wars explain the inter-country relationships during different
timelines. Most active terrorist organizations and most active countries against
terrorism were also identified using this analysis. The data did not include the
damage associated with wars, due to which all wars were treated equally. Analy-
sis incorporating damage associated with wars by assigning weights on the edges
in temporal graph and considering the decision of war will give better insights.
Impact on economy has been analysed in terms of change in GDP. After 1500,
european countries began to move from feudalism to capitalist societies, and
domestic revolutions played a crucial role in the future development of the coun-
tries. Taking into account the industrial revolution and the impact of domestic
revolutionary movements on GDP is another future direction.
References
1. https://en.m.wikipedia.org/wiki/category:lists of wars by country (2020)
2. Baffigi, A.: Italian national accounts, 1861-2011. Bank of Italy Economic History
Working Paper (18) (2011)
3. Bassino, J.P., Broadberry, S., Fukao, K., Gupta, B., Takashima, M.: Japan and
the Great Divergence, 730-1874. CEI Working Paper Series 2018-13, Center for
Economic Institutions, Institute of Economic Research, Hitotsubashi University
(Dec 2018), https://ideas.repec.org/p/hit/hitcei/2018-13.htmlTemporal Analysis of Worldwide War 17
4. Bolt, J., van Zanden, J.L.: The maddison project: collaborative research on histor-
ical national accounts. The Economic History Review 67(3), 627–651 (2014)
5. Broadberry, S., Custodis, J., Gupta, B.: India and the great divergence: An anglo-
indian comparison of gdp per capita, 1600–1871. Explorations in Economic His-
tory 55, 58–75 (2015). https://doi.org/https://doi.org/10.1016/j.eeh.2014.04.003,
https://www.sciencedirect.com/science/article/pii/S0014498314000187
6. Broadberry, S.N., Campbell, B.M., Klein, A., Overton, M., Leeuwen, B.v.: British
economic growth: 1270-1870 (2010)
7. Carter, S.B., Gartner, S.S., Haines, M., Olmstead, A., Sutch, R., Wright, G.
(eds.): The Historical Statistics of the United States 5 Volume Hardback Set.
Cambridge University Press (2006), https://EconPapers.repec.org/RePEc:cup:
cbooks:9780521817912
8. de la Escosura, L.P.: Lost decades? economic performance in post-independence
latin america. Journal of Latin American Studies 41(2), 279–307 (2009), http:
//www.jstor.org/stable/27744128
9. Glick, R., Taylor, A.M.: Collateral damage: Trade disruption and the economic
impact of war. The Review of Economics and Statistics 92(1), 102–127 (2010)
10. Hafner-Burton, E.M., Kahler, M., Montgomery, A.H.: Network analysis for inter-
national relations. International Organization 63(3), 559–592 (2009)
11. Homero Roman Roman, Colin P. Gaffney, L.F.V.: Temporal analysis of intenational
relations networks (2018), http://snap.stanford.edu/class/cs224w-2018/
reports/CS224W-2018-99.pdf
12. Houweling, H., Siccama, J.G.: Power transitions as a cause of war. Journal of
Conflict Resolution 32(1), 87–102 (1988)
13. Jackson, M.O., Nei, S.: Networks of military alliances, wars, and international
trade. Proc. of the National Academy of Sciences 112(50), 15277–15284 (2015)
14. Lagazio, M., Russett, B.: A neural network analysis of militarized disputes, 1885-
1992: Temporal stability and causal complexity (2004)
15. Malanima, P.: The long decline of a leading economy: Gdp in central and northern
italy, 1300–1913. European Review of Economic History 15(2), 169–219 (2011)
16. Mason, T.D., Joseph P Weingarten, J., Fett, P.J.: Win, lose, or draw: Predicting
the outcome of civil wars. Political Research Quarterly 52(2), 239–268 (1999)
17. McMahan, J.: Just cause for war. Ethics & International Affairs 19(3), 1–21 (2005)
18. Murthy, R.S., Lakshminarayana, R.: Mental health consequences of war: a brief
review of research findings. World psychiatry 5(1), 25 (2006)
19. Organski, A., Kugler, J.: The War Ledger (06 1981)
20. Pfister, U.: Economic growth in germany, 1500–1850. In: conference on quantifying
long run economic development, Venice. pp. 22–24 (2011)
21. Karl R. de Rouen, J., Sobek, D.: The dynamics of civil war duration and outcome.
Journal of Peace Research 41(3), 303–320 (2004)
22. Sarkees, M.R., Wayman, F.: Resort to war: 1816 - 2007 (2010), https://
correlatesofwar.org/data-sets/COW-war
23. Tang, J.P.: Review: Regional inequality and industrial structure in japan:
1874-2008, by kyoji fukao, jean-pascal bassino, tatsuji makino, ralph papryzy-
cki, tokihiko settsu, masanori takashima and joji tokui (maruzen publish-
ing company, ltd, tokyo, 2015), pp. 350. Economic Record 92(296), 141–
143 (2016). https://doi.org/https://doi.org/10.1111/1475-4932.12250, https://
onlinelibrary.wiley.com/doi/abs/10.1111/1475-4932.12250You can also read