Technology Scouting Report: Reliability Implications of Recent PV Module Technology Trends - Jarett Zuboy, Martin Springer, Elizabeth Palmiotti ...
←
→
Page content transcription
If your browser does not render page correctly, please read the page content below

Technology Scouting Report:
Reliability Implications of Recent
PV Module Technology Trends
Jarett Zuboy, Martin Springer, Elizabeth
Palmiotti, Teresa Barnes, Joe Karas,
Brittany Smith, and Michael Woodhouse

May 9, 2022
The importance of module reliability

 Jordan et al. (2021)

 Stoker (2021b)
 Stoker (2021a)

 PV modules damaged by hail (Photo by Dennis Schroeder / NREL)

PV module hotspot (Image by Dirk Jordan / NREL) Willuhn (2022) PV cell metallization cracking (Image by Tim Silverman / NREL)

 2

Reliability-related trends
 Accelerating Solar Deployment Price and Performance Pressure

 DOE (2021) Smith et al. (2021)

 Longer Module Lifetimes Changing Environments

 Modified from Jordan IPCC (2007)
 et al. (2022)

 3
Supply chain impacts
 Woodhouse et al. (2022)

 4

Goals of the DuraMAT Technology Scouting Report

• Track technology changes that could affect PV module reliability
• Assess changes in module reliability risks over time
• Identify the need for new research related to reliability

 “PV moves pretty fast. If you don't stop and look around once in a while, you
 could miss it.“ – Inspired by Ferris Bueller’s Day Off

 5

Thank you

• DuraMAT Industry Advisory Board
• Nick Bosco (NREL)
• David Feldman (NREL)
• Peter Hacke (NREL)
• Al Hicks (NREL)
• April Jeffries (Osazda Energy)
• Dirk Jordan (NREL)
• Mike Kempe (NREL)
• David Miller (NREL)
• Heather Mirletz (NREL, Colorado School of Mines)
• Ingrid Repins (NREL)
• Tim Silverman (NREL)

 6

PV module technology changes

 7

Categories of technology change

 Large modules Interconnects Bifacial Cell technology

 8

Large modules

 Large modules Interconnects Bifacial Cell technology

 9

Larger wafers
 100% Drivers & Benefits
 90%
 improvements in manufacturing capabilities
 80% • larger wafers provide potential for cost savings
Global market share

 70%
 enables larger module sizes
 60% • large format modules – higher energy output
 50%
 efficiency gains
 40%
 • cell cutting
 30%
 20%
 10%
 Potential Risks
 0%
 requires adaptation of cell and module processes
 2016
 2017
 2018
 2019
 2020
 2021

 2023

 2025

 2028

 2031
 • significant process changes
 < 166 mm 166 mm 182 mm 210 mm introduction of additional process steps
 • cell cutting (see next slide) can increase reliability risks

 handling of larger wafers and cells is more complex
 • especially when coupled with thinner cells (increased fracture risk)

 Author synthesis of mono c-Si wafer size data from ITRPV (2017–2021)

 10
Cell cutting Bosco et al. (in review)

 100% Drivers & Benefits

 90% reduces resistive losses
 • by lowering electric current
 80%
 potentially higher shade tolerance
 70% • through changed junction box position & wiring pattern
Global market share

 60%
 Potential Risks
 50% potentially increased cell fracture risk through edge-defects
 40% • dependent on cell cutting technologies and process rotated cells
 control less likely
 30% to fracture
 changed mechanical stress and strain field
 20% • potential for reduced cell deformation and decreased cell
 fracture risk
 10%
 orientation of half cut cells can decrease fracture risk
 0% • fracture risk of current industry standard is similar to the
 risk for full-size cells
 2016
 2017
 2018
 2019
 2020
 2021

 2023

 2025

 2028

 2031
 • rotation of 90 degrees can reduce the probability of
 Full cell Half cell Other (incl 1/3, 1/5, 1/6) fracture under static loading conditions

Author synthesis of data from ITRPV (2017–2021). The 2020–2031 values are for cells ≥ 182 x 182
mm2. Cell dimensions are unspecified for earlier data.

 11
Thinner cells
 Drivers & Benefits
 190
 reduced material input
 • cost savings
Global as-cut wafer thickness (µm)

 180
 new advanced cell technologies
 • thinner wafers have higher efficiency potential when paired with n-type
 170
 technologies such as SHJ and TOPCon

 160 Potential Risks
 potentially reduced cell yield on production line
 150 • handling of thin cells is complex and can break before lamination
 • new manufacturing processes need to be adopted
 140 cell cracking risk after lamination not inherently higher than for thick cells,
 depends on
 • stress localizations around interconnect technologies
 130 • stress state and effective area of cell under tension
 2016
 2017
 2018
 2019
 2020
 2021

 2023

 2025

 2028

 2031
 • packaging technology (glass-glass vs. glass-backsheet)
 • edge-damage caused by the cutting process
 p-type mono high p-type mono low p-type multi • residual stresses caused by firing of the metallization

 n-type mono high n-type mono low adaptation of thinner cells has been slower than predicted
 • caused by complications in packaging process (likely ongoing)
 Author synthesis of data from ITRPV (2017–2021)

 12
Larger modules
 100% Drivers & Benefits
 80%
Global market share,
utility-scale modules

 wafer/cell size
 60% • larger cells allow for larger module sizes
 increased power output
 40%
 • larger active area
 module
 20% • improved cell-to-module (CTM) power ratio: CTM =
 cell ⋅ cell
 0%
 2020 2021 2023 2025 2028 2031 Potential Risks
 < 2 square meters 2 to ≤ 2.2 2.2 to ≤ 2.5 2.5 to ≤ 3.0 > 3.0 potentially more frequent cell breakage due to
 Full cell Half cell Third cell • weather (wind & hail), or shipping, handling, and installation
 103%
 Mono Si cell-to-module ratio

 increased weight
 102% • OSHA handling issues with very large modules; 100-lb modules may be the
 practical limit
 101%
 • implications for mounting structure design and cost
 100% increase in electrical current
 • electrical balance of sys. (wire size, fusing, bypass diode) must be adapted
 99%
 new testing equipment necessary to accommodate large modules
 98% • such as dynamic mechanical loading (DML) to assess hail damage and
 2021 2022 2024 2026 2029 2032 inform insurance coverage
Author synthesis of data from ITRPV (2017–2022)

 13
Interconnects

 Large modules Interconnects Bifacial Cell technology

 14
traditional zero-gap technologies

 More busbars

 100% Drivers & Benefits
contacted cells in new and upgraded lines

 90% increasing cell sizes require a larger number of interconnects
 Global market share, for double side

 • improved manufacturing capabilities of wafers (cost reduction)
 80%
 70% reduction in finger width
 • less silver metallization (cost reduction)
 for ≥ M10 wafers

 60% • increase active cell area (efficiency gain)
 50%
 improved redundancy and reliability
 40% • higher likelihood of fractured cell fragments staying electrically connected
 30% • minimizes localized mechanical stresses around busbars

 20% Potential Risks
 10%
 introduction of new manufacturing processes and materials
 0% • geometry change from rectangular ribbons to wires
 2021

 2022

 2024

 2026

 2029

 2032
 • material change from metallurgical connections to mechanical contact

 9-10 11-12 > 12 Busbarless
ITRPV (2022)

 15
traditional zero-gap technologies

 Geometry & process changes

 100%
 Drivers & Benefits
 80% increasing number of busbars
Global market share

 • allows for reduction of cross-sectional ribbon area
 60%
 allow for low-temperature approaches
 40% • future-proofing for new cell technologies as SHJ
 increased efficiency
 20% • increase active cell area and light reflection on wire
 • reduced gap between cells or overlapping cells
 0%
 2016
 2017
 2018
 2019
 2020
 2021

 2023

 2025

 2028

 2031
 Potential Risks

 Cu-ribbon Cu-wires Structured foils Shingled/overlapping geometry changes
 • multiwire might need thicker encapsulant
 process changes
 • new components, such as structured foils, may require new reliability tests
 shingled/overlapping cells
Author synthesis of data from ITRPV (2017–2021) • potentially higher stresses at overlapping cell edge, increasing fracture risk
SolarTech Universal (2022)

 16
traditional zero-gap technologies

 Material changes

 100% Drivers & Benefits
 90% potential regulatory requirements
 80% • materials containing lead are restricted under EU Directive (RoHS 2)

 70% cost savings potential
 • reduction of silver content
 Global market share

 60%
 reduce processing temperatures and material input
 50% • required for new cell technologies such as SHJ
 • reduce thermal stresses
 40%
 • elimination of processing steps such as soldering at high temperature
 30%
 Potential Risks
 20%
 change in solder materials (high vs. low temp & lead-containing vs. lead-free)
 10% • potential degradation from poorer mechanical characteristics
 • change from metallurgical connection to mechanical contact will require
 0%
 new accelerated tests and development of standards
 2016
 2017
 2018
 2019
 2020
 2021

 2023

 2025

 2028

 2031

 Electrically conductive adhesives
 Lead-containing soldering Lead-free soldering Conductive adhesive • introduction of possible new degradation mechanisms such as debonding
 or corrosion of non-silver conductive particles
Author synthesis of data from ITRPV (2017–2021)

 17
Bifacial modules

 Large modules Interconnects Bifacial Cell technology

 18
Bifacial modules
 100% Foil- Drivers & Benefits
 foil
 90% enabled by new(er) cell technologies
 • increased power output
 80% Glass- • cost gap between mono- and bifacial module keeps decreasing

 70% foil
 Potential Risks
 Global market share

 60% increased weight
 • glass-glass construction with large format module leads to higher risk of
 50% damage during shipping, handling, and installation
 40% corrosion
 • acetic acid formation from EVA encapsulant
 30% Glass-
 glass cell fracture risk
 20% Bifacial • benefits of putting cells into neutral axis, might be offset by residual
 modules stresses introduced during lamination
 10% • thinner glass front sheets make cells more prone to crack during hail events
 0% rear-side potential induced degradation (PID)
 2021 2022 2024 2026 2029 2032 • degradation due to depolarization of the passivation layers (PID-p)
 Bi module, bi cell Mono module, bi cell • corrosive PID (PID-c) due to corrosion of the Si below the passivating layers
 Mono module, mono cell Glass-glass rear-side light-induced degradation (LID)
 Glass-foil Foil-foil • potentially very slow to no recovery
Author synthesis of ITRPV (2022)

 19
Thinner glass
 100% Drivers & Benefits
 90% bifacial module technology
 80%
 • need for transparent backsheet
 decreasing weight - cost savings
 70%
 Global market share

 • lighter glass reduces shipping and installation costs, but ultrathin glass can
 60% be expensive

 50% Potential Risks
 40% change in structural integrity
 • possibly larger deflection due to mechanical loading
 30%
 lower resistance to environmental factors and handling
 20%
 • decreased resistance to severe weather events (hail, wind, snow), and
 10% handling during installation

 0% change in heat treatment
 • thinner glass can require a process change from tempering to heat-
 2017

 2018

 2019

 2020

 2021

 2023

 2025

 2028

 2031 strengthening, which can increase the risk of glass breakage

 Front > 3 mm Front 2-3 mm Front < 2 mm
 Back > 3 mm Back 2-3 mm Back < 2 mm
Author synthesis of ITRPV (2018–2021)

 20
Polyolefin encapsulant
 100% Drivers & Benefits
 reduces acetic acid corrosion (compared to EVA)
 • but polyolefin encapsulant is ~10% more expensive than EVA and has
 80% ~0.25% lower transmission
 reduces risk of rear-side PID
Global market share

 60% • especially relevant for glass-glass type constructions

 Potential Risks
 40%
 cost-reduction methods introduce new manufacturing processes
 • different encapsulant types at the front and back of the cell might
 introduce new, unknown failure modes
 20% • co-extruded encapsulants – possible difficulties in controlling the thickness
 and uniformity of thin polyolefin layers

 0% process changes necessary
 • possible longer manufacturing times and narrower control windows for
 2016
 2017
 2018
 2019
 2020
 2021

 2023

 2025

 2028

 2031
 temperature
 TPU (thermoplastic polyurethane) PVB (polyvinyl butyral) long-term durability unknown
 PDMS (polydimethyl silicone)/silicone Extruded EVA w/polyolefin
 • often 10-20 years of data needed to discover issues
 Polyolefin White EVA
 EVA
Author synthesis of ITRPV (2017–2021)

 21
Cell technology

 Large modules Interconnects Bifacial Cell technology

 22
Transition to n-type cells Drivers & Benefits
 increased efficiency
 • higher charge carrier lifetime
 100% • improved temperature coefficient
 • less sensitive to metallic impurities of the silicon
 90%
 reduced light-induced degradation (LID)
 80%
 mono • boron-oxygen defect disappears when using n-type doping with phosphorous
 70% p-PERC
 Global market share

 reduced light and elevated temperature-induced degradation (LeTID)
 60% • possibly due to reduced hydrogen content in n-type cells and/or other factors
 50%
 Potential Risks
 40% n-type complexity & purity multiply cell sensitivities
 30% • vulnerabilities include diffusion of impurities into bulk wafer, UV-LID, and
 Al-BSF etc. degradation of ultrathin layers
 20% • may need specific stress combinations and long test cycles
 10% potentially different PID polarization
 0% • cell architectures (e.g., TOPCon, PERT, PERC) show different PID trends
 potentially lower reliability from new n-type cell market entrants
 • extended cell reliability testing might not be in place yet
 % other % n-type mono (all) % n-type other • packaging optimization still ongoing
 % n-type HJT % n-type TOPCon % p-type mono PERC higher silver content in contacts increases costs
 • copper (as a silver replacement) could introduce new reliability issues
Author synthesis of data from Stoker (2021c) and InfoLink (2022)

 23
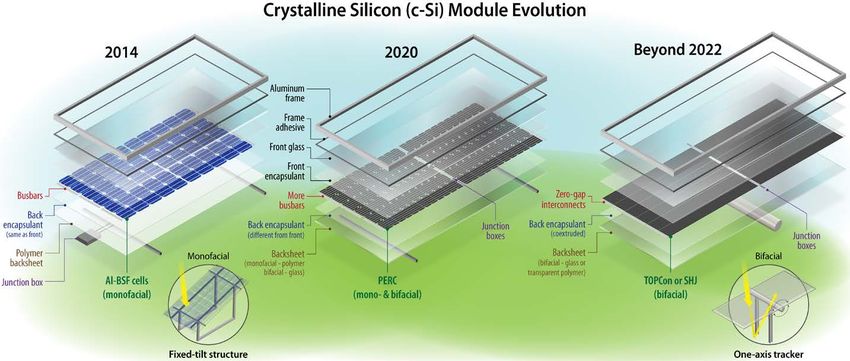
Cell technologies
 p-type transition to n-type
 PERC (Passivated Emitter and Rear Cell) TOPCon (Tunnel Oxide Passivating Contact) SHJ ( Silicon hetero-junction solar cell)

Drivers & Benefits
• supply chain is aligned with the technology • physical separation of rear metal from bulk Si • superior surface passivation quality improves
• industry transitioned from boron to gallium reduces surface recombination and improves carrier lifetime and increases cell voltage even
 doping to mitigate boron-oxygen LID carrier lifetime and cell voltage (720 mV) further (750 mV)
 • inherently bifacial • inherently bifacial and very high bifaciality

Potential Risks & Challenges
• current production cells close to practical • newer technology than SHJ - less production • after deposition, process temperature limited
 efficiency limits - further improvements history, but fundamentally compatible with to
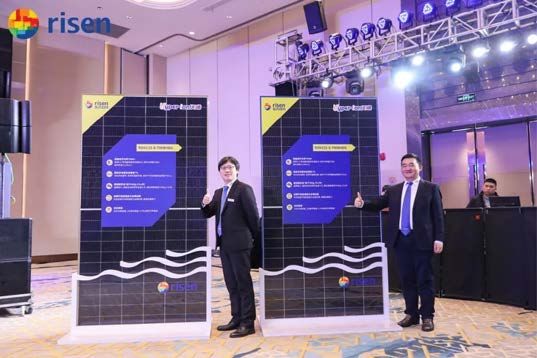
Case study: recent 700 W SHJ module announcement
 Power output 700 W
 Module size ≈1.3 m x 2.35 m ≈ 3.0 m2
 Cell size 210 mm / half-cut
 Cell thickness 120 μm

 Xiao (2022) Module efficiency 22.52%

 Metallization low temperature, low silver
 Interconnect type multiwire
 Interconnect # 24

 Cell technology n-type SHJ
 a-Si film replaced with microcrystalline Si
 Cell efficiency 25.2%
 VOC 750 mV

 Cell SHJ inherently high bifaciality

(Photo from Risen Energy Group, with permission) Module bifacial

 25
Next steps

• Synthesize feedback from reviewers and webinar audience
• Prioritize trends and risk areas by potential impact
• Identify key knowledge gaps and potential new research
 needed to fill those gaps
• Finalize the report and distribute for peer review

• Update annually, starting in 2023

 26
Building-integrated PV

 Additional trends
 Agrivoltaics Tandems

 (Photo by Dennis Schroeder / NREL)

 (HZB)
 Floatovoltaics
 (Photo by Werner Slocum / NREL) Trackers

Standardization
 module size cell size connectors

 … (Photo by Dennis Schroeder / NREL)

 (Photo by Werner Slocum / NREL)

 27
Thank you!

Contacts
Jarett Zuboy: Jarett.Zuboy@nrel.gov
Martin Springer: Martin.Springer@nrel.gov
Elizabeth Palmiotti: ecpalmi@sandia.gov
Teresa Barnes: Teresa.Barnes@nrel.gov
Joe Karas: Joseph.Karas@nrel.gov
Brittany Smith: Brittany.Smith@nrel.gov
Michael Woodhouse: Michael.Woodhouse@nrel.gov

NREL/PR-5K00-82871

This work was authored by the National Renewable Energy Laboratory, operated by Alliance for Sustainable Energy, LLC, for the U.S. Department
of Energy (DOE) under Contract No. DE-AC36-08GO28308. Funding provided as part of the Durable Module Materials Consortium 2 (DuraMAT 2)
funded by the U.S. Department of Energy, Office of Energy Efficiency and Renewable Energy, Solar Energy Technologies Office, agreement number
38259. The views expressed in the article do not necessarily represent the views of the DOE or the U.S. Government. The U.S. Government retains
and the publisher, by accepting the article for publication, acknowledges that the U.S. Government retains a nonexclusive, paid-up, irrevocable,
worldwide license to publish or reproduce the published form of this work, or allow others to do so, for U.S. Government purposes.

 28
References
Bosco, N. et al. In review. “Turn Your Half-Cut Cells for a Stronger Module.” IEEE Journal of Photovoltaics.

DOE (U.S. Department of Energy). 2021. Solar Futures Study. Washington, DC: DOE. https://www.energy.gov/eere/solar/solar-futures-study.

InfoLink. 2022. “N-type module: capacity and shipment (2020–2025).” https://www.infolink-group.com.

ITRPV (International Technology Roadmap for Photovoltaic). 2017–2022. Results. 2016–2021 (8th to 13th editions). VDMA.
https://www.vdma.org/international-technology-roadmap-photovoltaic.

IPCC (Intergovernmental Panel on Climate Change). 2007. AR4 Climate Change 2007: The Physical Science Basis. Figure 10.8. Cambridge and New
York: Cambridge University Press.

Jordan, D., T. Barnes, N. Haegel, and I. Repins. 2021. “Build solar-energy systems to last — save billions.” Nature 600: 215-217.

Jordan, D.C., N. Haegel, and T.M. Barnes. 2022. “Photovoltaics module reliability for the terawatt age.” Progress in Energy 4: 022002.

Smith, B., M. Woodhouse, K.A.W. Horowitz, T.J. Silverman, J. Zuboy, and R.M. Margolis. 2021. Photovoltaic (PV) Module Technologies: 2020
Benchmark Costs and Technology Evolution Framework Results. Golden, CO: National Renewable Energy Laboratory.
https://www.nrel.gov/docs/fy22osti/78173.pdf.

SolarTech Universal. 2022. “Smart Wire Connection Technology.” Accessed 2022. https://www.solartechuniversal.com/smartwire-technology.

 29
References
Stoker, L. 2021a. “Built solar assets are ‘chronically underperforming’ and modules degrading faster than expected, research finds.” PV Tech,
June. https://www.pv-tech.org/built-solar-assets-are-chronically-underperforming-and-modules-degrading-faster-than-expected-research-finds.

Stoker, L. 2021b. “Solar module failure rates continue to rise as record number of manufacturers recognised in PVEL Module Reliability Scorecard.”
PV Tech, May. https://www.pv-tech.org/solar-module-failure-rates-continue-to-rise-as-record-number-of-manufacturers-recognised-in-pvel-
module-reliability-scorecard.

Stoker, L. 2021c. “The race to the TOPCon.” PV Tech Power, November. www.pv-tech.org/power.

Willuhn, M. 2022. “The weekend read: The financial risk of investing in PV systems and the ‘Peter PAN’ files.” PV Magazine, April. https://www.pv-
magazine.com/2022/04/30/the-weekend-read-the-financial-risk-of-investing-in-pv-systems-and-the-peter-pan-files.

Woodhouse, M., D. Feldman, J. Zuboy, B. Smith, V. Ramasamy, and R. Margolis. 2022. “Considerations for Establishing Manufacturing Across the
Solar Photovoltaic (PV) Supply Chain.” Presentation to the SEIA Solar Manufacturing Forum, March 2022. Golden, CO: National Renewable Energy
Laboratory.

Xiao, C. 2022. “Thinner cells, more busbars and gigawatt manufacturing capacity: Inside Risen’s heterojunction plans.” PV Tech,
May. https://www.pv-tech.org/thinner-cells-more-busbars-and-gigawatt-manufacturing-capacity-inside-risens-heterojunction-plans/.

 30
You can also read