Techno-economic performances of future concentrating solar power plants in Australia
←
→
Page content transcription
If your browser does not render page correctly, please read the page content below
ARTICLE
                  https://doi.org/10.1057/s41599-021-01005-3               OPEN

                  Techno-economic performances of future
                  concentrating solar power plants in Australia
                  Alberto Boretti         1✉   & Stefania Castelletto2

                  The prediction of the techno-economic performances of future concentrated solar power
                  (CSP) solar tower (ST) with thermal energy storage (TES) plants is challenging. Nevertheless,
1234567890():,;

                  this information is fundamental to energy policymakers. This work aims to fill the knowledge
                  gap regarding estimations of costs, amount, and quality of electricity produced by these
                  plants over their lifetime. Every estimate should be based on real-world data of actual costs
                  incurred to build and maintain constructed plants, and their actual electricity production,
                  sampled with high frequency, to be reliable. Here we discuss as the available information is
                  insufficient. There has been so far very limited transparency on the real cost and performance
                  of CSP plants built and operated worldwide, and in the very few cases where data has been
                  made public, for example, Crescent Dunes in the United States, costs have been much higher
                  than expected, while annual average capacity factors have been much less. Important sta-
                  tistical parameters such as the standard deviation of the capacity factor with high-frequency
                  sampling have never been provided. We conclude as the techno-economic performances of
                  these plants are therefore unpredictable with accuracy until a significant number of plants will
                  be built and operated, their costs and operating parameters will be shared, and their delivered
                  techno-economic performances will be compared to the modeled values, finally permitting
                  validation of the techno-economic analysis tools.

                  1 Deanship of Research, Prince Mohammad Bin Fahd University, Al Khobar 34754, Saudi Arabia. 2 School of Engineering, Royal Melbourne Institute of

                  Technology (RMIT) University, 3083 Bundoora, Melbourne, VIC, Australia. ✉email: a.a.boretti@gmail.com

                  HUMANITIES AND SOCIAL SCIENCES COMMUNICATIONS | (2021)8:326 | https://doi.org/10.1057/s41599-021-01005-3                                            1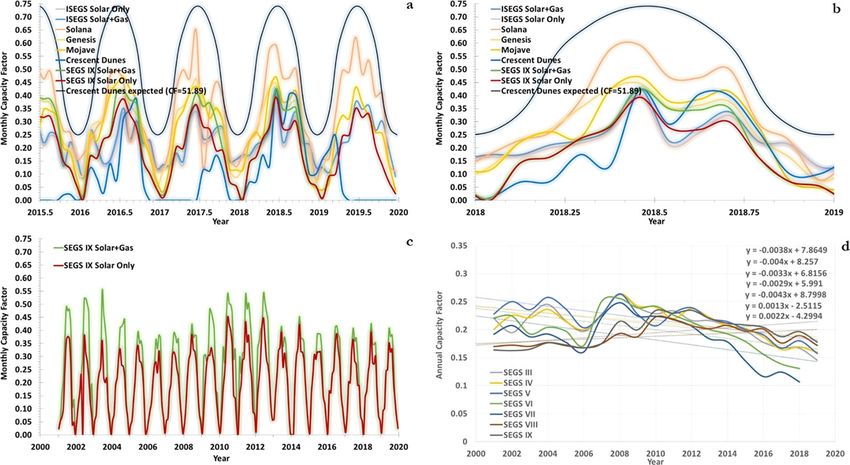
ARTICLE HUMANITIES AND SOCIAL SCIENCES COMMUNICATIONS | https://doi.org/10.1057/s41599-021-01005-3
C
Introduction
oncentrated solar energy in Australia has been the subject $/kWh compared to an average of about 10 c AU$/kWh, hydro
of few works (Baig et al., 2015; Clifton and Boruff, 2010; generation is run for maximum profit and not maximum
Dawson and Schlyter, 2012; Peterseim et al., 2014; Ghadi production.
et al., 2019; Middelhoff et al., 2022; Narimani et al., 2016), with Figure 2 (from Aneroid Energy, 2019) presents a sample grid
however practically no plant built and operated so far. Worth average production of electricity of wind and large solar PV over
mentioning there is only a small 9 MW Fresnel section added to a a sample month, July 2019. Being the wind energy production
coal-fired power plant to pre-heat the feedwater, which does not proportional to the wind energy resource, individual wind farms
qualify as a concentrated solar power (CSP) plant. Hybrid plants have capacity factors ε, the ratio of generating power to nominal
concentrated solar energy plus biomass are becoming popular in capacity, variable from zero to 100%, with averages of about
the literature (Middelhoff et al., 2022), while hybrid plants con- 30–35% over a year. In terms of grid average ε, despite the
centrated solar energy plus coal were more favored until recently exceptionally long grid, grid averages ε may go down to even
in the academic works (Ghadi et al., 2019), despite it is below 5% or above 60%. Even worse variability is provided by
acknowledged also locally as the dispatchability of CSP plants solar PV, with everyday production going to zero during the
with thermal energy storage (TES) makes this opportunity night, and up to a maximum during the daytime that differs day-
extremely attractive (Narimani et al., 2016). The last few years by-day and season-by-season, reaching sometimes 100%. Varia-
have seen a dramatic increment of installed capacity of wind and bility is still substantial also at the grid average level.
solar facilities, with these latter facilities in the case of Australia Owing to this irregularity, wind or solar facilities of total power
limited to large and roof-top photovoltaic (PV) only. No facility X need balancing facilities, either conventional combustion fuels
has been built yet or is being built, featuring concentrated solar or hydro-gravity, of about the same total power X. This is the
power (CSP). This anomaly needs an explanation, that is not reason why the cost of electricity for consumers has increased
available in the current literature. Also uncovered in the current from about 10 AU$c/kWh up to 2007 when there was no wind
literature are the potentials of the CSP technology in Australia, nor solar, to the already 25 AU$c/kWh of 2013 (Parkinson, 2013),
despite the debacles suffered so far. up to the present above 40 AU$c/kWh. To support a larger
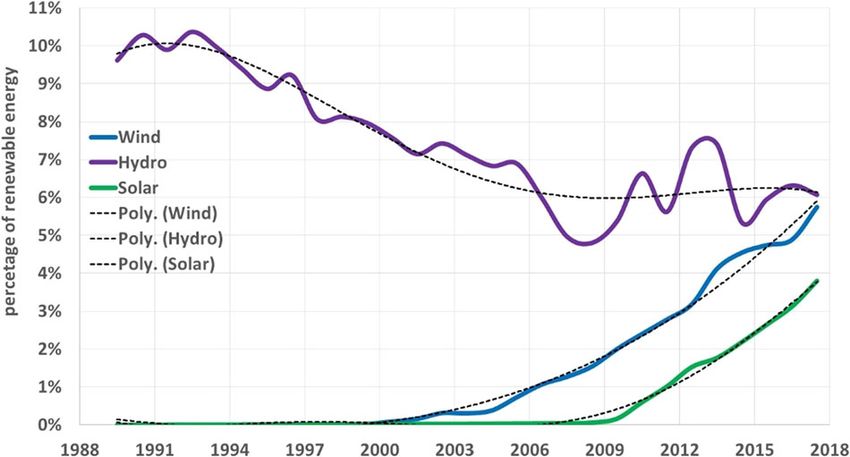
As shown in Fig. 1, data from the Department of the Envir- uptake of wind and solar, energy storage is needed, and this will
onment and Energy (2019), in the last fiscal year of the statistic introduce additional costs, apart from technological challenges.
(2017–2018), the contribution of the variable and unpredictable Pumped hydroelectric energy storage (PHES) is the easiest way
wind and variable, unpredictable and intermittent solar PV was to supply electric energy storage (Rehman et al., 2015).
5.74 and 3.80%, with worth to mention also a reliable and dis-
patchable hydro contribution of 6.07%. Since the end of the
1980s, when the renewable energy contribution was about 10%
hydro, and 0% solar photovoltaic and wind, there has been
therefore a dramatic increment of wind and solar, but a reduction
of hydro. Biomass was 0.5% at the end of the 1980s and it is 1.5%
now. Geothermal was, and it is, negligible. The growth of wind
and solar is partially balanced by the reduction of hydro. This
reduction is simply the result of the wholesale pricing of elec-
tricity in Australia.
The National Electricity Market (NEM) grid, covering only
part of South Australia, Tasmania, Victoria, Australian Capital
Territory, New South Wales, and Queensland, is presently fed
with a growing amount of wind and solar PV energy, that is
balanced by the combustion of fossil fuels, and the hydroelectric
production, to cover the demand.
The NEM grids stretch for about 5000 km from Port Douglas,
tropical north Queensland, to Port Lincoln, South Australia, also
serving Tasmania across the Bass Strait. As the NEM market is a
wholesale market where “retailers” buy and “generators” sell
electricity, with the peak wholesale spot prices about 14 AU
Fig. 1 Contributions of hydro, wind, and solar to the NEM grid. Data from Fig. 2 Energy production by the source in the NEM grid during July 2019.
the Australian Government Department of the Environment and Energy a Totals. b Wind. c Solar photovoltaic facility. Images reproduced with
(2019). permission from Aneroid Energy (2019).
2 HUMANITIES AND SOCIAL SCIENCES COMMUNICATIONS | (2021)8:326 | https://doi.org/10.1057/s41599-021-01005-3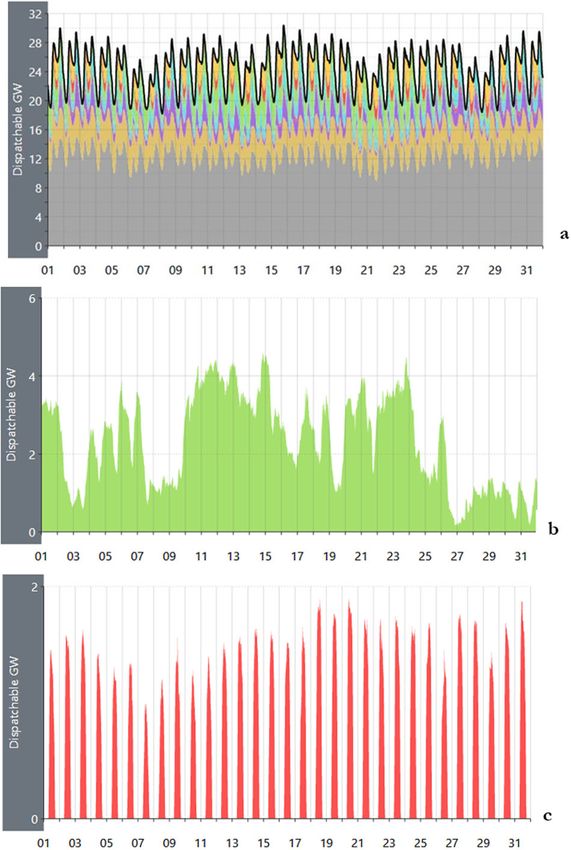
HUMANITIES AND SOCIAL SCIENCES COMMUNICATIONS | https://doi.org/10.1057/s41599-021-01005-3                                        ARTICLE

Unfortunately, PHES has round-trip efficiencies of 70 to 80%, less            and Trieb, 2004). The solar field is a large array of many dual-axis
than the 95% round-trip efficiency of Li-ion batteries. While                 heliostats concentrating sunlight onto the central receiver atop
traditional hydro-gravity plants are being upgraded to PHES by               the tower. The concentrated light warms up the molten salt to the
adding a pumping facility, and the largest energy storage facility           hot tank. Steam is then produced in a heat exchanger between the
of Australia, the 1800 MW Tumut 3, is PHES, as these plants were             molten-salt hot and cold tank. The steam expands in a turbine to
already providing on-demand production of electricity, their                 generate electricity (Law et al., 2014; Law et al., 2016). The con-
support is limited.                                                          denser is air-cooled and sometimes evaporative or hybrid.
   The further expansion of PHES in Australia should progress                   The signature of the power purchased agreement (PPA) for
along the coast, where cliffs may provide the required head.                 Aurora was wrongly assumed as proof that fully dispatchable
However, salt-water PHES is everything but an established                    solar energy was possible at 6 c US$/kWh in Australia. This claim
technology. A single pilot plant has been built, briefly operated,            was neglecting the additional source of revenues from the large-
and then dismantled all over the world.                                      scale-generation-certificates (LGCs), and the no-interest loan
   Added to PHES, battery energy storage (BES) is the other                  provided to the developer, and even more than that, the extremely
promising technology, with the largest Lithium-ion battery, the              poor performance of the already built Crescent Dunes plant
150 MW/194MWh MW Hornsdale facility, located nearby the                      featuring the same design in the United States, delivering about ¼
Hornsdale wind energy facilities to help to balance the output.              of the expected electricity subjected to many failures.
The latest 50 MW/64 MWh phase 2 of 2019 had a cost of 71                        From a very subjective view of the PPA for Aurora, the
mAU$ (50 m US$). Coupled for example to solar PV of daily                    150 MW rated power, 135 MW under normal operating condi-
cyclic variability, if we take daily cycles 30 to 80% state-of-charge,       tions, the plant was claimed to have an alleged cost of only AU$
over a 15 years’ life span, this is an additional cost of storing/           650 million (US$ 457 million), and the ability to deliver 495 GWh
releasing the energy of US$ 28 c/kWh. If the life span increases to          of fully dispatchable electricity annually over 20 years. The sub-
30 years, that is fairly optimistic, this is still US$ 14 c/kWh. Thus,       jective claim that fully dispatchable solar electricity could, there-
even if we produce electricity with solar PV at the optimistic cost          fore, be produced at US$ 0.061 with the specific technology
of 4 c/kWh, the cost for having solar PV electricity all day will be         circulated in the press (smh.com.au, 2018; reneweconomy.com.au,
(4 + 4 + 14)/2 = 11 to (4 + 4 + 28)/2 = 18 c/kWh (day and night              2018; ABC News, 2017), as well as the peer review (Pitz-Paal,
are on average 12 h a day).                                                  2017; Lilliestam et al., 2017; Lilliestam and Pitz-Paal, 2018; Feld-
   Thus, there is the opportunity to benefit from the construction            man and Margolis, 2018). Murphy et al. (2019) moved even fur-
of CSP ST with TES in Australia, as this is the only solar tech-             ther, to forecast costs of US$ 0.05 per kWh by 2030 of this specific
nology that permits some sort of dispatchability without the need            technology based on the PPA for Aurora.
for external energy storage. CSP with TES has the advantage of                  The actual costs were larger. The LGCs were valued at around
dispatchability without external energy storage. Hence, these                AU$ 80/MWh, which was already more than double the cost. A
facilities may deliver an output much closer to power on-demand              low-interest loan of 110 million AU$ was also provided to the
or constant power than wind and traditional solar PV can do.                 developer. Then, from the consumers’ perspective, there were to
   CSP ST, according to Kuravi et al. (2013), Liu et al. (2016), and         factor indirect costs of the larger share of unreliable electricity
IRENA (2012) are expected to quickly take over CSP PT, because               production in a state, South Australia, where peak power prices
of the alleged advantages of higher efficiency in converting sun              were already up to AU$ 14,000/MWh after the closure of the state
energy to electricity. CSP needs significant direct normal radia-             coal-fired power plants.
tion (DNI), and electricity production in concentrated solar                    The single plant of the same technology as Aurora built in the
power falls dramatically with cloud coverage. CSP is not com-                world by the same developer, Crescent Dunes, Tonopah, Nevada,
petitive in cost with PV, which also suffers much less cloud                 USA, of 110 MW capacity net, and 10 h of molten-salt TES, had a
coverage.                                                                    cost of 975 million US$ in 2015 values, corresponding to 1046
   The advantage of CSP is the opportunity to store energy in the            million US$ at 2019 values. However, while the planned elec-
molten-salt TES, as shown in Yang and Garimella (2010), Herr-                tricity generation was 500,000 MWh/year (ε = 51.89%), the actual
mann et al. (2004). TES allows in principle to fully decouple                electricity produced in the best year up to the time the PPA was
electricity production from the availability of solar energy. This           signed was only 127,308 MWh/year (ε = 13.21%).
opportunity is developed more, the larger is the number of hours                As discussed in Boretti (2019a), to expect roughly six times
of the TES design. CSP, as a dispatchable form of solar energy,              better electricity production per $ invested (slightly less than
has a significant added value vs. PV.                                         three times better electricity production at slightly less than half
   The work aims to explain why Australia has an expanding                   the cost) of what was built and operated, in a worse site for what
capacity of wind and solar PV power plants but has not built yet a           concerns the direct normal irradiance (DNI), 2382 kWh/m2/yr.
single CSP plant, and why this situation is going to change shortly          vs. 2671 kWh/m2/yr., and with slightly less promising plant
aiming at a renewable energy-only grid.                                      details, 2 h shorter TES, and dry, rather than the hybrid cooling
                                                                             condenser, was contemptibly optimistic. No investor, therefore,
                                                                             decided to risk on this project, which was canceled, ABC News
Methods
                                                                             (2019).
Summary of recent CSP projects in Australia and the rest of the
                                                                                Unfortunately, the failure of the Aurora project, as well as the
world, with estimated levelised cost of electricity compared to
                                                                             premature closure of the Crescent Dunes plant in the United
wind and solar PV. Inclusion of energy storage for dispatchability
                                                                             States, and the cancellation of the other similar projects in the
in the costs comparison.
                                                                             world by the same developer, has dramatically reduced the
                                                                             chances that CSP could grow in Australia as well as the rest of
Results                                                                      the world.
The first CSP plant supposed to be built in Australia was the                    The failure is due to the surpassed design and the use of
Aurora power plant, featuring about the same of the technology               substandard components to pursue the impossible goal to com-
of Crescent Dunes in the United States, CSP ST with molten-salt              pete price-wise with solar PV without accounting for the dis-
TES. This technology generates solar power concentrating sun-                patchability. If dispatchability is not valued, then CSP with TES
light onto a small area (Boerema et al., 2013; Müller-Steinhagen             cannot compete with solar PV. While trying to make CSP ST with

HUMANITIES AND SOCIAL SCIENCES COMMUNICATIONS | (2021)8:326 | https://doi.org/10.1057/s41599-021-01005-3                                        3
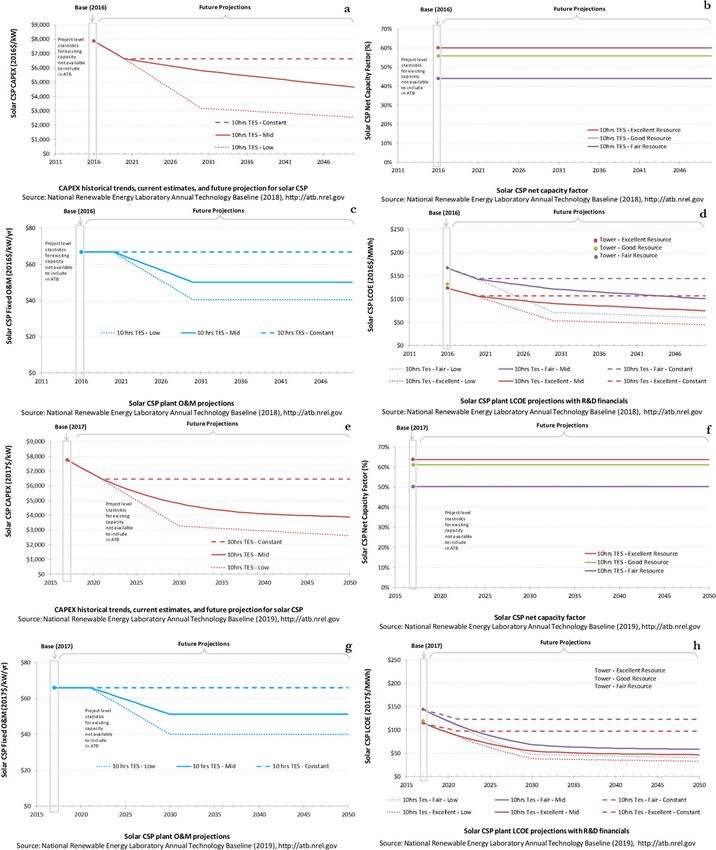
ARTICLE                                 HUMANITIES AND SOCIAL SCIENCES COMMUNICATIONS | https://doi.org/10.1057/s41599-021-01005-3

TES for 6 c/kWh in 2019 was impossible, just a few c/kWh more              operational in the world with data available are the 110 MW net
for a better design could have provided a cost-effective solution          Crescent Dunes, of 2019 actualized cost of 9509 US$/kW, and the
(again, when BES is factored, costs of solar PV are 11 to 18 c/            377 MW net Ivanpah Solar Electric Generating System (ISEGS),
kWh).                                                                      Ivanpah, California, USA, of 2019 actualized cost 6260 US$/kW.
   Forecasting of cost and production of plants CSP with TES has           ISEGS has a distinctive design, boosting production of the ST
been done so far (NREL, 2018) adopting surveys by expert panels            without TES burning natural gas to ramp up (and support)
not based on real-world plant utility-scale built and operational.         production.
NREL proposes “consensus trends” for ε and Levelized costs of                 Completed in 2015, the 110 MW CSP ST with molten-salt TES
electricity (LCOE) that are not based on any reliable statistic.           of Crescent Dunes, of 2019 actualized cost of 9509 US$/kW, has
They only consider CSP ST with TES and neglect the much more               delivered annual ε of 13.03% in 2016, 4.42% in 2017, and 21.49%
reliable and widespread PT technology. The cost and perfor-                in 2018. It is 5.39% in 2019 after the plant was shut down in
mance prediction by IRENA (2012), the starting point for the               April, still better than the 2017 result. The planned ε of Crescent
NREL predictions, was similarly made without any plant utility-            Dunes was much better than the delivered, 51.89%.
scale (>100 MW) built. No real-world experience was included in               Better ε are delivered by recent CSP PT installations, solar only
the projections.                                                           with no TES, such as the 2014 250 MW net Genesis, of 2019
   Remarkable, after the Crescent Dunes plant was finally built             actualized cost of 5360 US$/kW or the 2014 250 MW net Mojave,
and operated featuring the reference technology, but delivering            of 2019 actualized cost of 6880 US$/kW. Solar only with TES
worse performances despite the higher costs, the forecasted cost           plants, such as the 2013 250 MW net Solana, of 2019 actualized
and production were revised by NREL in the wrong direction by              cost 8720 US$/kW, are also working better.
taking into consideration instead the power purchase agreement                Completed in 2014, Genesis has delivered annual ε of 28.51%
(PPA) signed for Aurora (Boretti, 2019a).                                  in 2016, 28.61% in 2017, 28.46% in 2018, and 28.14% in 2019.
   Analyses of the performance of utility-scale solar thermal              The planned ε of Genesis was less than the delivered, 26.48%.
power projects, in which actual performance and cost are com-                 Also completed in 2014, Mojave has delivered an annual ε of
pared to the predicted performance and the projected cost in               28.53% in 2016, 27.12% in 2017, 27.12% in 2018, and 23.42% in
which PT technology is compared to ST technology have been                 2019. The planned ε of Mojave was about the delivery of the first
recently added to the literature (Boretti, 2018a, 2018b; Boretti           year, 28.17%. The performance of Mojave is now deteriorating.
et al., 2018). Projections of costs and performances by NREL have             Completed in 2013, Solana has delivered ε of 29.37% in 2016,
not yet reflected these real-world experiences.                             33.08% in 2017, 35.43% in 2018 and 36.04% in 2019. The planned
   Apart from Australia, which provides real-world production              ε of Solana was better than the delivered, 43.11%.
data of every power station with 3 min sampling frequency, and                Completed in 2014, the ε of Ivanpah, are marginally above 20%
the United States, which provides data every month, the infor-             despite the considerable boost by natural gas combustion 19.78%
mation about the real-world operation of renewable energy                  in 2015, 21.35% in 2016, 21.75% in 2017, 24.11% in 2018, and
facilities is mostly unavailable. Unfortunately, Australia never had       23.31% in 2019. The planned ε of Ivanpah was also much better
a CSP plant.                                                               than the delivered, 32.68%, with negligible combustion of
   The number of CSP plants operational worldwide is limited, as           natural gas.
shown in Table S.1 in the Supplementary. Most of these plants                 While the performance of Genesis is stable, and the perfor-
have been completed only recently, for none of these plants the            mance of Mojave is deteriorating after only a few years, the
information of electricity production with a high sampling rate is         performance of Solana is further improving even if minimally
available. Only for the stations within the US, there is enough            over the last 12 months.
information with monthly data available since completion, but no              Also, CSP PT installations completed in the 1980s and still
high-frequency sampling.                                                   operational, such as 7 of the 9 Solar Energy Generating Systems
   Regarding the power stations of Morocco, there is no data on            (SEGS) plants, work better than Crescent Dunes and Ivanpah.
electricity production, apart from data of the year 2017 leaked by            At about 80 MW each, the complex was producing 354 MW of
a student doing an internship in Noor 1.                                   total power. SEGS IX has delivered a 2019 annual average ε of
   Similarly missing are the data of the electricity production from       19.99%, but with only a small contribution by natural gas
the plants of China, South Africa, and India.                              combustion.
   For the power stations in Spain, sometimes the figures for                  The data of electricity production and natural gas combustion
annual electricity production have been circulated. However, the           used is provided by a reliable source, the United States Energy
data are not public domain as it is in the United States.                  Information Administration (EIA), and it is in the public domain
   Regarding the power station in the UAE, it was reported (Sills          (EIA, 2019).
and Daya, 2010), that because of substantial atmospheric dust,                Figure 3 presents a comparison of the monthly ε that a CSP
solar radiation received by Shams’ solar collectors was less than          with TES should deliver to achieve an annual average ε of 51.89%
expected and more collectors would be required. Information                as expected for Crescent Dunes, plus the actual ε of Crescent
about other difficulties operating in the harsh environment of the          Dunes, Genesis, Mojave, Solana, ISEGS, and SEGS IX over the
Gulf is not provided. Since 2013, no electricity production has            last four years and during the year 2018.
been published. The figure presented in Table S.1 for electricity              The figure also presents the data of the SEGS IX plant since
production from the listed source is unclear if predicted or               2001 (this is the year the EIA statistic starts, but this plant is
delivered, and it is of uncertain origin. From Table S.1, it appears       operational since 1990) showing the relatively stable production
that only the PT technologies can be considered mature, with TES           of this design. Since 2001, this plant has operated with an annual
or without TES. The number of plants built and operated so far             ε maximum of 33.11%, a minimum of 19.70%, and an average of
with also data available permits the definition of a small, but still,      24.61%, with minimum support from the combustion of
significant statistical sample, to be used for forecasting. Opposite,       natural gas.
the information about the ST technologies is less, as there is in             When there is a boost by natural gas combustion, the EIA
practice only one example to consider without TES (Ivanpah),               differentiates between the sun and natural gas heat supply. As
plus only one example with TES (Crescent Dunes). From Table                discussed in Boretti (2018a, 2018b), this attribution is incorrect
S.1, the only two plants >100 MW featuring ST presently                    for two reasons. First, natural gas would be better used in a

4                          HUMANITIES AND SOCIAL SCIENCES COMMUNICATIONS | (2021)8:326 | https://doi.org/10.1057/s41599-021-01005-3
HUMANITIES AND SOCIAL SCIENCES COMMUNICATIONS | https://doi.org/10.1057/s41599-021-01005-3                                                               ARTICLE

Fig. 3 Technical performances of existing CSP PT and ST plants with and without TES. a, b The monthly ε following seasonal irradiance variability of a
CSP plant with molten salt TES delivering the annual average ε of 51.89% expected for Crescent Dunes, and the actual ε of the plants of Crescent Dunes
CSP ST with 10 h molten salt TES, Genesis and Mojave CSP PT without any TES, Solana CSP PT with 6 h molten salt TES, ISEGS CSP PT without any TES
but boosted by natural gas combustion, and SEGS IX, CSP PT without any TES but boosted by natural gas combustion over the last 3 years and the year
2018. The actual production data is from EIA (2019). c The data of the monthly ε of the plant SEGS IX since 2001. 2001 is the year the EIA statistics start,
but this plant has been operational since 1990. This image shows the stable solar production of this design. d The data of SEGS III to SEGS IX since 2001 for
the solar production depurated of the natural gas boost as proposed by the EIA.

combined cycle gas turbine plant at twice the thermal efficiency of
the power cycle. Second, without this boost, the solar-only plant is             Table 1 CSP costs and performances in 2011 according to
not able to deliver what is indicated as solar only.                             IRENA (2012).
   The Figure also shows the data of the seven plants SEGS III to
SEGS IX since 2001 for the solar production depurated of the                                          Installed cost (2010          Ε (%)            Installed cost (2019
natural gas boost as it is proposed by the EIA.                                                       US$/kW)                                        US$/kW)
   Worth of consideration, the life span of 30 years, which is                   Parabolic trough (PT)
above the 25 years typically optimistically used in the PPA for                   No storage      4600                              20 to 25         5382
solar PV and wind, plus the relative stability of the sun output. A               6 h of storage 7100 to 9800                       40 to 53         8307 to 11,466
minimal decrement in the SEGS facilities ε sun only is an artifact               Solar tower (ST)
of reducing the natural gas boost in recent years, improperly                     6 to 7.5 h of   6300 to 7500                      40 to 45         7371 to 8775
accounted for in the EIA statistic.                                              storage
   For what concerns ISEGS and SEGS IX, the total electricity                     12 to 15 h of   9000 to 10,500                    65 to 80         10,530 to 12,285
production is obtained by also burning natural gas. The boost by                 storage
natural gas combustion is limited for SEGS IX and extreme                        The 2019 values are computed by using the US inflation calculator.
for ISEGS.
   According to the predictions of the 2012 report by (IRENA,
2012), Table 1, CSP ST plants with molten-salt TES should have                     Figure 4 presents the NREL Annual Technology Baseline
had a cost between 2010 US$ 6300 and 2010 US$ 10,500/kW of                      (ATB) for CSP of 2018 and 2019. In (a) is the CAPEX (CAPital
installed power (capacity), with TES between 6 and 15 h, and                    EXpenditures) in 2016 US$/kW of power installed, in (b) the ε, in
achieve ε from 40 to 80%, for electricity generation costs of about             (c) the O&M cost per year and kW of power, and finally in (d) is
2010 US$/kWh 0.17 to 0.29. By considering the inflation, this                    the levelized cost of electricity (LCOE) of the 2018 ATB. In (e),
translates a cost between 2019 US$/kW 7371 and 12,285, for                      (f), (g) and (h) are the revised figures of the 2019 ATB.
electricity generation costs of about 2019 US$/kWh 0.20 to 0.34.                   In the 2018 ATB, The CAPEX graph shows 8000 US$/kW as
   The National Renewable Energy Laboratory Annual Technol-                     the 2016 value, and it suggests a rapid reduction of the CAPEX up
ogy Baseline (ATB) 2018 and 2019 (NREL, 2018, 2019) also say                    to the time of the ATB and behind. Crescent Dunes, the only
that the present CSP technology is ST with molten-salt TES by a                 member of the population for this specific technology, had in
two-tank system. In their ATB, CSP plants with 10 h of TES are                  2015 a larger cost of 8863 US$/kW. There were also added costs
illustrated. This CSP ST with 10 h TES is the design featured by                needed to put the plant back in operation after the failure of the
the Crescent Dunes plant, which they say is representative of                   molten-salt TES system also known at the time of the ATB,
most new molten-salt TES CSP ST projects.                                       similarly ignored. A design such as Crescent Dunes does not have
   The fact that the only plant of this kind has been working very              a CAPEX of 6600 US$/kW in 2021.
badly and has been already shut down after only 4 years of life has                The ε graph differentiates between fair, good, and excellent
not impacted the NREL ATB of the last few years. PT is ignored.                 resources. A fair resource is Abilene, TX, 5.59 kWh/m2/day.

HUMANITIES AND SOCIAL SCIENCES COMMUNICATIONS | (2021)8:326 | https://doi.org/10.1057/s41599-021-01005-3                                                                5
ARTICLE                                  HUMANITIES AND SOCIAL SCIENCES COMMUNICATIONS | https://doi.org/10.1057/s41599-021-01005-3

Fig. 4 Techno-economic performances of future CSP ST plants with TES. a–d The version 2018 of the NREL Annual Technology Baseline data for CSP,
e–h the version 2019. a The CAPEX (CAPital EXpenditures) in 2016 US$ per kW of power installed. b The net capacity factor ε. c The O&M costs. d The
Levelized costs of electricity. Images reproduced after NREL (2018). e–h The same projections of techno-economic parameters in version 2019. Images
reproduced after NREL (2019). Credit DOE/NREL.

Here, according to NREL, the ε was 42% in 2016. A good                      2015, had in 2015 an ε of 0.37% in the three months it was run,
resource is Las Vegas, NV, 7.1 kWh/m2/day. Here, according                  then an ε of 13.20% in 2016. The ε of 2017 and 2018 has been
to NREL, the ε was 56% in 2016. Finally, an excellent resource              4.33% and 20.29%.
is Daggett, CA, 7.46 kWh/m2/day. Here, according to NREL,                      Regarding the Levelized cost of electricity, starting from an
the ε was 59% in 2016. Crescent Dunes, the only member of the               underrated present, the ATB then proposes an optimistic evolu-
population for this specific technology, in a site of excellent              tion, based on expectations of future technological improvements
resource, Tonopah, NV, 7.36 kWh/m2/day, commissioned in                     and cost reductions. Crescent Dunes was not delivering electricity

6                           HUMANITIES AND SOCIAL SCIENCES COMMUNICATIONS | (2021)8:326 | https://doi.org/10.1057/s41599-021-01005-3
HUMANITIES AND SOCIAL SCIENCES COMMUNICATIONS | https://doi.org/10.1057/s41599-021-01005-3                                                      ARTICLE

at 120 US$/MWh in 2016, and unlikely about the same design                   than planned amount of natural gas to boost combustion. There
will allow electricity production at 100 US$/MWh in 2021.                    have been so far several failures. Performance degradation is
   Moving from the 2018 ATB to the 2019 ATB, the only addi-                  unknown. The costs for repairs and the costs of using natural gas
tional real-world information that could have motivated revised              are unclear. The cost per kWh is difficult to be assessed. Con-
data is the further troublesome operation of Crescent Dunes.                 struction costs were 2.2 billion US$ in 2014. The life span of the
What we learn from Fig. 4 is that the CAPEX of 2017 is slightly              much simpler and more reliable CSP PT is 30 years. The life span
less than the CAPEX of 2016, but the new CAPEX of 2050 is                    of the more complex ST is not expected to be that long, especially
otherwise much less, 3950 US$ vs. 4800 US$ (mild trend).                     without major maintenance works. From January 2014 to Sep-
However, ε has dramatically increased from 60 to 65% (excellent              tember 2019 included (69 months) Ivanpah has produced
resources). The LCOE moves down accordingly.                                 3,899,050 MWh of electricity. Over the same time frame, Ivanpah
   Based on a subjective interpretation of the signature of the PPA          has also burned 5,790,918 million Btu of natural gas, with how-
of Aurora, but not the cancellation of this project the same as the          ever data for 7 months of the 69 missing not available or not
other projects by the same developer, these predictions have been            reported. If we take optimistically a life span of 25 years or
made even more unrealistic. (Murphy et al., 2019) assumes a                  300 months, Ivanpah will deliver a cost per kWh of roughly 0.13
present cost of only 61 US$/MWh and proposes a cost even lower               US$/kWh neglecting the repairs and the cost of the natural gas.
to 50 US$/MWh by 2030.                                                       Considering the cost of natural gas is presently very low, natural
                                                                             gas combustion does not increase too much the cost of electricity.
                                                                             The about 2.8·107 million Btu of natural gas that is expected to be
Discussion                                                                   burned by Ivanpah translates into a CO2 emission of 1.49·109 kg
In power generation, for other technologies, there are many                  (1 million Btu of natural gas has an associated emission of
power plants built and operated featuring the specific technology.            53.07 kg of CO2).
Thus, cost and electricity production can be forecasted based on                The only other CSP ST with monthly electricity production
real-world information such as the construction cost, the costs to           data and construction cost information is the previously men-
operate the plant, and the electricity production expected. If the           tioned Crescent Dunes completed in October 2015. Up to
technology is evolving, a reliable estimation of what can be                 November 2019, Crescent Dunes, which had a cost of 0.975 bil-
expected soon in absence of a breakthrough may then be obtained              lion US$ in 2015, has only produced 418,849 MWh of electricity
by using one forecasting method. None will produce definitive                 over 50 months of irregular production, with many interruptions,
answers, as nobody can see the future. Commonly used are                     with the last electricity produced in April 2019. This is only
moving averages, Exponential Smoothing (ETS), linear regres-                 2,513,094 MWh over 25 years or 0.39 $/kWh. As reported by
sion, parabolic regression. This procedure cannot apply for CSP,             Deign (2020), the developer, Solar Reserve appears to have ceased
in the specific ST technology with TES.                                       operations.
   Reality has been far from the predictions by NREL (2018) or                  With only these two CSP ST power plants in the database of
NREL (2019), as shown in Boretti (2018a, 2018b), and Boretti                 costs and electricity production above 100 MW of installed
et al. (2018), with much larger costs per unit of energy produced,           capacity, it is certainly impossible to conclude what this specific
because of the much smaller ε, and the much larger construction              technology can deliver in terms of dispatchable solar electricity
costs, of the ST plants, that have been so far inferior to the PT            and at which costs.
design.                                                                         Having a statistically significant population of facilities, for
   High-frequency generation data every minute or less are una-              what concerns the cost, if CAPEXi,j is the cost per unit nominal
vailable for CSP. This data is, however, essential to understanding          power, Pi,j is this nominal power, and εi,j is the annual capacity
if the models are really helpful. There is no data on electricity            factor of the facility i, completed in the year j, then the average
production from CSP with better than monthly resolution, which               CAPEXj over all the n facilities completed in the year j is:
is definitively not enough to appreciate the variability, or also to
validate models.
                                                                                               ∑ni¼1
                                                                                                    CAPEXi;j
                                                                                                       εi;j      εi;j  Pi;j       ∑ni¼1 CAPEXi;j  Pi;j
   Without accounting for the variability of the electricity supply,             CAPEXj ¼                                       ¼                           ð1Þ
CSP makes no sense, as solar PV and wind are much cheaper. As                                      ∑ni¼1 εi;j    Pi;j                  ∑ni¼1 εi;j  Pi;j
a stable grid needs a stable supply matching the demand
instantaneously, the key turn point in renewable energy is to
                                                                                This number should be then corrected for the energy storage
quantify and price variability. A kWh of electricity available only
                                                                             allowance.
during daylight time, or when the wind blows, has a different
                                                                                Similarly, the LCOEj is obtained as the generation averaged of
value from a dispatchable kWh of electricity. Thus, a variability
                                                                             the LCOEi,j.
parameter must be added the sooner the better in the technology
forecasting.
                                                                                                 ∑ni¼1
                                                                                                        LCOEi;j
   Data of resource, weather, as well as of plant components as                                           εi;j  εi;j    Pi;j       ∑ni¼1 LCOEi;j  Pi;j
well as plant output, should be collected simultaneously over a                      LCOEj ¼            n                        ¼                          ð2Þ
full year with high-frequency sampling to permit a proper vali-                                        ∑i¼1 εi;j  Pi;j                 ∑ni¼1 εi;j  Pi;j
dation of the models and their components. Dramatic differences
between expected and delivered performances are an indication                   Also looking at the generation average values for what con-
that the design is made by assuming the operation of components              cerns performance, at least two parameters should be considered.
and systems that are excessively optimistic. This poses the issue of         One parameter is the annual average εj, and one additional
substandard components, for example, a heat exchanger not                    parameter introduced to represent the variability about the
providing the expected reliability, under transient loads, and               annual average value is the standard deviation of the capacity
failing, or heliostats losing track.                                         factor δj.
   The largest CSP ST with monthly electricity production data                  A more appropriate LCOE should be based not only on
and construction cost information is the previously mentioned                CAPEX, ε, and the O&M costs, but also include the grid energy
Ivanpah completed in January 2014. The plant has performed so                storage allowance, which depends on ε and δ (Boretti,
far well below the expectations, despite burning a much larger               2019b, 2019c; Boretti and Castelletto, 2020).

HUMANITIES AND SOCIAL SCIENCES COMMUNICATIONS | (2021)8:326 | https://doi.org/10.1057/s41599-021-01005-3                                                     7
ARTICLE HUMANITIES AND SOCIAL SCIENCES COMMUNICATIONS | https://doi.org/10.1057/s41599-021-01005-3
The ε of the different facilities in the statistical sample con- with TES design, Crescent Dunes had a smaller size of the solar
sidered for the year j are also weighed on the electricity generated: field of heliostats per MW of turbine power (10,911 m2 vs.
ε 15,900 m2). Accounting for the higher solar resource of Crescent
∑ni¼1 εi;j εi;j Pi;j ∑ni¼1 εi;j Pi;j Dunes, this is still significantly less (solar input per MW of power
εj ¼
i;j
¼ ð3aÞ
∑ni¼1 εi;j Pi;j ∑ni¼1 εi;j Pi;j 28,915,162 kWh/yr. vs. 33,390,000 kWh/yr.). Thermal storage was
also less, 10 vs. 15 h.
ε By exploring, in the default model of SAM (NREL, 2020) for
∑ni¼1 εi;j εi;j Pi;j ∑ni¼1 εi;j Pi;j CSP ST with TES, that includes the latest costs of performances
δj ¼
i;j
¼ ð3bÞ
∑ni¼1 εi;j Pi;j ∑ni¼1 εi;j Pi;j by NREL, the opportunity of adopting a larger TES as well as a
larger solar field vs. the suggested optimum, for a 110 MW plant
Finally, forecasting techniques should be applied to the in the specific location of NEOM City, it is found (Boretti and
CAPEXj, LCOEj εj or δj, j = 1,…, m, where m is the time level, to Castelletto, 2021a) that:
infer the time trends.
Regarding CSP PT, even at 8720 US$/kW, an ε of 36%, O&M Increasing the TES from 10 to 16 h LCOE, mean ε and δ all
costs of 66 US$/kW/year, a plant such as Solana may permit an improve;
LCOE of 11.3 c US$/kWh working 30 years. Similarly, at 5360 US By increasing the size of the solar field from less than 10,000
$/kW, an ε of 28%, O&M costs of 50 US$/kW/year (O&M with 12.2 × 12.2 m2 heliostats to 13,000–13,500 heliostats LCOE,
TES are significantly larger) a plant such as Genesis may permit mean ε and δ all improve;
an LCOE of 9.3 c US$/kWh working 30 years. By further refining By further increasing the size of the solar field with heliostats
this design and mass-producing the components, this cost can be above 13,500, mean ε and δ all improve, but LCOE increases.
dramatically reduced, possibly to get much closer to the 6 c US By increasing the number of heliostats from 13,500 to 18,500
$/kWh incorrectly attributed to the ST with TES technology of permits ε ~ 95% at an LCOE of less than 8 c/kWh for
Crescent Dunes. continuous electricity supply in NEOM city.
CSP PT works much better than CSP ST. With no TES, PT Also accepting 20% higher costs, the solution would be very
work even better than the modeled expectations. With TES, they competitive with solar PV and batteries, of expected life and
work slightly less than the modeled expectations. performance much worse in the Kingdom of Saudi Arabia than
Technology forecasting for CSP should also include PT, not elsewhere cause sand, dust, and high temperatures.
only ST. Apart from failures, regarding the modeling of CSP ST, there is
As an added remark, the present LCOE does not account for the issue of the real operation of components differing from the
the variability of the power of electricity generation vs. the design conditions. For example, heliostats lose tracking in time
registered capacity. subjected to atmospheric load, and other components suffer from
In a system of wholesale spot prices, failure to deliver below real-world operation performance differing from the operation
80% of the registered capacity has huge consequences. These assumed in the models. Especially in ST, the solar field collection
consequences are presently voided for wind and solar power is dramatically affected by the presence of clouds. Accurate
generation facilities, but cannot be avoided forever. With spot models validated under realistic cloud coverage are still missing,
prices, up to 14 AU$/kWh vs. averages of 10 c AU$/kWh, and even because real-world instantaneous data of electricity pro-
harsh penalties for failing to provide the promised outputs for duction and irradiance are missing. The effects of clouds make
other generations, is not reasonable to discuss LCOE of unpre- unreliable every prediction of CSP ST with molten-salt TES
dictable electricity. plants’ performances. Thermal transients are particularly chal-
Every facility producing unpredictable electricity needs a back- lenging in CSP ST with molten-salt TES.
up predictable facility, or dedicated energy storage to be accepted The further progress of CSP will depend on the successful
in the grid, where demand and supply are always balanced. While operation of the novel solar facilities such as Dubai One, featuring
every facility does not have to be balanced individually, sooner or CSP parabolic trough with TES, CSP solar tower with TES, and
later the cost of balancing the grid will have to be shared among PV in the different units. Only full transparency on the con-
the different facilities supplying intermittent electricity, and the struction and maintenance costs, as well as of electricity pro-
cost will have to be proportional to the value of the mean ε, as duction sampled with high frequency, plus the sharing of plant
well as to a parameter such as the δ expressing the variability. characteristics and high-frequency data of system and compo-
There have been expectations of unrealistic LCOE for specific nents operation, resource and other environmental variables for
CSP technology, ST with TES, to compete price-wise with wind modeling, may bring back confidence in the CSP technology.
and solar PV, without accounting for dispatchability. CSP is not
competitive with solar PV or wind without factoring in dis-
patchability. CSP is however a key component of renewable Conclusions
energy-only grid, where not controllable electricity from wind The work has reported the CSP plants that have been developed
and solar PV must be integrated with continuous or dispatchable or proposed, locally and overseas, highlighting the reasons for the
electricity from CSP, hydro, or enhanced geothermal systems poor uptake of this technology, especially in Australia. CSP is
(EGS) plus the affordable amount of batteries and pumped hydro more sophisticated, less widespread, and therefore more expen-
to have supply matching demand (Boretti, 2021a). sive and less reliable than wind and solar PV. During the early
The claim of a present cost of CSP ST with TES of US$ 0.061 growth phase of renewable energy, when the interest is to quickly
per kWh, further projected to reach US$ 0.05 per kWh by 2030, build up capacity, wind and solar PV have huge advantages vs.
are speculations not based on any real-world data that have CSP having a cost per unit installed power that is much less. The
worsened rather than improved the perspectives of CSP ST with attempt to compete price-wise with wind and solar PV is what
TES. It will take years to recover the sector from the bad repu- has produced substandard developments that have undermined
tation gathered from the Crescent Dunes and Aurora experiences. the reputation of CSP technology. It is in the current growth
The failure of Crescent Dunes is only the result of the attempt phase of renewable energy, where the aim is to make a grid
to compete price-wise with wind and solar PV without renewable energy only without any supply from combustion fuels,
accounting for dispatchability. Regarding the Gemasolar CSP ST that the energy storage issue is coming out, and CSP is gaining
8 HUMANITIES AND SOCIAL SCIENCES COMMUNICATIONS | (2021)8:326 | https://doi.org/10.1057/s41599-021-01005-3HUMANITIES AND SOCIAL SCIENCES COMMUNICATIONS | https://doi.org/10.1057/s41599-021-01005-3 ARTICLE
new interest. Opposite to wind and solar PV power plants that Boretti A (2018b) Cost and production of solar thermal and solar photovoltaics
may deliver power to the grid only phased with the con- power plants in the United States. Renew Energy Focus 26:93–99
temporary, instantaneous, availability of the wind and solar Boretti A, Castelletto S, Al-Zubaidy S (2018) Concentrating solar power tower
technology: present status and outlook. Nonlinear Engineering 8(2). https://
resource, and thus necessitates of huge energy storage, which is doi.org/10.1515/nleng-2017-0171
economically very expensive, CSP plants have the advantage of Boretti A (2019a) Realistic expectation of electricity production from current
dispatchability, i.e., production of electricity on demand, thanks design concentrated solar power solar tower with thermal energy storage.
to the much cheaper internal thermal energy storage. Further Energy Storage https://doi.org/10.1002/est2.57
developed for higher temperatures, (Boretti and Castelletto, Boretti A (2019b) Energy storage requirements to address wind energy variability.
Energy Storage 1(5):e77. https://doi.org/10.1002/est2.77
2021b), CSP may have better efficiencies of the thermal cycle and Boretti A (2019c) Energy storage needs for an Australian National Electricity Market
reduced LCOE. While a CSP plant cannot have a levelised cost of grid without combustion fuels. Energy Storage. https://doi.org/10.1002/est2.92
generic electricity lower than a PV solar plant, it may have a Boretti A, Castelletto S (2020) Cost of wind energy generation should include
much lower cost of similarly dispatchable electricity from a PV energy storage allowance. Sci Rep 10(1):1–13
solar plant plus BES. Aiming at a renewable energy-only grid, Boretti A, Castelletto S (2021a) Concentrated Solar Power Solar Tower with
Oversized Solar Field and Molten Salt Thermal Energy Storage working at an
CSP is therefore expected to grow even more than solar PV and annual average capacity factor of 95% in NEOM City. Energy Technol 9(4).
wind, in a grid managed by artificial intelligence (Boretti, 2021a) https://doi.org/10.1002/ente.202001097
that is however built on the supply of power of different char- Boretti A, Castelletto S (2021b) High-temperature molten-salt thermal energy storage
acteristics from wind, solar PV, and CSP, stabilized by BES and and advanced-Ultra-supercritical power cycles. J Energy Storage 42:103143
PHES, and production of green hydrogen - the hydrogen econ- Boretti A (2021a) Integration of solar thermal and photovoltaic, wind, and battery
energy storage through AI in NEOM city. Energy AI 3:100038
omy is complementary and synergetic to the electric economy Boretti A (2021b) The hydrogen economy is complementary and synergetic to the
(Boretti, 2021b)—with further quality contributors hydroelectric, electric economy. Int J Hydrog Energy 46(78):38959–38963
biomass and possibly enhanced geothermal energy (Boretti, Boretti A (2021c) Dispatchable renewable energy from CSP and CSP+EGS in the
2021c) and nuclear. While renewable hydrogen production is Kingdom of Saudi Arabia, 11th International Conference on Renewable and
expected to progress in the current phase as green hydrogen, from Clean Energy 26–28 February. Shiga, Japan. IOP Conf. Ser.: Earth Environ.
Sci. 813:012003. https://doi.org/10.1088/1755-1315/813/1/012003
excess wind and solar photovoltaic electricity and electrolysis, it Boretti A (2021d) A perspective on the production of hydrogen from solar-driven
must be mentioned that higher temperature concentrated solar thermal decomposition of methane. Int J Hydrog Energy 46(69):34509–34514
energy and thermal energy storage may be used to run a ther- Boretti A (2021e) White is the color of hydrogen from concentrated solar energy and
mochemical hydrogen production plant rather than a high- thermochemical water splitting cycles. Int J Hydrog Energy 46(39):20790–20791
temperature power cycle with clear synergies between electricity Clifton J, Boruff BJ (2010) Assessing the potential for concentrated solar power
development in rural Australia. Energy Policy 38(9):5272–5280
production and production of hydrogen (Boretti, 2021d, e). CSP Dawson L, Schlyter P (2012) Less is more: Strategic scale site suitability for con-
ST with TES is the most promising renewable energy technology centrated solar thermal power in Western Australia. Energy Policy 47:91–101
permitting dispatchability. It must be competitive when dis- Deign J (2020) America’s concentrated solar power companies have all but dis-
patchability is factored in, not without. Until the pricing will appeared. www.greentechmedia.com/articles/read/americas-concentrated-
include dispatchability, it will suffer from the competition of the solar-power-companies-have-all-but-disappeared
Energy Information Administration (US DOE) (2019) ELECTRICITY DATA
much cheaper wind and solar PV, which, however, are not dis- BROWSER. www.eia.gov/beta/electricity/data/browser/
patchable without the unaffordable batteries. Fully dispatchable Feldman D, Margolis R (2018) Q1/Q2 2018 Solar Industry Update. National
solar electricity from CSP ST with TES is achievable in Australia Renewable Energy Laboratory, Golden,CO, www.nrel.gov/docs/fy18osti/
for 8–10 c/kWh, well below every alternative. 72036.pdf NREL/PR-6A20-72036
Ghadi MJ, Li L, Zhan J, Chen L, Huang Q, Li C (2019) A Review on the devel-
opment of concentrated solar power and its Integration in coal-fired power
Data availability plants. In 2019 IEEE Innovative Smart Grid Technologies-Asia (ISGT Asia).
No new data were generated in this work. The data used across IEEE. pp. 1106–1111
the work are available at the listed references. Herrmann U, Kelly B, Price H (2004) Two-tank molten salt storage for parabolic
trough solar power plants. Energy 29(5–6):883–893
International Renewable Energy Agency (2012) Concentrating Solar Power.
Received: 19 January 2021; Accepted: 28 November 2021; www.irena.org/documentdownloads/publications/
re_technologies_cost_analysis-csp.pdf
Kuravi S, Trahan J, Goswami DY, Rahman MM, Stefanakos EK (2013) Thermal
energy storage technologies and systems for concentrating solar power plants.
Prog Energy Combust Sci 39(4):285–319
References Lilliestam J, Labordena M, Patt A, Pfenninger S (2017) Empirically observed
ABC News (2017) Solar thermal power plant announced for Port Augusta ‘biggest learning rates for concentrating solar power and their responses to regime
of its kind in the world’. http://mobile.abc.net.au/news/2017-08-14/solar- change. Nat Energy 2:17094
thermal-power-plant-announcement-for-port-augusta/8804628 Lilliestam J, Pitz-Paal R (2018) Concentrating solar power for less than USD 0.07
ABC News (2019) Port Augusta solar thermal power plant scrapped after failing to per kWh: finally the breakthrough? Renew Energy Focus 26:17–21
secure finance. www.google.com/amp/amp.abc.net.au/article/10973948 Law EW, Prasad AA, Kay M, Taylor RA (2014) Direct normal irradiance fore-
Aneroid Energy (2019) Energy data from the Australian Energy Market Operator. casting and its application to concentrated solar thermal output
http://anero.id/energy/ forecasting–A review. Solar Energy 108:287–307
Australian Government Department of the Environment and Energy (2019) Law EW, Kay M, Taylor RA (2016) Calculating the financial value of a con-
Australian Energy Statistics, Table Of Electricity generation by fuel type centrated solar thermal plant operated using direct normal irradiance fore-
2017–18 and 2018. www.energy.gov.au/publications/australian-energy- casts. Solar Energy 125:267–281
statistics-table-o-electricity-generation-fuel-type-2017-18-and-2018 Middelhoff E, Madden B, Ximenes F, Carney C, Florin N (2022) Assessing elec-
Baig M, Surovtseva D, Halawa E (2015) The potential of concentrated solar power tricity generation potential and identifying possible locations for siting hybrid
for remote mine sites in the Northern Territory, Australia. J Sol Energy concentrated solar biomass (HCSB) plants in New South Wales (NSW),
2015:617356. Australia. Appl Energy 305:117942
Boerema N, Morrison G, Taylor R, Rosengarten G (2013) High temperature solar Müller-Steinhagen H, Trieb F (2004) Concentrating solar power. A review of the
thermal central-receiver billboard design. Sol Energy 97:356–368 technology. Ingenia Inform QR Acad Eng 18:43–50
Boretti A (2018a) Concentrated solar power plants capacity factors: a review, Murphy C, Sun Y, Cole W, Maclaurin G, Turchi C, Mehos M (2019) The potential
nonlinear approaches, in engineering applications energy: vibrations, and role of concentrating solar power within the context of DOE’s 2030 Solar
modern applications, Liming Dai, Eds., Reza N. Jazar. Springer, New York, Cost Target. National Renewable Energy Laboratory. NREL/TP-6A20-71912,
NY Golden, CO, http://www.nrel.gov/docs/fy19osti/71912.pdf
HUMANITIES AND SOCIAL SCIENCES COMMUNICATIONS | (2021)8:326 | https://doi.org/10.1057/s41599-021-01005-3 9ARTICLE HUMANITIES AND SOCIAL SCIENCES COMMUNICATIONS | https://doi.org/10.1057/s41599-021-01005-3
Narimani A, Abeygunawardana A, Ledwich GF, Nourbakhsh G (2016) Value of Competing interests
concentrated solar power with thermal energy storage in the national elec- The authors declare no competing interests.
tricity market of Australia. In 2016 Australasian Universities Power Engi-
neering Conference (AUPEC) (pp. 1–5). IEEE
National Renewable Energy Laboratory (2018) Concentrating Solar Power Annual
Ethical approval
Ethical approval statement not needed as the research did not involve human partici-
Technology Baseline 2018. http://atb.nrel.gov/electricity/2018/index.html?t=sc
pants. The research was performed following relevant guidelines/regulations not
National Renewable Energy Laboratory (2019) Concentrating Solar Power Annual
requiring ethical approval.
Technology Baseline 2019. http://atb.nrel.gov/electricity/2019/index.html?t=sc
National Renewable Energy Laboratory (2020) System advisor model (SAM).
http://sam.nrel.gov/ Informed consent
Parkinson G (2013) Graph of the Day: Australian retail electricity prices in 2020. Informed consent not needed as the research did not involve human participants. This
http://reneweconomy.com.au/graph-of-the-day-australian-retail-electricity- article does not report of any studies with human participants performed by any of the
prices-in-2020-2020/ authors.
Peterseim JH, Herr A, Miller S, White S, O’Connell DA (2014) Concentrating solar
power/alternative fuel hybrid plants: Annual electricity potential and ideal
areas in Australia. Energy 68:698–711 Additional information
Pitz-Paal R (2017) Concentrating solar power: still small but learning fast. Nat Supplementary information The online version contains supplementary material
Energy 2:17095 available at https://doi.org/10.1057/s41599-021-01005-3.
Rehman S, Al-Hadhrami LM, Alam MM (2015) Pumped hydro energy storage
system: a technological review. Renew Sustain Energy Rev 44:586–598 Correspondence and requests for materials should be addressed to Alberto Boretti.
reneweconomy.com.au (2018) World’s biggest solar tower with storage starts
commissioning. reneweconomy.com.au/worlds-biggest-solar-tower-with- Reprints and permission information is available at http://www.nature.com/reprints
storage-starts-commissioning-77818/
Publisher’s note Springer Nature remains neutral with regard to jurisdictional claims in
Sills B, Daya A (2010) Dust blocking sun rays at solar plant in abu dhabi, masdar
published maps and institutional affiliations.
official says. www.bloomberg.com/news/articles/2010-10-27/dust-blocking-
sun-s-rays-at-solar-plant-in-uae-masdar-official-says
smh.com.au (2018) South Australia planning to build the world’s largest thermal
solar plant. www.google.com/amp/s/amp.smh.com.au/business/companies/ Open Access This article is licensed under a Creative Commons
south-australia-aim-for-another-renewable-world-first-20180110- Attribution 4.0 International License, which permits use, sharing,
p4yyd7.html adaptation, distribution and reproduction in any medium or format, as long as you give
Yang Z, Garimella SV (2010) Thermal analysis of solar thermal energy storage in a appropriate credit to the original author(s) and the source, provide a link to the Creative
molten-salt thermocline. Solar Energy 84(6):974–985 Commons license, and indicate if changes were made. The images or other third party
material in this article are included in the article’s Creative Commons license, unless
indicated otherwise in a credit line to the material. If material is not included in the
Acknowledgements article’s Creative Commons license and your intended use is not permitted by statutory
The authors want to thank Andrew Miskelly for permission to reuse the images of his regulation or exceeds the permitted use, you will need to obtain permission directly from
website in the manuscript. the copyright holder. To view a copy of this license, visit http://creativecommons.org/
licenses/by/4.0/.
Author contributions
AB defined the method. AB and SC both downloaded and analyzed data, and discussed
© The Author(s) 2021
the results. AB wrote the first draft of the manuscript. Both authors participated in the
further revisions of the manuscript.
10 HUMANITIES AND SOCIAL SCIENCES COMMUNICATIONS | (2021)8:326 | https://doi.org/10.1057/s41599-021-01005-3You can also read