Technical Assistance Consultant's Report
←
→
Page content transcription
If your browser does not render page correctly, please read the page content below
Technical Assistance Consultant’s Report

Project Number: 50184-001
February 2020

Democratic Socialist Republic of Sri Lanka: National
Port Master Plan
(Financed by the Japan Fund for Poverty Reduction)
The Colombo Port Development Plan – Volume 2 (Part 2)

Prepared by
Maritime & Transport Business Solutions B.V. (MTBS)
Rotterdam, The Netherlands

For Sri Lanka Ports Authority

This consultant’s report does not necessarily reflect the views of ADB or the Government concerned, and
ADB and the Government cannot be held liable for its contents. (For project preparatory technical
assistance: All the views expressed herein may not be incorporated into the proposed project’s design.
Category          Issue                                                                          Severity
               Equipment         Technical and financial assessment on the feeder cranes at JCT I-II            Medium
               Equipment         Scrap/amortisation of old tractors and trailers                                Medium
               Equipment         Over a period of time, the RTG equipment fleet need to be upgraded when        Medium
                                  additional investment for new RTGs and/or replacement of RTGs is required
               Operations        Truck flow direction should be changed back into a one-directional flow          High
               Logistics         Expansion of the gate complex for import/export containers                       High
               Systems           Upgrade of the Terminal Operating System (TOS) to N4 version                     High

                     South Asia Gateway Terminal
               South Asia Gateway Terminal (SAGT) is a Joint Venture between John Keells Holdings Plc, A.P. Møller-
               Mærsk Group, Evergreen International SA, Peony Investments SA, and the SLPA (15%). SAGT operates
               the terminal under a 30-year BOT arrangement that was signed in 1999. The table below provides an
               overview of the facilities at the terminal, as well as historic throughput figures.

               The following key observations can be made regarding SAGT’s facilities and throughput:
               • Container volumes have increased from 0.9 M TEU in 2005 to 1.6 M TEU in 2016; however, container
                  throughput volumes have declined since 2010, when throughput amounted to 2.0 M TEU.
               • SAGT has a water depth of CD -15.0m.
               • SAGT has a terminal depth of approximately 220m.
               • Average crane productivity at SAGT is 29 moves per crane per hour.
               • SAGT has several ongoing project to further increase efficiency, such as implementing expert decking and
                  a new TOS module.

                 Category    Item                                                                      Value        Unit
                             Reach Stackers                                                                2             #
                             Straddle Carriers                                                              -            #
                             RTGs / RMGs                                                                   31            #

confidential   Colombo Port Development Plan | March 2019                                                         Page 70
Gantry Cranes                                                         12              #
                             Mobile Harbour Cranes                                                   -             #

                             Berth Length                                                         940             m
                             Water Depth                                                          15.0            m

                             Terminal Area                                                     200,000            m2
                             Yard Area                                                         120,000            m2
                             Terminal Capacity                                               1,950,000          TEU
                             Reefer Plugs                                                         540              #
               Item              Unit    2005    2006       2007   2008 2009   2010 2011 2012 2013 2014 2015 2016
               Throughput      x1,000     932 1,335 1,547 1,726 1,750 1,970 1,963 1,870 1,747 1,662 1,371 1,632
                                  TEU

               Operations
               The following observations can be made from operation point of view:

               SAGT operates 12 ship to shore gantry cranes. Out of the total fleet of 12 cranes, 3 gantry cranes are
               Post Panamax type with an outreach of 19 container rows across and 9 cranes are of the Super Post
               Panamax type with an outreach of 21 rows across.

               The terminal operations concept is based on the classic Rubber Tyred Gantry (RTG) system for yard
               handling. The operations are driven by the NAVIS N4 Terminal Operating System (TOS), which is today’s
               Global standard. About 60% of the container terminals world-wide are using this TOS system.

               The terminal seems to be well managed. Current productivity is 29 moves per crane per hour; the
               target is set at 33 moves per hour. This is a competitive terminal operating performance. SAGT has
               projects ongoing to improve the terminal efficiency among others to apply Expert Decking, a new TOS
               module, to increase the efficiency of the yard. SAGT management is very focused on improving its
               service levels and as such to strengthen its competitive position in the Port of Colombo and in the
               region.

confidential   Colombo Port Development Plan | March 2019                                                     Page 71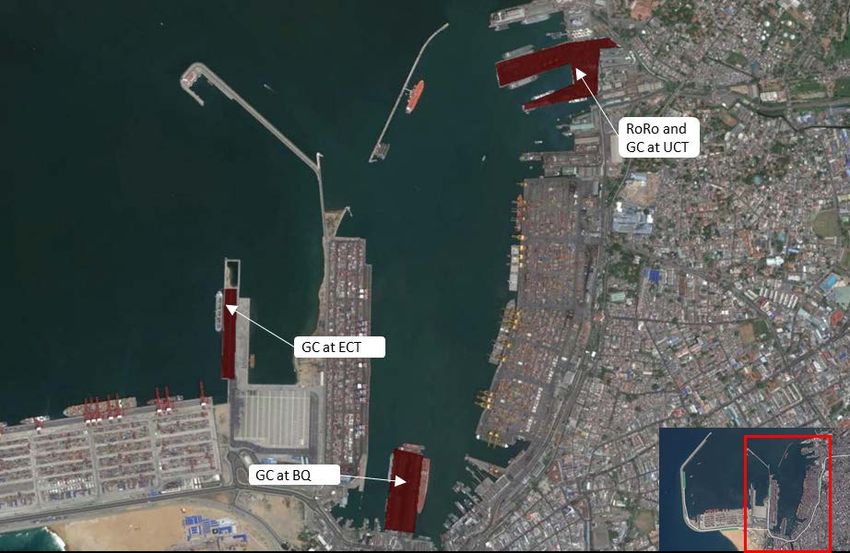
Figure 3-3 SAGT Terminal

               The facility is blocked to future grow due to limited water depth – only 15 meters – and a very small
               footprint. While the SAGT terminal has a total quay length of 940 metres, the width of the terminal is
               only 220 m, which is extremely narrow for a modern container terminal. The very large container
               vessels, which have draughts exceeding 14.0m, can’t berth at the SAGT terminal, so SAGT has to aim
               for another market segment than CICT and the future ECT and WCT terminal(s). Specifically, the SAGT
               is well suited to accommodate vessels

                     Colombo International Container Terminal
               Colombo International Container Terminal (CICT) is a Joint Venture between China Merchant Port
               Holdings Ltd (85%) and the SLPA (15%). The CICT terminal is operated under a 35-year BOT agreement,
               which was signed in 2011. The table below provides an overview of the facilities at the terminal, as
               well as historic throughput figures.

               The following key observations can be made regarding CICT’s facilities and throughput:
               • Container volumes have increased from 0.7 M TEU in 2014 to 2.0 M TEU in 2016.
               • CICT has a water depth of CD -18.0m.
               • CICT has a terminal depth of 435m.
               • Average crane productivity at CICT is 33 moves per crane per hour.

confidential   Colombo Port Development Plan | March 2019                                                     Page 72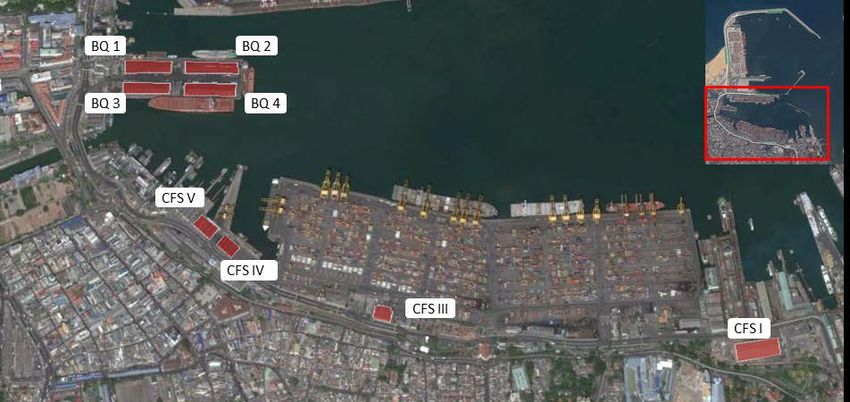
Category     Item                                                                               Value                Unit
                              Reach Stackers                                                                          6                  #
                              Straddle Carriers                                                                       -                  #
                              RTGs / RMGs                                                                            40                  #
                              Gantry Cranes                                                                          12                  #
                              Mobile Harbour Cranes                                                                   -                  #

                              Berth Length                                                                       1,200                  m
                              Water Depth                                                                          18.0                 m

                              Terminal Area                                                                    580,000                  m2
                              Yard Area                                                                        400,000                  m2
                              Terminal Capacity                                                              2,800,000*               TEU
                              Reefer Plugs                                                                       1,150                   #
               Item                  Unit 2005     2006     2007    2008 2009 2010 2011 2012 2013 2014 2015 2016
               Throughput        x1,000        -       -        -       -       -        -       -       -      58    687 1,562
                                                                                                                                    2,003
                                    TEU
               *The original design capacity of CICT was set at 2.4 M TEU per annum; however, during interviews and site visits it was noted
               that current capacity is estimated at 2.8 M TEU per annum.

               Operations
               The following observations can be made from operation point of view:
               The CICT terminal is a modern container terminal equipped with 12 ship to shore gantry cranes (Super
               Post Panamax type) with an outreach of 23 container rows across. At the CICT quay, a water depth of
               18 meter is available. The terminal is fully equipped to accept the newest 21,000 TEU vessels. The
               current crane productivity is 33 moves per crane per hour which is a very competitive handling speed.
               CICT is the only terminal in Colombo port handling the very large container vessels.

confidential   Colombo Port Development Plan | March 2019                                                                           Page 73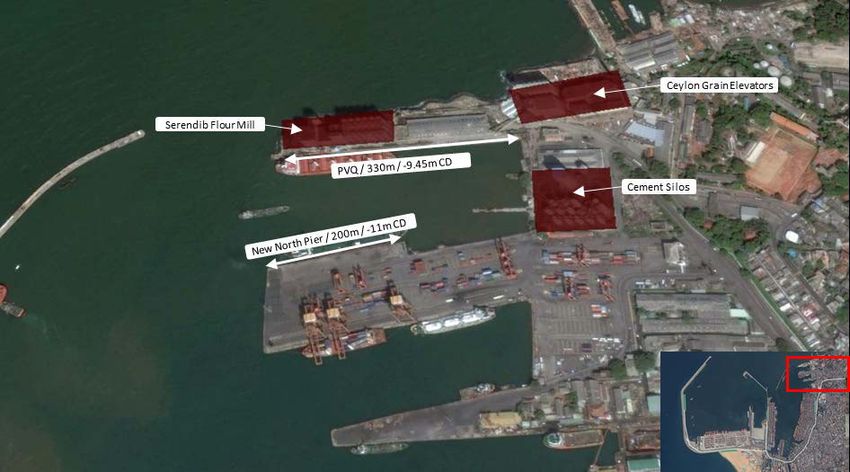
Similar to JCT and SAGT, the stacking of the containers at the terminal yard is managed with Rubber
               Tyred Gantries (RTGs). A total fleet of 40 RTGs is available for the terminal operations, capable of
               stacking the containers in the yard blocks six layers high and 6 rows wide which allows for a very high
               yard density.

               In November 2017, CICT has completed a project to convert the complete fleet of diesel-driven Rubber
               Tyred Gantry cranes (RTGs) to electric-powered rubber-tyred gantry cranes or E-RTGs, making a major
               contribution to efforts by the Port of Colombo to create a sustainable and environmentally friendly
               port.

               The terminal processes are steered by the corporate standard terminal system CTOS, which is a
               Chinese terminal operating system. CICT is working continuously on improving its service levels. The
               next step is automating the truck gates by applying Optical Character Recognition (OCR) technology.

               On the 3rd of July 2017, CICT won the award ‘Best Container Terminal Asia’ in the under four million
               TEUs category at the 2017 Asian Freight, Logistics and Supply Chain (AFLAS) Awards in Singapore.

confidential   Colombo Port Development Plan | March 2019                                                      Page 74
3.3    Current situation and historic demand development
               Historic Volumes
               The container trade comprises the largest cargo segment in the port of Colombo in terms of volumes,
               accounting for approximately 90% of tonnage handled in 2016. The graph below presents the evolution
               of containerized cargo volumes over time, split between gateway, transhipment and re-stowage
               containers. It can be observed that container throughput increased from 1.0 M TEU in 1995 to 5.7 M
               TEU in 2016 (CAGR: 8.43%). Transhipment volumes account for the majority of container throughput
               in the port, with a share of 75.9% in 2016. This share has increased gradually, from 66.8% in 1995.

               Figure 3-4 Container Throughput - Total Volumes

               Subsequently, the figure below presents a more detailed view of the gateway containers, split between
               laden imports, empty imports, laden exports, and empty exports. It can be observed that nearly all
               imports are laden, whereas more than 50% of export containers were empty in 2016. Moreover, the
               share of laden export containers has decreased from 72.6% in 1995 to 41.8% in 2016; this indicates a
               growing trade imbalance.

               Figure 3-5 Container Throughput - Gateway Volumes

confidential   Colombo Port Development Plan | March 2019                                                    Page 75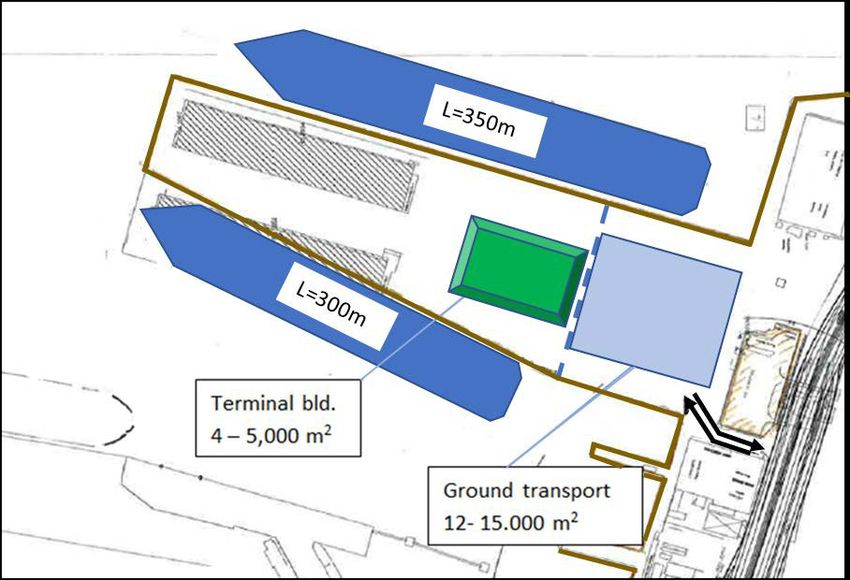
3.4       Container Vessel Size Development

               The shipping companies are continuously ordering more of the largest vessels, Ultra Large Container
               Vessels/Mega vessels, which are deployed on the main East West trades. This results in a cascading
               effect to smaller direct trades, which also receive larger vessels. The table below presents the various
               classes of container vessels, and assesses the ability of Colombo’s south port and old basin to
               accommodate these classes.

               Table 3.2 Container Vessel Types
                   Container                TEU       LOA       Beam Draught

                                                                                  CICT

                                                                                          SAGT

                                                                                                                                        UCT
                                                                                                       JCT-IV

                                                                                                                 JCT-III

                                                                                                                           JCT-I / II
                    vessels             capacity       (m)        (m)    (m)

                   Small Feeder
For the forecast, it is expected that South port will continue to receive the ULCS vessels and that future
               terminals will have a length of 1,400m instead of 1,200m. For the old basin it applies that the basin will
               be optimized to also be able to handle 10-13,000 TEU, 300m- 340m more dominantly. Further the
               basin will focus on larger feeder vessels (from 1,000 – 2,000 TEU today to 3,000 – 4,000 TEU tomorrow).
               The future vessel size may go beyond the 400m but as width would become a more difficult constraint
               it is expected that the future largest vessel size dominantly stay at length between 400m and 450m.

confidential   Colombo Port Development Plan | March 2019                                                         Page 77
3.5    Forecast
               Base Case
               The figure below presents the Base Case container demand forecast for the port of Colombo, split
               between gateway and transhipment containers. In the Base Case, it is assumed that Hambantota does
               not develop any transhipment capabilities and handling is limited to gateway cargo in that port. In
               total, Sri Lankan transhipment container throughput is estimated to reach 12.7 M TEU by 2050; total
               Sri Lankan gateway container demand is estimated to reach 3.2 M TEU by 2050. The drops in the period
               2020 and 2024 are related to assumed growth in direct trades and increased competition from other
               transhipment hubs.

               Figure 3-6 Containers - Base Case Forecast

               Subsequently, Table 3-3 provides an overview of the Base Case forecast Colombo which is the Base
               Case gateway forecast and the Base Case transhipment forecast. In the Base Case, it is assumed that
               transhipment will not be brought to Hambantota. In this scenario, the port will merely focus on
               industrial developments and shall not become a main competitor for transhipment in Colombo.
               Obviously, Hambantota will handle containerized cargoes but this will merely consist of gateway
               (import/exports) cargoes. Colombo faces competition from regional transhipment hubs. Assumptions
               of the transhipment forecast are outlined in Appendix II.

confidential   Colombo Port Development Plan | March 2019                                                   Page 78
Table 3-4: Forecast Colombo Base Case
2016 2020 2025 2030 2050
Gateway
National Demand ‘000 TEU 1,300 1,660 2,197 2,630 3,737
Colombo Share % 100.0% 99.0% 98.0% 95.0% 88.0%
Colombo Demand ‘000 TEU 1,300 1,643 2,153 2,498 3,289
Transhipment
National Demand ‘000 TEU 4,355 5,775 5,873 6,433 12,671
Colombo Share % 100.0% 100.0% 100.0% 100.0% 100.0%
Colombo Demand ‘000 TEU 4,355 5,775 5,873 6,433 12,671
Total
Colombo Demand ‘000 TEU 5,655 7,418 8,026 8,931 15,960
High Case
The High Case assumes that Colombo remains the dominant regional transhipment hub, combined
with a slower development of direct trades. Under the High Case, gateway container volumes in the
Port of Colombo follow the high economic growth scenario.
Figure 3-7 Containers – High Case Colombo Forecast
The table below details the forecasts. The gateway forecast follows the high growth economic
scenario, the transhipment forecast for Port of Colombo in the High Case reaches approximately 21.0
M TEU in 2050.
confidential Colombo Port Development Plan | March 2019 Page 79Table 3-5 Containers - High Case Colombo Forecast
2016 2020 2025 2030 2050
Gateway
National Demand ‘000 1,300 1,660 2,252 2,855 4,549
TEU
Colombo Share % 100.0% 99.0% 98.0% 95.0% 88.0%
Colombo Demand ‘000 1,300 1,643 2,207 2,713 4,003
TEU
Transhipment
National Demand ‘000 4,355 6,304 7,311 8,473 20,996
TEU
Colombo Share % 100.0% 100.0% 100.0% 100.0% 100.0%
Colombo Demand ‘000 4,355 6,304 7,311 8,473 20,996
TEU
Total
Colombo Demand ‘000 5,655 7,947 9,518 11,186 24,998
TEU
Potential Hambantota Transhipment Development.
To account for possible development of transhipment in Hambantota, an allocation scenario is
presented below. The 40% allocation of transhipment to Hambantota under this scenario is based on
the effect of the Alliances. There are three main Alliances on the main east west trades.
• 2M consisting of Maersk Line, MSC and Hyundai
• Ocean Alliance consisting of COSCO, CMA CGM (incl. APL), Evergreen and OOCL
• The Alliance consisting of United Arab Shipping, Yang Ming, Hapag-Lloyd, MOL, “K”- Line and NYK
Today, these alliances have shares of respectively 40%, 35%, and 25% on the main East West Trades.
Within The Alliance, the Japanese carriers are trying to combine their shipping lines into “ONE”. Under
the Base Case scenario, it is expected that Ocean Alliance will grow in future, as they have a substantial
amount of additional mega vessels on order (similar to what Maersk and MSC have done rather
recently); The Alliance is estimated to experience less growth, due to a smaller current orderbook.
Furthermore, it is assumed that the Chinese interests in Hambantota will attract Ocean Alliance to call
at Hambantota in future.
Taking these developments into account, it is expected that Hambantota will experience (rapid) growth
in their transhipment business, resulting in a reduced market share for Colombo, where MSC and
Maersk Line remain the largest carriers. Over time, Hambantota’s transhipment share is expected to
grow to 40%, mainly consisting of services by Ocean Alliance members and other feeder services that
connect to these main lines.
confidential Colombo Port Development Plan | March 2019 Page 80Figure 3-8 Major Alliances – capacity shares
Additionally, it is expected that the vessels that call at Hambantota for transhipment cargo also
load/discharge some gateway cargo. Hence, Hambantota is assumed to capture a larger share of the
gateway container volumes under the Hambantota development scenario. Specifically, 67% of
gateway cargo is allocated to Colombo, 30% is allocated to Hambantota, and the remaining 3% of
gateway cargo in 2050 in this scenario flows to Trincomalee. The two tables below provide the
forecasts for the Base Case and High Case container forecasts, assuming development of Hambantota
is successful.
Table 3-6 Colombo Container Demand - Base Case Forecast with Hambantota Development
2016 2020 2025 2030 2050
Gateway
National Demand ‘000 1,300 1,660 2,197 2,630 3,737
TEU
Colombo Share % 100.0% 99.0% 94.2% 86.3% 67.0%
Colombo Demand ‘000 1,300 1,643 2,068 2,270 2,504
TEU
Transhipment
National Demand ‘000 4,355 5,775 5,873 6,433 12,671
TEU
Colombo Share % 100.0% 100.0% 100.0% 88.6% 60.0%
Colombo Demand ‘000 4,355 5,775 5,873 5,698 7,602
TEU
Total Colombo ‘000 5,655 7,418 7,941 7,968 10,106
Demand TEU
confidential Colombo Port Development Plan | March 2019 Page 81Table 3-7 Colombo Container Demand - High Case Forecast with Hambantota Development
2016 2020 2025 2030 2050
Gateway
National Demand ‘000 1,300 1,660 2,252 2,855 4,549
TEU
Colombo Share % 100.0% 99.0% 94.2% 86.3% 67.0%
Colombo Demand ‘000 1,300 1,643 2,121 2,464 3,048
TEU
Transhipment
National Demand ‘000 4,355 6,304 7,311 8,473 20,996
TEU
Colombo Share % 100.0% 100.0% 100.0% 88.6% 60.0%
Colombo Demand ‘000 4,355 6,304 7,311 7,505 12,597
TEU
Total Colombo ‘000 5,655 7,018 9,432 9,969 15,645
Demand TEU
The two tables show that major development of Hambantota in the transhipment segment would
harm the development plans of Colombo for the same market.
3.6 Capacity Development & Requirement
In this section, we will look at the outlook of the current infrastructure and facilities, to assess the
future capacity of all current facilities. Subsequently, we will compare the resulting capacity to
estimated demand, for each of the planning horizons.
Outlook for Current Capacity
From the physical and operational assessments, as summarized in section 3.2.1, the following is
concluded:
• The UCT facility is inadequate to efficiently handle containerized cargo, given water depth alongside the
berths and terminal dimensions. As such, it is proposed that container activities are removed from the
UCT area in the short term, once the East Container Terminal (ECT) becomes operational. Specifically, it is
foreseen that UCT will be phased out after 2019.
• The JCT facility is currently one of the most important container terminals in the port of Colombo, handling
41.2% of containerized cargo in 2015. However, water depth limitations prohibit accommodation of the
largest container vessels; this issue is not expected to be resolved as the quay wall structure hampers
dredging activities alongside the berth. As additional deep-water capacity comes on stream in the South
Harbour, it is expected that feeder services will increasingly call at the South Harbour terminals, in order
to avoid costs related to Inter Terminal Trucking (ITT). If no action is taken, it is expected that JCT’s market
share will deteriorate in the near future. This analysis will make a conservative estimate by using the worst-
case scenario that JCT will be phased out in about 15 years.
• The CICT terminal is modern, providing adequate water depth for the largest container vessels, best
practice terminal dimensions and layout, modern equipment, and benchmark operational service levels.
As such, it is expected that CICT will remain functional over the forecast period. Additionally, capacity is
confidential Colombo Port Development Plan | March 2019 Page 82expected to increase from the current 2.8 M TEU to 2.9 M TEU, as operational efficiency measures are
implemented.
• Similar to JCT, the SAGT terminal lacks adequate water depth to handle the largest container vessels.
Moreover, the terminal has limited yard depth, hampering efficient operations. Nevertheless, the terminal
boasts high service levels, due to modern equipment and IT systems. Additionally, the SAGT terminal can
be combined with the adjacent deep-water ECT in the future, resulting in more efficient terminal
dimensions and enabling the terminal to handle both main liners and feeder vessels. Hence, it is expected
that SAGT will remain functional over the forecast period. Additionally, capacity is expected to increase
from the current 2.0 M TEU to 2.1 M TEU, as operational efficiency measures are implemented. Clearly
additional upsides on efficiency gains could be reached through synergies between ECT and SAGT,
however these additional gains are not incorporated to the maximum for conservative reasons.
In line with the assumptions posited above, the table below presents the estimated capacity
development of each of the current container terminals, as well as the operational productivities
applied to calculate the future capacities.
Table 3-8 Containers - Capacity Development Assumptions
Item Unit 2016 2020 2025 2030 2050
UCT
UCT Berth TEU / m
508 - - - -
Productivity Quay
UCT Berth Length m 590 - - - -
UCT Capacity ‘000 TEU 300 - - - -
JCT
JCT Berth TEU / m
1,492 1,492 1,492 1,492 -
Productivity Quay
JCT Berth Length m 1,642 1,642 1,642 1,642 -
JCT Capacity ‘000 TEU 2,450 2,450 2,450 2,450 -
SAGT – Phase I
SAGT Berth TEU / m
2,074 2,108 2,108 2,126 2,200
Productivity Quay
SAGT Berth Length m 940 940 940 940 940
SAGT Capacity ‘000 TEU 1,950 1,981 1,981 1,999 2,068
CICT
CICT Berth TEU / m
2,333 2,400 2,400 2,400 2,400
Productivity Quay
CICT Berth Length m 1,200 1,200 1,200 1,200 1,200
CICT Capacity ‘000 TEU 2,800 2,880 2,880 2,880 2,880
Total Capacity ‘000 TEU 7,500 7,311 7,311 4,879 4,948
The figure below plots the resulting capacity development of the current facilities in the port of
Colombo over the forecast period. Over the long term, capacity of current facilities is estimated to
confidential Colombo Port Development Plan | March 2019 Page 83decline from 7.5 M TEU to 4.9 M TEU, as UCT and JCT are phased out in the conservative estimate. The
decline in capacity is slightly compensated by the increased efficiency of the SAGT and CICT terminals.
Figure 3-9 Containers - Capacity Development of Current Facilities
Development Requirement
Based on the demand forecast, presented in section 3.5, and the capacity development of current
facilities, discussed in section 3.6, the capacity gap for each of the planning horizons is derived. The
figure below plots the Base Case and High Case demand against the capacity in the port.
It can be observed that, under the Base Case scenario, the capacity gap reaches 1.2 M TEU by 2025;
subsequently, the capacity gap further increases to 11.0 M TEU by 2050. Under the High Case scenario
assumptions, the capacity gap will be more severe, with an estimated capacity gap of 20.0 M TEU by
2050.
The figure displays the expected container volumes under the Base Case and High Case, with the
current capacity in the Port of Colombo. The graphic shows that there is a large demand for additional
port development to fill the gap.
confidential Colombo Port Development Plan | March 2019 Page 84Figure 3-10 Containers - Supply vs Demand
Table 3-9 Containers – Capacity / Supply gap
2016 2020 2025 2030 2050
Base Case
Demand ‘000 TEU 5,655 7,418 8,026 8,931 15,960
Capacity ‘000 TEU 7,500 7,294 6,789 6,806 4,948
Capacity Gap ‘000 TEU 1,845 (124) (1,237) (2,125) (11,012)
High Case
Demand ‘000 TEU 5,655 7,947 9,518 11,186 24,998
Capacity ‘000 TEU 7,500 7,294 6,789 6,806 4,948
Capacity Gap ‘000 TEU 1,845 (653) (2,729) (4,380) (20,050)
The table below provides an overview of the required additional facilities to accommodate the forecast
demand, presented as the required additional quay length and storage yard area for each of the
planning horizons. For the calculation of the required quay length and storage yard area, the following
assumptions have been applied:
• Newly introduced facilities will have an average berth productivity of 2,400 TEU per m quay over the
forecast period.
confidential Colombo Port Development Plan | March 2019 Page 85Table 3-10 Containers - Required Infrastructure Development
2016 2020 2025 2030 2050
Base Case
Capacity Gap ‘000 TEU 1,845 (124) (1,237) (2,125) (11,012)
Quay TEU / m 2,400 2,400 2,400 2,400 2,400
Productivity* Quay
Additional Quay m - 52 515 885 4,588
High Case
Capacity Gap ‘000 TEU 1,845 (653) (2,722) (4,380) (20,050)
Quay TEU / m 2,400 2,400 2,400 2,400 2,400
Productivity* Quay
Additional Quay m - 272 1,134 1,825 8,354
*Productivities for new developments.
The following factors need to be considered when planning new container terminal facilities in the port
of Colombo:
• Water depth needs to exceed CD -17.5m, to enable accommodation of the largest container vessels.
• The terminal needs to have sufficient depth, to enable efficient operations.
• Terminals should be planned near each other if possible, to reduce costs related to Inter Terminal Trucking
and to enable centralized stripping and stuffing activities for Multi Country Consolidation (MCC) cargo.
• New terminals should be able to access the Port Access Elevated Highway (PAEH) or should otherwise
have adequate connectivity to the hinterland.
Development Options
In the SLPA Master Plan, the following development options have been proposed:
• South Harbour
• East Container Terminal (ECT) phase 1 – The ECT phase 1 development has already been completed
and can commence operations once an operator has been selected.
• ECT phase 2 – The ECT phase 2 development is foreseen for the short term (< 5 years) and will be
developed by the selected ECT investor.
• Integration of ECT and SAGT I – The SAGT I/ECT integration can be implemented at any time.
• SAGT Phase II – Extension of SAGT is only feasible once the North Port is developed, as it entails the
removal of the current northern breakwater, resulting in unsheltered operations if the North Port
breakwater is not developed. As such, the integration and extension project is a long term (30 years)
project.
• West Container Terminal (WCT) phase 1 – In the 2016 SLPA Master Plan, the WCT phase 1
development will be required by 2023, once the ECT fills up.
• WCT phase 2 - The WCT phase 2 development comprises the extension of the WCT, which is
envisioned for the long term (30 years). It is noted that such a development would require the removal
and reconstruction of the western South Harbour breakwater, making it a very costly development.
• North Port – Once the South Harbour is fully developed (with the exception of the SAGT/ECT integration,
which can only be implemented after the North Port development), the North Port development is
envisioned to accommodate growing demand. It should be noted that integration of ECT and SAGT, like
confidential Colombo Port Development Plan | March 2019 Page 86WCT 2 expansion, also requires a demolishment of the breakwater. These are typical costs one like to
possibly avoid in port development.
3.7 Recommendations & Short Term Priority Projects
The main recommendations related to the container business are to:
R1. East Container Terminal (ECT) ads valuable capacity which is needed at the port. The concession
should be granted as soon as possible to safeguard Colombo’s competitive position.
R2. JCT modernisation should be implemented to stretch the terminal’s lifespan and prevent equipment
malfunctions.
The following short-term priority projects, which will be further discussed in section 15, result from
the container activities assessment:
SP1. JCT Modernisation Plan – A modernisation plan must be developed for JCT, to enable the terminal
to continue performing container handling operations safely and reliably over the coming years,
after which the container activities are to be phased out from the JCT location.
confidential Colombo Port Development Plan | March 2019 Page 87Page left blank intentionally confidential Colombo Port Development Plan | March 2019 Page 88
4 Dry Bulk

               4.1    Introduction
               This chapter aims to define the development need for dry bulk business and the development options
               to cater for the required capacity. The chapter is structured as follows:
               • This chapter starts in section 4.2, with an overview of the current dry bulk facilities for fertiliser, cement,
                   and wheat / maize / corn.
               • Section 4.3 presents the current and historic demand development - Since 2007, a stable total volume
                   between 2.5 Mtpa and 2.7 Mtpa.
               • Section 4.4 provides an overview of the global and expected country-specific vessel trends for the dry bulk
                   trades.
               • Section 4.5 presents the dry bulk volume projection up to 2050 - A medium term increase towards 3.5
                   Mtpa is estimated, as a result of a temporary increase in cement demand for large-scale infrastructure
                   projects.
               • The capacity need is estimated in section 4.6 - A dedicated berth is required for cement, as well as for
                   wheat / maize / corn.
               • Section 4.7 concludes with the recommended short term priority projects – The construction of a
                   dedicated berth for grains and cement and the establishment of a PVQ Upgrade Plan are proposed as
                   short-term priority projects relating to Dry Bulk.

confidential   Colombo Port Development Plan | March 2019                                                               Page 89
4.2 Overview current dry bulk facilities
Facilities & Capacities
Dry bulk is mainly handled in the north-eastern corner of Colombo port where Tokyo cement has a
bagging facility for cement and grain operations are carried out. Figure 4-1 presents an overview of the
terminals and capacities available
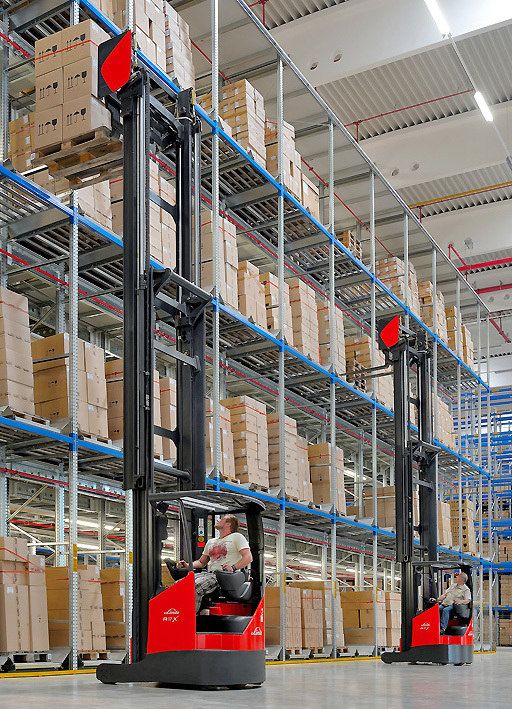
Figure 4-1: PVQ & North Pier
Commodity Operators Terminal Quay Side Estimated 2016 Free
handled Capacity Throughput Capacity
(‘000 (‘000 Tons) (‘000
Tons) Tons)
Wheat / Maize Ceylon Grain PVQ New North Pier 900 190 710
/ Corn Elevators (Prima &PVQ
Group) / Serendib
Flour Mill
Cement Tokyo Cement Cement Silos New North Pier 2,250 2,185 65
Group &PVQ
& INSEE Cement
Group
Fertilisers Various No dedicated New North Pier - 313 -
Terminal & BQ
confidential Colombo Port Development Plan | March 2019 Page 90Dry bulk operations in Colombo face several key issues; these issues are listed in the table below.
Table 4-1 Dry Bulk - Operational Bottlenecks
Category Issue Severity
PVQ Activities
Infrastructure Quay wall PVQ is deteriorated Low
Infrastructure CD -9.0m water depth is insufficient for large bulk carriers High
Infrastructure Ceylon Grain Elevators quay warehouse is deteriorated (abandoned) Medium
Equipment Grain operations carried out with 2 suction cranes with substandard performance Low
(240t/hr)
Equipment PVQ operations carried out with an inefficient belt system to a newly developed Low
warehouse (240 t/hr)
Berth Berth occupancy is too high, causing delays. Medium
Cement
Infrastructure CD -11.0m water depth is insufficient for large bulk carriers Low
Infrastructure 200m quay is insufficient for large bulk carriers Low
Equipment Discharge rate is substandard Low
Berth Berth occupancy is too high causing delays. Medium
Fertilisers
Equipment Mobile equipment lacks efficiency Low
confidential Colombo Port Development Plan | March 2019 Page 914.3 Current situation and historic demand development
Historic Volumes
Dry bulk handling in the port of Colombo takes the following forms:
• Bulk cement imports
• Bulk wheat, maize and corn imports
• Bulk and bagged fertiliser imports
Bulk cement imports account for the majority of the dry bulk volumes at the port of Colombo. The
cement is bagged at the Tokyo cement factory and distributed further inland. Wheat, maize and corn
imports show little change historically. Fertiliser imports are split in bulk and bagged imports. The bulk
imports are directly processed in mobile bagging facilities and distributed further.
Figure 4-2: Historic Throughput Dry Bulk
(‘000 Tons) 2007 2008 2009 2010 2011 2012 2013 2014 2015 2016
Bulk Cement Import 1,985 1,889 1,763 1,971 2,027 2,047 1,961 1,863 1,795 2,185
Bulk Wheat / Maize / Corn 26 129 96 127 147 147 178 146 157 190
Imports
Fertiliser Bagged Imports 372 202 175 275 239 119 44 165 292 118
Fertiliser Bulk Imports 136 342 172 269 235 334 291 355 307 196
Total 2,518 2,562 2,206 2,642 2,648 2,646 2,475 2,528 2,550 2,689
confidential Colombo Port Development Plan | March 2019 Page 924.4 Dry Bulk Vessel Size Developments
In the dry bulk market, vessel sizes are continuously increasing to achieve economies of scale. Today,
most of the grain trades are handled by panamax vessels; these panama vessels are changing due to
the new panamax canal dimensions. Port of Colombo cannot benefit from the size increase, due to
water depth constraints at PVQ, which has a water depth of 9.1m.
Table 4-2 Dry Bulk Vessel Classes
Dry bulk vessels DWT (tons) LOA (m) Beam (m) Draught (m) Able to call Future at
old basin? PVQ*
Handysize 10,000 - 40,000 140 - 180m 22 - 28m 8 - 10.5m YES YES
Handymax 40,000 - 65,000 169 - 200m 31 - 32.4m 9.8 - 12.3m Partly YES
(supramax)
Panamax (incl. 67,000 - 99,000 223 - 233m 32 - 48m 13.2 - 14.1m NO YES
new)
Capesize 100,000 - 250 - 300m 43 - 50m 14.2 - 18.5m NO NO
200,000
UltraLarge cape 250,000 - 300 - 360m 50 - 64m 18 - 24m NO NO
320,000 +
Source: Clarksons; MTBS
*Assuming that the PVQ quay wall is renewed and deepened.
It is noted that Sri Lanka should prepare to scale up existing facilities in the dry bulk trades, in order to
capitalize on the economies of scale achieved by using larger vessels. In order to support
competitiveness of the flour mill and the cement industry in Colombo, the PVQ basin needs to be
deepened to handle 13m drafted vessels.
This is still insufficient to handle the largest dry bulk vessels, but small (new) panamax vessels of around
80,000 DWT are considered sufficient to efficiently transport Sri Lanka’s grain volumes. Currently,
handymax vessels with capacities of approximately 40,000 DWT are predominantly deployed for this
trade.
In the cement trade, vessel sizes globally have not increased significantly; the most common vessel
types remain around 35,000 DWT to 45,000 DWT. Often, either larger vessels cannot be handled at
the loading and/or discharge port, or the facilities at either end are not suited for volumes that would
require larger vessels.
The expectation for the future grain trade is that the Port of Colombo will receive (new) panamax
vessels with lengths of up to 230m and draughts of up to 13m. For the longer term future, a berth that
enables accommodation of vessels with draughts of up to 14m can be realized in the envisaged north
port development.
The expectation for the future cement trade is that the Port of Colombo will receive cement vessels
with deeper draught (11m – 12m), but the size is not expected to increase a lot.
confidential Colombo Port Development Plan | March 2019 Page 934.5 Forecasts
The figure below presents the forecasts for the three dry bulk commodities. For the forecast, the
following key assumptions are made regarding expected developments:
• Fertiliser – The imports of fertilisers is expected to almost entirely diminish, as Sri Lanka is expected to
develop fertiliser production in the years to come. This would be cost effective compared to the volatile
imports. It is expected that some fertiliser imports will remain, but it is expected that these volumes will
increasingly be imported in containerised form, thereby reducing the need for bulk capacity.
• Cement – The cement imports are subject to several key developments:
• The Megapolis developments boost the imports in the period until 2025.
• Although national cement demand rises, the share of Colombo stays more or less the same due to
demand being serviced through Trincomalee and Hambantota.
• After 2040, the stagnant Sri Lankan population is expected to result in a reduction of cement demand.
• Wheat / Maize / Corn – The demand for these products is expected to rise slightly as the export business
picks up. However, an envisaged efficient Trincomalee-Colombo corridor would increase the ability of the
port of Trincomalee to service the Western province.
Figure 4-3: Colombo Forecast Dry Bulk
(‘000 Tons) 2016 2020 2025 2030 2050
Cement 2,179 2,866 2,871 2,560 2,334
Wheat / Maize / Corn 190 211 257 302 342
Fertiliser 314 160 - - -
Total 2,683 3,237 3,128 2,861 2,676
confidential Colombo Port Development Plan | March 2019 Page 944.6 Capacity Development & Requirement
Cement
For cement, the current terminals are working at maximum, with a bottleneck at the sea side
operations. In the period up to 2025, the imports will reach a peak volumes, resulting in the need for
a dedicated deep-water berth. No current SLPA plans exist regarding dry bulk operations in the
documents reviewed.
The table below presents the results of the capacity calculations, followed by the assumptions. The
capacity requirements per timeframe are:
2025 – In the immediate future, cement operations need a dedicated berth with a depth of 13.5m, to
accommodate a design vessel with a draft of 12.5m.
2030 & 2050 – Stabilisation of demand, no additional capacity needed.
Table 4-3: Capacity Requirement Cement
Item Unit 2016 2020 2025 2030 2050
Cement Forecast ‘000 Tons 2,179 2,866 2,871 2,560 2,334
Berth Requirements # 1 1 1 1 1
Quay Wall Requirement m 230 230 230 230 230
Terminal Area Requirement h 1.5 2.0 2.3 2.2 2.1
Assumptions Capacity Requirements
• Quay Wall:
• LOA 200 m - Draught 12.5 m of design vessel
• Discharge rate of 700 tons / hr
• Berth Occupancy 55%
• Terminal Area:
• Benchmark capacity 1.4 M Tons per ha (Jurong Cement Terminal)
Formulas used:
(1) ���ℎ ������� = ���ℎ���� ��� ∗ ���ℎ �������� ∗ ���������� ����� �� ����
�������
(2) ���ℎ ���������� (�ℎ��� �������) =
���ℎ �������
(3) ��� ��� ���������� = ����� �� ���ℎ� ∗ � � ����� ����� +
(( ����� �� ���ℎ� + 1) ∗ 15)
�������
(4) ������� ���� ���������� =
����������� ���ℎ���� �������
Example 2030:
(1) 700 * 0.55*7,200= 2,772,000 tons
(2) 2,560,000 / 2,772,000 = 1 (roundup)
(3) 1 * 200 + (2*15)=230m
(4) 2,560,000 / 1,415,094 = 2.2 ha
confidential Colombo Port Development Plan | March 2019 Page 95Wheat / Maize / Corn
The grain throughputs are forecasted to increase gradually, for which the terminal has ample capacity.
The future capacity requirements per time frame are:
2025 – In the immediate future operations need a dedicated berth with a depth of 14 m.
2030 & 2050 – Stabilisation of demand, no additional capacity needed.
Table 4-4: Capacity Requirement Wheat / Maize / Corn
Item Unit 2016 2020 2025 2030 2050
Cement Forecast ‘000 Tons 190 211 257 302 342
Berth Requirements # 1 1 1 1 1
Quay Wall Requirement m 280 280 280 280 280
Terminal Area Requirement ha 0.8 0.8 1.0 1.2 1.4
Assumptions Capacity Requirements
• Quay Wall:
• LOA 250 m
• Draught 13m
• Discharge rate of 700 tons / hr
• Berth Occupancy of 55%
• Terminal Area:
• Benchmark capacity - 250,000 Tons per ha (Current grain elevators)
Formulas used:
(1) ���ℎ ������� = ���ℎ���� ��� ∗ ���ℎ �������� ∗ ���������� ����� �� ����
�������
(2) ���ℎ ���������� (�ℎ��� �������) =
���ℎ �������
(3) ��� ��� ���������� = ���ℎ ���������� ∗ � � ����� ����� + (2 ∗ 15)
�������
(4) ������� ���� ���������� =
���ℎ���� ������� �������
Example 2030:
(1) 700 * 0.55*7,200= 2,772,000 tons
(2) 302,000 / 2,772,000 = 1 (roundup)
(3) 1 * 250 + (2*15)=280m
(4) 302,000 / 250,000 = 1.2 ha
4.7 Recommendations and Short Term Priority Projects
The main recommendation is to:
R3. Increase the depth in the PVQ basin to allow deeper draft grain and cement carriers, with a draft of
up to 13m.
This recommendation leads to the following short-term priority projects, which will be further
discussed in section 15.
confidential Colombo Port Development Plan | March 2019 Page 96SP2. Dedicated berth for grains and cement – The dedicated berth can solve immediate sea side
operations bottle necks and the accompanying depth issues.
SP3. PVQ Upgrade Plan – To handle bigger vessel dredging works might dredging if possible is needed.
confidential Colombo Port Development Plan | March 2019 Page 97Page left blank intentionally confidential Colombo Port Development Plan | March 2019 Page 98
5 Liquid Bulk

               5.1   Introduction
               This chapter aims to define the development need for the liquid bulk business and the development
               options to realise the required capacity. Commodities labelled as liquid bulk in this section are crude
               oil, refined oil (consisting of various many petroleum based products) and LNG as a future commodity.

               The chapter is structured as follows:
               •  This chapter starts in section 5.2 with an overview of the current liquid bulk facilities: Colombo port has 3
                  CBM’s for crude and LPG imports, a dolphin jetty for refined oils and loading arm.
               • Section 5.3 presents the current and historic demand development: Historic liquid bulk throughputs are
                  relatively constant at 4 M tons per annum.
               • Section 5.4 presents the vessel size development and its effects on the port of Colombo: Small and
                  medium tankers will keep dominating the supply to Colombo till additional facilities are developed.
               • Section 5.5 provides the liquid bulk volume projection up to 2050: The growth in liquid bulk is expected to
                  be driven by LNG imports.
               • The capacity need is estimated in section 5.6: LNG handling capacity and location of the import terminal
                  is combined with the operational state of the current dolphin jetty which are the main issues for liquid
                  bulk facilities.
               • Section 5.7 concludes with the recommended short term priority projects:

confidential   Colombo Port Development Plan | March 2019                                                              Page 99
5.2 Overview Current Liquid bulk facilities
Facilities & Capacities
The liquid bulk volumes at Colombo are handled at the following facilities:
• SBM1 – located offshore. Mainly used for import of crude oil, which is pumped into Sapugaskanda refinery
and the Orugodawatta tank farm.
• SBM2 – located offshore. Mainly used for import of refined oil, which is pumped into the Muthurajawela
tank farm or the Kollonnawa tank farm
• Dolphin jetty at mid-breakwater of the old port basin – Mainly used for import of refined products (Fuel
Oil, Diesel Petrol and lube oil). The lube oil is connected to the Kollonnawa tank farm, the Muthurajawela
tank farm, and the Bloemandhal Lanka Marine Service depot. Bunkering is also possible at the Dolphin
jetty.
• South jetty – located near UCT pier; the south jetty is used for bunkering of vessels.
• Shell LPG CBM – A mooring point to discharge LPG.
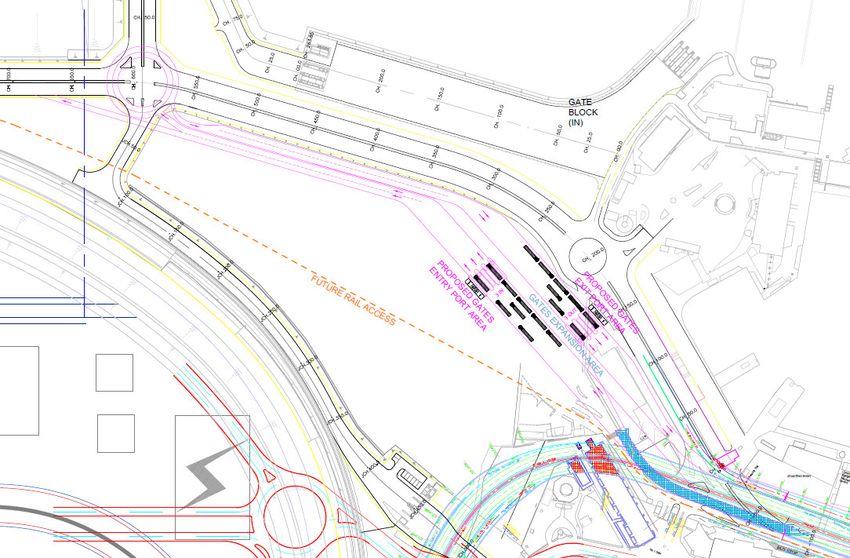
Figure 5-1: Oil Supply Chain Overview
Facility Capacity
Crude Oils
SBM 1 Jetty • Pump capacity: minimum 1,406 tons/hr
• 180,000 DWT
• LOA 298m, beam 43m
• Draughts 18.9m
Sapugaskanda Refinery • 2.5 M tons / annum distilling capacity
• 0.54 M tons’ crude storage capacity
Orugodawatta Tank Farm • 0.16 M tons’ storage capacity
Refined Oils
confidential Colombo Port Development Plan | March 2019 Page 100Dolphin Jetty • Pump capacity: minimum 278 tons/hr
• 40,000 DWT
• LOA 210m
• Draught 11.8
SBM 2 Jetty • Pump capacity: minimum 2500 tons/hr
• 60,000 DWT
• LOA 210m
• Draught 11.8m
Sapugaskanda Refinery • 60,000 tons’ storage capacity
Kollonnawa Tank Farm • 248,000 tons’ storage capacity
Muthurajawela Tank Farm • 205,000 storage capacity
Gas
Shell LPG CBM • LOA 165m
• Draught 7.0m
• Gas capacity 20,000m3
Source: Ceylon Petroleum Company
The following text box provides additional information on the refinery and the tank farms near
Colombo.
The refinery located in Sapugaskanda consists of 50,000 barrels/day processing plant and a 540,000-tonne crude oil
tank farm. The refinery gets crude oil either directly from the Single Point Buoy Mooring (SPBM) facility installed about
10 km offshore or from the four crude oil storage tanks of 40,000 tonnes (each), located in Orugodawatta. Part of the
refinery output is stored at Sapugaskanda storage facility for distribution and the balance is pumped to the
Kollonnawa storage facility. The Sapugaskanda tank farm (mini-distribution facility) receives products only from the
refinery. This has a total storage capacity of 60,000 tonnes in twelve tanks for diesel, kerosene and fuel oil.
Refined products from the refinery as well as imported products are received via pipelines to tanks at Kolonnawa. The
Kolonnawa installation has a total capacity of 250,000 tonnes in 40 tanks for finished products and product loading
facilities for loading railway bogies, which transport products to most of the bulk depots and to road tankers. Aviation
fuel to the Katunayake airport is supplied from the Kolonnawa terminal through rail and road tankers.
The Muthurajawela tank farm commenced operations in 2004. With the construction of this tank farm, Sri Lanka’s
storage capacity for finished petroleum products increased by 250,000 tonnes. Muthurajawela tank farm consists of
21 tanks of 10,000 m3 capacity and 8 tanks of 5,000 m3 capacity. These tanks store and distribute diesel and kerosene.
Along with the tanks, CPC installed a new SPBM system, where 60,000 DWT (deadweight tonnage) ships could use
the buoy for discharging imported finished products direct from sea to tanks via a submarine pipeline. This terminal
includes a loading facility to distribute products by road tankers. However, rail transportation of petroleum products
stored in the Muthurajawela tank farm is constrained due to the absence of a railway line.
Petroleum supply for retail sale is done at the following storage/distribution facilities
1. Muthurajawela
2. Kolonnawa
3. Sapugaskanda mini distribution facility
4. China Bay storage facility
5. 13 regional depots.
confidential Colombo Port Development Plan | March 2019 Page 101Lanka Marine Services (LMS) located at Bloemandhal in Colombo receives imported products directly as well as from
the Kolonnawa terminal via pipelines, and provides bunker fuel to ships via pipelines connected to Dolphin pier and
also from South jetty. LMS terminal has a storage capacity of 23,000 tonnes of fuel oil and 6,800 tonnes of diesel. The
dolphin jetty has unloading arms for (i) fuel oil; (ii) crude oil; (iii) diesel; (iv) petrol; and (v) lubricants.
Some amount of LPG is produced at the CPC refinery for local consumption. However, most of the country’s LPG
requirement is met through direct imports. LPG is imported through the Colombo Port, and also via a conventional
buoy mooring system (CBM) for Litro Gas Lanka Limited facilities at Muthurajawela.
Residual oil (heavy furnace oil) is transferred directly from the refinery to the CEB owned 160 MW Sapugaskanda
power plant and to the Asia Power owned 51 MW residual oil power plant to produce electricity for the national grid.
The LPG produced at the refinery is delivered to the private distributor by means of road tankers and then filled into
bottles for onward distribution to consumers.
Source: Sri Lanka Energy Balance 2015
Several issues have been identified concerning the liquid bulk operations in Colombo; these issues are
presented in the table below.
Table 5-1 Liquid Bulk - Operational Bottlenecks
Category Issue Severity
Infrastructure Maximum vessel LOA is insufficient to accommodate large liquid bulk vessels at Medium
Dolphin jetty
Infrastructure Pipelines to refinery are outdated Medium
Infrastructure A connection between Kollonnawa tank farm and Muthurajawela tank farm Medium
should be created in future
Infrastructure Sapugaskanda oil refinery outdated; needs to be revamped or demolished and High
newly built at more suitable location
Infrastructure A LNG handling capacity for the envisioned Kerawalapitya power plant should be High
planned for
Infrastructure In case dolphin jetty is removed due to north port development new refined Medium
product jetties should be catered for
confidential Colombo Port Development Plan | March 2019 Page 1025.3 Current situation and historic demand development
Historic Volumes
Sri Lanka is dependent on refined white oil imports for its national supply. These imports also include
gasoline. From Figure 5-2, it can be noted that there has not been a substantial change in crude oil
imports over the past decade; this is due to the fact that refining capacity has remained stable over
this period.
Figure 5-2: Historic Imports Crude & Refined Colombo
Tons ‘1000 2007 2008 2009 2010 2011 2012 2013 2014 2015 2016
Crude Imports 1,939 1,854 1,932 1,819 1,934 1,625 1,743 1,740 1,761 1,685
Refined Imports 2,064 2,025 1,945 2,224 2,431 3,111 2,253 2,483 2,330 2,778
Total 4,003 3,879 3,877 4,043 4,365 4,736 3,996 4,223 4,091 4,463
Source: SLPA
confidential Colombo Port Development Plan | March 2019 Page 1035.4 Liquid bulk Vessel Size Developments
The table below presents the main vessel types used for global refined oil trades; these vessels range
from 10,000 DWT for short range transport to 120,000 DWT for long range transport. Larger liquid bulk
vessels are typically only used for crude oil transport.
Table 5-2 Liquid Bulk Vessel Classes
Product tankers DWT (tons) LOA (m) Beam (m) Draught (m) Dolphin Future at
jetty north
port
Small tankers 10,000 - 45,000 135- 185m 22 - 28m 8 – 11.2m YES YES
Medium range (MR) 45,000 - 65,000 183 - 31 - 32.2m 12 – 13.5m YES YES
207m
Long Range (LR1) 65,000 - 80,000 200 - 32m 13.0 - 14.5m NO YES
228m
Long Range (LR2) (aframax) 80,000 - 120,000 228 - 34 - 45m 13.0 – NO YES
250m 14.5m
Source: Clarksons; MTBS
Refined fuels are currently handled at the Dolphin jetty. This jetty is able to handle vessels of up to
40,000 DWT, with draughts of up to 11.8m and lengths of about 210m. The expectation is that the
small and medium tankers will keep dominating the supply to Colombo till additional facilities are
developed.
Such facilities may be realized through development of a liquid bulk hub island or new liquid bulk
facilities in the envisaged north port. Once new facilities are provided, long range tankers (LR2) of up
to 120,000 DWT can call Colombo port, resulting in substantial economies of scale.
For the LNG trade, capacities of the globally deployed vessel classes range from 75,000 m3 (Medmax)
to 267,000 m3 (Qmax); the range of vessel classes is presented in the table below.
Table 5-3 LNG Vessel Classes
LNG type Vessel size
Medmax 75,000 m3
Conventional or standard 125,000 – 145,000 m3
New conventional or standard 150,000 – 175,000 m3
Qflex 210,000 - 216,0000 m3
Qmax 260,000 – 267,000 m3
It is expected that a new LNG terminal will be developed in the Port of Colombo, in order to supply the
envisaged gas fired power plant. Additionally, the LNG terminal can be used to supply vessels with LNG
as a fuel source in the future.
confidential Colombo Port Development Plan | March 2019 Page 104The new facility is expected to be a Floating Storage and Regassification Unit (FSRU), which should have
a capacity of approximately 175,000 m3. The envisaged design vessel has the following characteristics:
• DWT: 93,500
• GT: 113,000
• LOA: 300.0m
• Beam: 46.0m
• Draught: 12.5m
The design supply vessel is expected to be a conventional/standard class vessel, with a capacity of
around 145,000 m3.
5.5 Forecasts
The figure below presents the forecasts for the three liquid bulk commodities. The following
assumptions have been applied concerning expected developments:
• Crude Oil – The imports of crude oils are directly linked to the hinterland refining capacity. The current
refinery is inadequate to serve the market; additionally, the refinery is in poor state. It is expected that the
current refinery is revamped in the near future, and remains active at its current capacity. Additionally, it is
expected that a new 100,000 bbl/day capacity refinery is established in Hambantota in 2025.
• Refined Oil – Colombo has a roll to play in servicing the demand for refined oils; however, it is expected
that Colombo’s market share will decrease as refining capacity is established in Hambantota.
• LNG – LNG is expected to be an important commodity for meeting the nation’s energy demand. In 2019,
the first imports of LNG are expected to take place to serve the envisioned Kerawalapitya LNG power plant
(2 x 300 MW).
Figure 5-3: Colombo Forecast Liquid Bulk
(‘000 Tons) 2016 2020 2025 2030 2050
Crude Oil 1,685 2,512 2,512 2,512 2,512
Refined Oil 2,778 3,010 3,193 845 2,264
confidential Colombo Port Development Plan | March 2019 Page 105(‘000 Tons) 2016 2020 2025 2030 2050
LNG - 343 781 995 1,994
Total 4,463 4,936 6,485 4,352 6,769
5.6 Capacity Development & Requirement
The sea side pumping capacities for SBM 1 and 2 and the Dolphin are sufficient, with sufficient storage
for current use. LNG handling facilities will have to be developed immediately. The requirements per
timeframe are:
2025 – LNG handling and storage facilities are required immediately to avoid operational delays of the
new gas-fired power plant. Additionally, new refining capacity is required and the old pipelines need
to be renewed.
2030 – Possible relocation of the dolphin jetty, in case of North Port construction and operations.
2050 – No additional capacity requirements.
5.7 Recommendations and Short Term Priority Projects
The preceding analyses result in the following recommendations for liquid bulk:
R4. The condition of the dolphin jetty & pipelines should be assessed. Refurbishment of pipelines may
be required, depending on the outcome of the technical surveys.
R5. The dolphin terminal may be replaced by a new facility once the north port development starts and
the breakwater is no longer required.
R6. The crude oil capacity should be improved in parallel with the upgrade of the refinery. This upgrade
may be realized together with the new LNG facility (integrating the dolphin jetty facility), through
development of new oil jetties in the envisaged north port, or through development of new SBM
facilities offshore. In case a new refinery is developed in Hambantota, plans for rehabilitation of the
refinery near Colombo may be adjusted.
The recommendations lead to the following short-term priority projects, which will be further
discussed in section 15:
SP4. Sapugaskanda oil refinery - Sapugaskanda oil refinery is in poor state and operates near densely
populated areas. As such, the oil refinery may need to be revamped and/or relocated. It is noted
that the Sapugaskanda refinery is not an SLPA facility.
SP5. LNG Storage Facility - An LNG handling and storage facility is to be developed, to serve the
envisioned Kerawalapitya LNG power plant and enable LNG bunkering activities in the port. A
floating LNG storage vessel with regassification units on board is recommended. Such a solution
would reduce the need for LNG related structures ashore. The pipeline connection to the
powerplant should take into consideration the future location of North Port.
confidential Colombo Port Development Plan | March 2019 Page 1066 General Cargo and RoRo
6.1 Introduction
This chapter aims to define the development need for general cargo and RoRo business and the
development options to cater for the required capacity. The following approach is applied.
• This chapter starts in section 6.2 with an overview of the current general cargo and RoRo facilities.
• Section 6.3 presents the current and historic demand development - It is observed that general cargo
throughput at the Port of Colombo has remained stable at around 800,000 tons between 2007 and 2016.
RoRo throughput has declined substantially, due to recent policy changes that elicited the shift of RoRo
transhipment from Colombo to Hambantota.
• Section 6.4 provides an overview of the global and expected country - specific vessel trends for the general
cargo and RoRo trades.
• Section 6.5 provides the general cargo and RoRo volume projection up to 2050 – It is estimated that
general cargo demand will increase to approximately 1.0 M tons in the coming decade, due to the ongoing
large-scale infrastructure projects, such as the Port City, the PAEH, and the Megapolis plans; subsequently,
it is expected that general cargo demand will decline to a long term demand of approximately 0.5 M tons
per annum. Despite growing national demand, RoRo demand at the Port of Colombo is expected to keep
declining, to an estimated 23,569 vehicles in 2050.
• The capacity need is estimated in section 6.6 – It is observed that the envisaged transformation of BQ and
the start of container operations at ECT will result in a decrease in general cargo capacity in the port.
Conversely, it is envisaged that UCT and JCT berths 1 and/or 2 will be transformed to accommodate
general cargo operations.
• Section 6.7 concludes with the recommended short term priority projects – It is recommended that a plan
is established to guide the transformation of UCT towards a terminal that is capable of handling general
cargo efficiently.
confidential Colombo Port Development Plan | March 2019 Page 1076.2 Overview current general cargo and RoRo facilities
Facilities & Capacities
Currently, there are no dedicated terminals for handling general cargo and RoRo. RoRo is handled at
Unity Container Terminal (UCT) as the diminishing container operations have resulted in adequate
space to store vehicles.
General cargo is handled at several places in the port, but mainly at BQ. Additionally, the partially
constructed ECT facility is temporarily used to accommodate deeper draft general cargo vessels. The
capacities presented below provide an indication of general cargo capacities; however, it is noted that
capacities may vary substantially across specific commodity types (e.g., steel versus other cargo types,
due to its weight and required handling equipment).
Figure 6-1: General Cargo and RoRo Handling
The table below presents the port’s RoRo capacity and throughput. Subsequently, Table 6-2 provides
an overview of the port’s general cargo capacity and throughput.
Table 6-1: Capacity RoRo
Terminal Quay Length Berths Water Depth Terminal Estimated 2016
(m) (#) (m) Area Capacity Throughput
(ha) (Vehicles) (Vehicles)
UCT 590 2 -9 to -11 4 ha 50,000 33,000
confidential Colombo Port Development Plan | March 2019 Page 108You can also read