Tapering in a Time of Conflict
←
→
Page content transcription
If your browser does not render page correctly, please read the page content below

U N I T E D N AT I O N S C O N F E R E N C E O N T R A D E A N D D E V E L O P M E N T

T R A D E A N D D E V E L O P M E N T R E P O R T U P D AT E

                                                                                                                      MARCH 2022
Tapering in a Time
of Conflict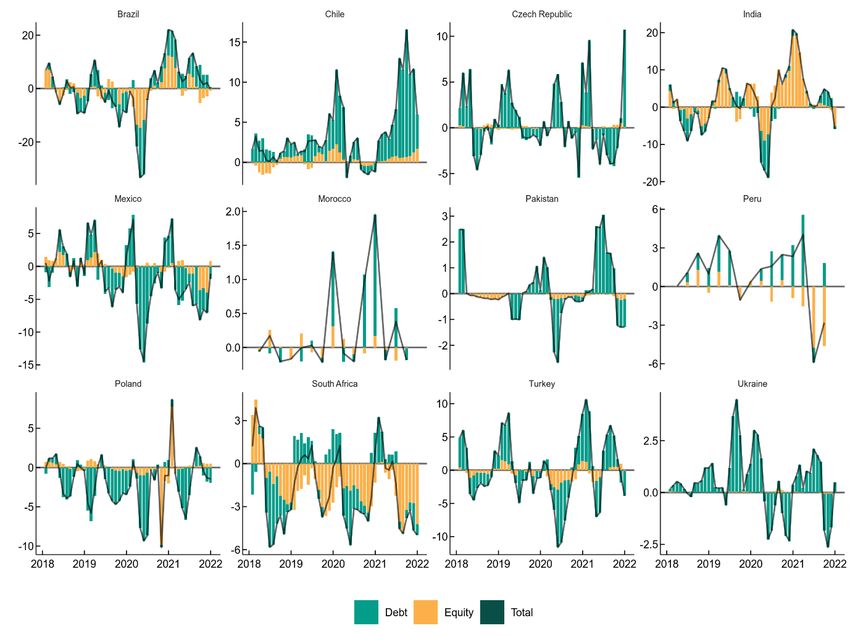
© 2022, United Nations Conference on Trade and Development

The designations employed and the presentation of material on any map in this work do not
imply the expression of any opinion whatsoever on the part of the United Nations concerning
the legal status of any country, territory, city or area or of its authorities, or concerning the
delimitation of its frontiers or boundaries.
This publication has not been formally edited.

                                 UNCTAD/GDS/INF/2022/2
A. Introduction
The global economy is, literally and metaphorically, staring down the barrel of a gun. Stopping
the war in Ukraine, rebuilding its economy and delivering a lasting peace settlement must be
the priorities. But the international community will also need to deal with the widespread
economic damage that the conflict is already causing in many parts of the developing world;
damage that will only intensify as the conflict persists. Recalling George Marshall’s response
to the challenges of an earlier post-conflict world, the truth of the matter is that for a significant
number of countries, the financial requirements for the next few years are so much greater than
their present ability to pay that substantial additional help will be needed to mitigate economic,
social, and political deterioration of a very grave character. 1
The year 2022 already appeared to be one of decelerating and uneven growth. The
unprecedented policy measures that helped economies around the world recover from the
paralysis of the covid pandemic have been asymmetric in their effects and short-term in scope,
adding new challenges to an already testing policy environment. As we argued in September
2021 (TDR 2021), a return to pre-2020 conditions should not be the goal of policymakers. It
would diminish the hope of achieving more inclusive and sustained growth and undermine the
task of building economic resilience in the era of climate change. The threat of repeating the
policy mistakes of the past is, however, rising as the fallout from the conflict in Ukraine spreads
beyond its borders.
The economic, financial and political reverberations from the war are unfolding at a turning
point in global policy discussions, as the supportive public policy stance necessitated by the
pandemic gives way to fiscal and monetary tightening. In the advanced economies, central
banks are beginning to raise interest rates from historic lows and selling some of the assets they
purchased during the decade of quantitative easing. Budgetary authorities, having issued large
volumes of government debt during the pandemic, are turning their focus to reducing primary
balances by raising taxes and cutting spending.
In the face of long-standing structural problems and new geopolitical risks, macroeconomic
tightening in the North, along with a general weakening of multilateral rules and practices, is
set to stymie growth across developing economies, particularly those that are closely integrated
into the global financial system. This will not only endanger their fragile recovery, but also
undermine their long-term development.
Already in the closing months of 2021, inflationary and exchange rate pressures began to
trigger monetary tightening in a number of developing countries, with expenditure cuts
anticipated in upcoming budgets. A likely effect of the conflict in Ukraine is an acceleration
and widening of these measures, with the purpose of retaining volatile foreign capital.
Two immediate impacts of the war in Ukraine have been exchange rate instability and surging
commodity prices, particularly for food and fuel. The added pressure of price increases is
1
The "Marshall Plan" speech at Harvard University, 5 June 1947,
https://www.oecd.org/general/themarshallplanspeechatharvarduniversity5june1947.htm
TRADE AND DEVELOPMENT REPORT UPDATE: MARCH 2022
UNCTAD Tapering in a Time of Conflict 1intensifying calls for a policy response in advanced economies, including on the fiscal front,
threatening a sharper than expected slowdown in growth.
The danger for many developing countries that are heavily reliant on food and fuel imports is
more profound, as higher prices threaten livelihoods, discourage investment and raise the
spectre of widening trade deficits. With elevated debt levels from the pandemic, sudden
currency depreciation can quickly make debt service unsustainable and tip some countries into
a downward spiral of insolvency, recession and arrested development. Whether this leads to
unrest or not, a profound social malaise is already spreading.
As a result, the global economy, having entered 2022 on a “two-speed” recovery path, will not
only shift down a gear in terms of growth, but will also see many developing countries lose
ground to advanced countries, while their vulnerability to shocks is heightened by rising geo-
political tensions and deepening economic uncertainty.
Figure 1.1 Change in selected exchange rates against the dollar, early January–mid March 2022
(Per cent)
Brazilian real
Peruvian sol
Colombian peso
Chilean peso
South African rand
Egyptian pound
Thai baht
Indonesian rupiah
Bangladeshi taka
Malaysian ringgit
Nigerian naira
Mexican peso
Pakistani rupee
Czech koruna
Romanian leu
Indian rupee
Bulgarian lev
Hungarian forint
Poland złoty
Moroccan dirham
Argentine peso
Turkish lira
-10% -5% 0% 5% 10%
Overall change Jan 3 until Feb 24 Feb 24 until Mar 17
Source: UNCTAD secretariat calculations based on Refiniv data.
Note: An increase refers to an appreciation of the domestic currency. Calculated using daily closing exchange rates. The rate
for 17 March is calculated as the average of the closing rates for the three days from 15 March to 17 March.
As suggested in TDR 2021, the impressive growth of the word economy in 2021 notwithstanding,
the post-pandemic world is looking increasingly fragile, with external shocks becoming more
unpredictable and complex in nature. Even in peaceful times, unregulated and unbalanced
TRADE AND DEVELOPMENT REPORT UPDATE: MARCH 2022
UNCTAD Tapering in a Time of Conflict 2international financial markets have been the source of much of that fragility for many developing
countries. At a time of international conflict and heightened geopolitical risks, finance is a central
mechanism for transmission and amplification of these risks. While the immediate financial
consequences of the war and sanctions on the Russian Federation have not immediately triggered
an international financial crisis or contagion effects that would signal a crisis for emerging market
economies, this cannot be discounted (Figure 1.1).
The risks to countries’ financial systems are further amplified by the pressure to “rebuild fiscal
buffers” by cutting non-military government spending. In fact, as discussed in previous Trade
and Development Reports, attempts to create fiscal space through budget cuts are bound to
backfire. Building resilience requires reinforcing aggregate demand through investment and
social protection, in a framework of appropriate multilateral institutions.
The existing crisis management mechanisms of the global financial architecture leave the
developing economies in a particularly vulnerable position. The liquidity stresses that are likely
to emerge in these countries in the coming phase of post-pandemic reopening, international
conflict and climate emergencies, will exceed the willingness of the Federal Reserve in its
recently adopted role of unofficial lender-of-last resort. Globally, the issuance of $650 billion
of new SDRs in August 2021, of which around $275 billion were allocated to developing
economies was a welcome development, but well short of the amounts required.
In the current geopolitical context, given the ambiguous role of the Fed – pressed, on the one
hand, by its national mandate and by its de facto global function, on the other – as well as
coordination difficulties at the level of the IMF in times of complex crises, it is vital that
governments agree to the establishment a rules-based system of multilateral policy-
coordination in finance. Ad hoc, highly selective international initiatives, such as those that
were deployed in 2008-09 and during the pandemic crises, cannot provide a reliable solution
for all in the coming era of complex shocks that are global in impact.
As the war in Ukraine and its consequences have taken centre stage, the budding discussions
on decarbonization and long-term development have been again put on hold. But the
intertwining of finance, food and fuel shocks stemming from the war in Ukraine is likely to be
a preview of what is in store in an overheating world. Indeed, as outlined in the latest report
from the IPCC (2022), the threat from rising global temperatures is already causing serious
economic damage and untold suffering across the developing world. Mitigating this threat will
require a profound change in the way the multilateral order safeguards global economic
resilience on the one hand, and its ability to develop new policy mechanisms to respond to
increasingly complex external shocks, on the other.
B.1. Global macroeconomic outlook
Global growth prospects for 2022 will be affected by downside risks to both supply and demand,
compounded by the war in Ukraine. On the supply side, persistent disruptions will continue to hamper
economic activity. At the same time, macroeconomic tightening will weaken demand while rising
prices will erode real incomes and dampen investor confidence. These pressures will only deepen the
geographical, financial and socio-economic fractures that marked the recovery in 2021.
TRADE AND DEVELOPMENT REPORT UPDATE: MARCH 2022
UNCTAD Tapering in a Time of Conflict 3Table 1.1 World output growth, 2017–2022
(Annual percentage change)
Rev. from
TDR 2021 Revised
TDR 2021
2017 2018 2019 2020 2021 2022a 2022a 2022
World 3.4 3.2 2.6 -3.4 5.6 3.6 2.6 -1.0
Africa 3.3 3.5 2.8 -2.9 4.4 2.9 1.8 -1.1
North Africa (incl. South Sudan) 4.8 4.3 2.8 -4.7 6.4 3.1 2.2 -0.9
South Africa 1.2 1.5 0.1 -6.4 4.9 2.3 1.1 -1.2
Sub-Saharan Africa (excl. South Africa
and South Sudan) 3.0 3.5 3.5 -1.1 3.2 2.9 1.8 -1.1
America 2.2 2.5 1.8 -4.3 5.7 2.9 2.4 -0.5
Latin America and the Caribbean 1.3 1.0 0.1 -7.2 6.2 2.6 2.3 -0.3
Central America (excl. Mexico) and
Caribbean 3.1 3.1 2.3 -8.4 6.6 2.9 3.5 +0.6
Mexico 2.1 2.2 -0.2 -8.4 4.8 2.8 1.3 -1.6
South America 0.8 0.3 -0.2 -6.6 6.7 2.5 2.4 -0.1
of which:
Argentina 2.8 -2.6 -2.0 -9.9 10.1 2.9 4.6 +1.7
Brazil 1.3 1.8 1.4 -4.1 4.6 1.8 1.3 -0.5
North America 2.4 2.9 2.3 -3.5 5.6 3.0 2.4 -0.6
of which:
Canada 3.0 2.4 1.9 -5.2 4.6 2.9 3.0 +0.1
United States 2.3 2.9 2.3 -3.4 5.7 3.0 2.4 -0.6
Asia (excl. Cyprus) 5.1 4.7 3.8 -1.1 6.1 4.7 3.8 -0.9
Central Asia 4.5 4.8 5.1 -0.2 4.9 3.1 0.2 -2.9
East Asia 5.2 4.8 4.1 0.3 6.4 4.7 3.9 -0.8
of which:
China 6.9 6.7 6.0 2.2 8.1 5.7 4.8 -0.9
Japan 1.7 0.6 -0.2 -4.5 1.6 2.1 2.0 -0.1
Republic of Korea 3.2 2.9 2.2 -0.9 4.0 2.8 1.7 -1.1
South Asia 6.2 5.4 3.3 -4.7 7.0 5.7 4.0 -1.7
of which:
India 6.1 7.3 4.8 -7.0 8.3 6.7 4.6 -2.1
South-East Asia 5.3 5.1 4.4 -3.9 2.5 4.7 3.4 -1.3
of which:
Indonesia 5.1 5.2 5.0 -2.1 3.7 4.9 4.4 -0.5
Western Asia (excl. Cyprus) 2.5 2.4 1.5 -3.5 6.0 3.2 3.4 +0.2
of which:
Saudi Arabia -0.7 2.5 0.3 -4.1 3.3 3.3 4.8 +1.5
Turkey 7.5 3.0 0.9 1.8 11.0 3.6 2.5 -1.2
Europe (incl. Cyprus) 2.6 2.1 1.8 -6.0 5.2 3.0 0.9 -2.1
of which:
European Union (EU 27) 2.8 2.1 1.8 -6.0 4.9 3.3 1.6 -1.7
of which:
Euro area 2.6 1.8 1.5 -6.4 5.0 3.4 1.7 -1.7
of which:
France 2.3 1.8 1.8 -8.0 7.0 3.4 2.4 -1.0
Germany 2.7 1.1 1.1 -4.6 2.9 3.2 1.4 -1.8
Italy 1.7 0.9 0.4 -8.9 6.6 3.0 1.6 -1.4
Russian Federation 1.8 2.8 2.2 -2.7 4.7 2.3 -7.3 -9.6
United Kingdom 2.1 1.7 1.7 -9.4 7.5 2.1 1.3 -0.9
Oceania 2.7 2.9 2.1 -2.4 3.9 2.8 3.0 +0.2
of which:
Australia 2.5 2.8 1.9 -2.5 4.6 2.8 3.3 +0.5
Memo items:
Developed (M49, incl. Republic of Korea) 2.5 2.4 1.8 -4.5 5.0 2.9 1.8 -1.1
Developing (M49) 4.9 4.6 3.7 -1.7 6.7 4.7 3.7 -1.0
Source: UNCTAD secretariat calculations based on official data and estimates generated by United Nations Global Policy Model.
Note: Calculations for country aggregates are based on GDP at constant 2015 dollars.
a Forecasts.
TRADE AND DEVELOPMENT REPORT UPDATE: MARCH 2022
UNCTAD Tapering in a Time of Conflict 4Global growth in 2022 will, as a result, be slower, more uneven and more fragile than we
expected in September 2021 (Table 1.1). Our estimates incorporate the two main new features
of the world economic situation: the war in Ukraine and tightening macroeconomic policy in
developed economies.
Before the outbreak of the war in Ukraine, global growth was already projected to slow in
2022, with the recovery from the pandemic shifting to more long-term rates, pandemic
restrictions abating and supply pressures continuing.
The economic reverberations of the war have led to significant downward revisions to growth
figures, as incomes are squeezed further by increased food and fuel prices, global trade is
curtailed by sanctions, and confidence and financial instability issues re-emerge. As a result of
the conflict, oil and gas prices have surged from already elevated levels, wheat prices have
reached levels not seen since the late 2000s, and a wide range of other items including
fertilizers, metals and manufacturing inputs are facing severe supply shortages.
As mentioned, the main advanced economies are in the process of reversing the stimuli enacted
during the pandemic, by tightening policy rates, unwinding Central Bank asset purchases, and
cutting furlough programmes, transfers and support to businesses and households. These shifts
will dampen domestic economic activity and weaken global demand. By implication, economies
in the Global South, which have incurred larger costs to cope with the pandemic, face additional
constraints on demand and in the balance of payments at a time when their recovery is struggling
to take off. The war in Ukraine compounds this situation, by adding restrictions on trade, financial
risks and economic destruction.
Global growth, measured in constant United States dollars at market exchange rates, is
expected to decelerate from 5.6 per cent in 2021 to 2.6 per cent in 2022. Of the 3-point drop,
two percentage points are due to structural and policy factors pre-dating the war and one
percentage point, amounting to approximately $1 trillion in foregone income, is due to the war.
This assumes that the sanctions and the supply chain disruptions will last through 2022, even
if the war ends.
Hardly any country will be immune from the deterioration of global growth prospects, although
a few may benefit from higher prices and demand for their commodity exports. Yet it is those
developing economies that were in a precarious situation due to debt obligations, supply shocks
and terms-of-trade and exchange rate swings, that will see their economic performance
deteriorate even further.
The United States, while relatively isolated from current shocks, will see further pressure on
consumption expenditure from higher fuel and food prices and may introduce a fiscal response
in the form of fuel subsidies. Consumption expenditures in the United States have returned to
pre-pandemic trends, but the inflationary pressures together with flagging confidence will
impose a deceleration. Investment has recovered strongly since the pandemic compared to
European countries but the new sources of instability will likely shift resources to safe asset
allocations instead of productive ventures. These prospects will be made worse by monetary
tightening. High energy prices are likely to stimulate some investment in extraction of
hydrocarbons, likely crowding out any plans for a transition out of fossil fuels.
Europe will be harder hit by both high commodities prices and the conflict in Ukraine. Across
Europe, higher food and fuel prices will constrain domestic expenditure, weakening aggregate
TRADE AND DEVELOPMENT REPORT UPDATE: MARCH 2022
UNCTAD Tapering in a Time of Conflict 5demand. The German economy is highly dependent on imports of natural gas from the Russian
Federation, and on its own manufacturing exports which will be disrupted by sanctions and the
war. Increased military expenditure will provide a moderate addition to aggregate demand. The
French economy may be somewhat better prepared to weather the storm, given lower
dependence on imported energy due to nuclear power, substantial food exports and the
likelihood of some fiscal relaxation in response to the shocks. Pronouncements from the
European Central Bank suggest that monetary tightening will proceed, further weakening
consumption and investment growth.
Figure 1.2 Real gross domestic product, selected countries,
first quarter 2019 to fourth quarter 2021
(Index numbers, Q1 2019 = 100)
Source: UNCTAD secretariat calculations based on Refinitiv data.
TRADE AND DEVELOPMENT REPORT UPDATE: MARCH 2022
UNCTAD Tapering in a Time of Conflict 6Eastern European and Central Asian economies too will be hit hard by the conflict. Higher food
prices, falling remittances and large numbers of refugees will place these economies under
strain. The picture for the region as a whole is mixed, with some economies directly or
indirectly suffering severe losses from the conflict and trade restrictions (induced by sanctions
or by inability to reach exporting hubs), and others being able to gain market access and at
higher prices.
The Russian economy faces stringent external constraints imposed by the sanctions. While the
Russian Federation is still exporting oil and gas, and will therefore see compensating increases
of revenue due to high prices, sanctions severely limit the use of foreign exchange earnings for
the purchase of imports or debt servicing. The Russian Federation will experience shortages of
a wide range of imported goods, high inflation and a devalued currency. While the state will
likely act to cushion the shock and limit unemployment and the fall of household incomes, its
capacity is limited. Trade with China and some other partners will continue, but it will not be
able to provide substitutes for the wide range of imported goods that the Russian Federation
currently cannot access. Assuming the sanctions remain in place through 2022, even if the
fighting in Ukraine ends, Russia will experience a severe recession (See Appendix A on
Regional Trends for a fuller analysis).
Japan, already facing a weak recovery from the pandemic, and heavily dependent on energy and
commodity imports, will be further constrained by high energy prices and disruption to export
markets as a result of sanctions. The Chinese economy was expected to continue with their long-
term adjustment towards higher household income and consumption spending, alongside slowing
of other growth components. Yet, Chinese growth will not escape the effects of the supply shock,
with high grain prices, disruption to exports and manufacturing and a resurgent pandemic, all
contributing to lower growth. The authorities will be able to cushion negative external trends to
an extent, through the usual channels of credit expansion and investment spending. Nonetheless,
the earlier announced target of 5.5 per cent will challenge policymakers.
Other economies in Asia will experience headwinds resulting from the conflict. The
Republic of Korea and other relatively strong economies of East Asia would have needed
a sustained rebound of manufacturing and trade services to regain strong momentum, but
these will be shaken by the gyrations of international trade resulting directly or indirectly
from the war (including the milder growth prospects for China, Japan and Europe). On top
of that, strains in access to primary commodities and energy will represent a shock, adding
inflationary pressures and potentially tightening responses. Meanwhile, as some of the
other economies in South and Western Asia may gain some benefits from fast growth of
demand and prices of energy, they will be hampered by the adversities in primary
commodity markets, especially food inflation, and will be further hit by inherent financial
instabilities. India, in particular, will face restraints on several fronts: energy access and
prices, primary commodity bottlenecks, reflexes from trade sanctions, food inflation,
tightening policies and financial instability.
The picture is mixed in Latin American economies: consumption expenditures in Brazil,
Argentina and Mexico remain below pre-pandemic levels, while Chile and Colombia have seen
strong rebounds. Brazil, Argentina, Peru and Chile have seen strong recoveries in investment
from the deep declines in 2020 and have benefitted from the sharp rebound of global
commodity markets. But Brazil was already expecting a severe slowdown (with negative
TRADE AND DEVELOPMENT REPORT UPDATE: MARCH 2022
UNCTAD Tapering in a Time of Conflict 7growth in the second part of 2021) due to extreme tightening of monetary policy, and Argentina
was expected to slow down, from a very rapid pace in 2021, under the weight of external debt
pressures. At present, it is estimated that while Latin American growth figures will decline
substantially from highs achieved during the pandemic rebound, the energy and commodity
exporters of the group, which represents the bulk of regional output, will still see relatively
strong growth compensations.
Economies of Africa will be affected in mixed ways, but growth expectations for 2022 of the
region as a whole will be lower than estimated earlier in the year. The considerable weight of
oil and gas exports of the region will stimulate growth through higher volume and prices, but
commodities represent a mixed bag. Only few of the staples exported by Africa are likely to
help circumvent the bottlenecks resulting from the conflict in Ukraine, but for the most part
African economies are either food dependent or face supply bottlenecks of their own. And
while minerals may see a rebound in prices and demand, some of these products face some
investment and infrastructure bottlenecks. Overall, the global shock of commodities will imply
a relatively negative shock for the region as a whole, especially through food prices and
domestic consumption. On top of that, while the stresses resulting from a continuing pandemic
in the region had earlier in the year started to draw some attention and policy gestures from
advanced economies, these have unfortunately faded away in the context of the conflict.
Australia, New Zealand, Canada and other developed countries closely ‘allied’ with the United
States and Europe in the current conflict will, on the one hand experience some of the
headwinds that affect most of these countries (inflationary pressures leading to tightening
policy responses, high international prices of commodities, supply shortages, etc.) but, on the
other hand, will see some windfall gains through export markets of their commodities and
energy products, which will trigger positive terms of trade effects on domestic spending
(including government spending) and hence growth.
B.2. Policy tapering
In late 2021-early 2022, the shift to tighter macroeconomic policy in developed countries
began. This turn was triggered by concerns for inflation, which rose sharply in many of these
countries as economies reopened, driven by supply chain bottlenecks, the shifting composition
of consumer demand and environmental degradation. Expectations that these effects would
fade quickly were, unfortunately, not fulfilled.
In the United States, consumer spending has returned to pre-pandemic trends, but with a
significant switch to goods over services. Consumption expenditures in other rich nations have
not recovered as strongly, likely reflecting less aggressive fiscal support measures. In Japan
and many euro area countries, consumption expenditure remains below pre-pandemic levels.
The picture is mixed in Latin American and Eastern European economies: consumption
expenditures in Argentina, Brazil and Mexico remain below pre-pandemic levels, while Chile,
Colombia and some Eastern European countries have seen consumption expand beyond pre-
pandemic levels.
Investment expenditure has also recovered more strongly in the United States than in most of
the euro area countries (Figure 2.1). Argentina, Brazil, Chile and Peru have also seen strong
recoveries in investment from the deep declines in 2021, while other Latin American countries,
TRADE AND DEVELOPMENT REPORT UPDATE: MARCH 2022
UNCTAD Tapering in a Time of Conflict 8South Africa, and many Eastern European countries are experiencing weak or declining capital
investment. Investment growth will be constrained further as fiscal support is withdrawn and
economic activity slows down. Even for those developing economies where investment
recovered strongly, trends may reverse over the course of 2022.
Relatively limited inflationary pressure in export-oriented Asian economies is likely to obviate
calls for the policy tightening which is already happening in Latin American and African
economies with higher inflation, particularly those economies which are dependent on
commodity imports and external financing (the Republic of Korea is a partial exception). The
resulting divergence in interest rates
is likely to encourage carry trades
Figure 2.1 Gross fixed capital formation and may add to the existing fragility
(Index numbers, Q3 2019 = 100) in external financial positions.
External constraints will likely grow
tighter for many countries which are
105
dependent on foreign exchange
100
earnings to cover imports.
95
These constraints will be further
90
tightened by dollar appreciation as
85 the Fed hikes rates. Currency
80 depreciation will increase the
75 financing costs of debt denominated
Sep
2019
Mar
2020
Sep
2020
Mar
2021
Sep Dec
2021 2021
in foreign exchange. Even in the case
of externally held debt issued in
Canada
Germany
domestic currencies, depreciation
Spain places pressure on the balance sheets
France
United Kingdom of overseas investors who fund their
United States
positions in United States dollars or
Source: UNCTAD secretariat calculations based on Refinitiv data. other foreign currencies, raising the
likelihood that positions will be
unwound, or rollover costs
increased. As economies reopen and import demand recovers, global imbalances are likely to
widen.
In this context, developing countries are in a particularly vulnerable position. The pandemic has
led to a dramatic worsening of hunger and malnutrition (WHO, 2021). Rising prices of food and
fuel will exacerbate the fall in real incomes for many. Poverty, which was only deepened during
the pandemic with an estimated additional 80 million pushed into extreme poverty, has become
an even bigger problem confronting most developing countries (World Bank, 2020).
The ability of developing countries to respond to these challenges is limited. Their policy space
– already narrow due to balance of payments constraints – is being squeezed further by
macroeconomic tightening in developed economies and the withdrawal of fiscal and monetary
support. There are growing financial vulnerabilities: stocks of debt, particularly external debt,
have risen in many developing economies, and deepening financial integration widens the socio-
economic scope of the impact from the dynamics of the global financial cycle.
TRADE AND DEVELOPMENT REPORT UPDATE: MARCH 2022
UNCTAD Tapering in a Time of Conflict 9The war in Ukraine puts macroeconomic policymakers in developed economies in a
conundrum. Higher inflation raises the pressure to tighten policy. Prior to the start of the
conflict, the central banks of developed countries had been hawkish about the path of interest
rates. Following the 25 basis point rise in interest rates on the 16 March 2022, the Federal
Reserve is expected to raise rates to around 1.75 per cent over the next twelve months and up
to 2.8 per cent in 2024.
Alongside rising policy rates, central banks have begun the process of unwinding the large
increases in quantitative easing enacted during the pandemic. By lowering the cost of public
borrowing, quantitative easing helped governments in high income countries to issue large
amounts of debt, thus funding unprecedented fiscal deficits. As monetary support is withdrawn
and interest rates rise, the governments of high-income counties are also shifting towards fiscal
tightening.
It is not obvious, however, that tighter monetary and fiscal policies are the correct response to
inflation driven by supply-side bottlenecks. In developed countries price controls and income
support could help households cope with rising costs (see below). And while the shift to
monetary tapering and contractionary fiscal policy in developed countries may turn out to be a
policy error for them, it may have disastrous repercussions for developing countries if it triggers
appreciation of the dollar.
In light of the dislocations caused by the war in Ukraine and the potential for financial disorder,
central banks could still opt to postpone (or at least slow) tightening and instead, maintain or
increase the provision of liquidity. A dual strategy of liquidity provision in the form of bond
purchases, alongside higher interest rates, may emerge. It is also possible that we will see
divergence in the policy stances of advanced economies with the United States, which is not
directly affected by the conflict and is facing higher inflation than Europe, going ahead with
tightening, and the European Central Bank keeping policy accommodative to offset the impact
of the conflict.
Rate hikes in advanced economies, alongside disorderly movements in global financial
markets, would be a devastating combination for developing economies. Volatility in
commodity futures and bond markets alongside flights to safety would be reflected in higher
risk premia on the financial liabilities of developing economies, in addition to the considerable
pressures from rate hikes. Even in the absence of disorderly moves in financial markets,
developing economies will face severe constraints on growth. During the pandemic, public and
private debt stocks in developing countries have increased. Issues that receded from view
during the pandemic, such as balance of payments constraints, high corporate leverage and
rising household debt, will resurface as policy tightens.
While the outlook for lower- and middle-income economies has darkened substantially as a
result of the enduring pandemic, the dynamics of the next phase of the economic recovery
remain uncertain. Lessons from the experience of 2013 round of tapering point to a mixed
picture: in 2013, the mere mention of monetary tapering by the Federal Reserve generated a
major liquidity shock as investors withdrew funding from developing economies (Table 2.1).
This put severe pressure on exchange rates, foreign reserves and funding costs.
TRADE AND DEVELOPMENT REPORT UPDATE: MARCH 2022
UNCTAD Tapering in a Time of Conflict 10Table 2.1 Average annual growth in developing Today, the likelihood and timing of a
regions, 2001–2008 and 2014–2019 similar episode in response to current
(Per cent) policy tightening cannot be predicted
Average Average with any confidence, given the role of
annual growth annual growth
2001–2008 2014–2019 volatile expectations, market
sentiment and herd behaviour in such
Latin America and Caribbean 3.9 0.5
episodes. The ramifications of the
East Asia 5.8 4.8
conflict in Ukraine and sanctions
South Asia 6.7 5.9 imposed on the Russian economy
Western Asia 5.5 2.7 further compound this uncertainty.
North Africa 5.4 2.8
Sub-Saharan Africa
Today in many countries, current
6.5 3.5
(excl.South Africa) account deficits are smaller than in
Source: UNCTAD, TDR 2021 table 1.1. 2013, and thus external capital
inflows, including volatile portfolio
inflows, appear to pose lower immediate risks. In several large developing economies, stocks
of foreign exchange reserves have increased. Yet indicators such as current account positions
and foreign reserves are limited in predicting vulnerability to short-run liquidity movements.
Measures of financial integration provide a better gauge of potential exposures. On this
measure, the picture is not substantially changed from 2013 – many large developing
economies remain financially open and thus vulnerable to sudden reversals in financial flows
(Figure 2.2).
Figure 2.2 Chinn-Ito financial openness by country income groups, 1970–2019
Source: UNCTAD secretariat calculations based on Chinn, Menzie D. and Hiro Ito (2006).
Note: Simple average of Chinn-Ito index for 36 developed economies, 48 high-income developing economies, 29 low-income
developing economies and 48 middle-income developing economies.
TRADE AND DEVELOPMENT REPORT UPDATE: MARCH 2022
UNCTAD Tapering in a Time of Conflict 11Whether the coming period is characterized by volatile liquidity-driven cross-border financial
flows, or by the slower grind of diminished policy space, fiscal and monetary tightening and
squeezed incomes, it is people in the developing world who will be forced to take on a
disproportionate share of the adjustment to the post-pandemic global economy. The crucial
missing element from the international policy-making framework is a financial system that
enables developing countries to invest for the long term, to introduce the changes needed to
mitigate the enormous costs of climate change, and to avoid externally imposed austerity in
response to dynamics in advanced economies and external shocks.
C. Trade
The war in Ukraine has caused immediate disruptions to global trade and is likely to have
longer-term effects on its structure too. In the short-term, price effects and scarcity are spilling
over onto economies more dependent on Ukrainian and Russian exports, especially of
commodities, ranging from oil to minerals and food.
Figure 3.1 Wheat imports from the Russian Federation and Ukraine to selected developing countries
(Per cent of total wheat imports)
Somalia
Armenia
Benin
Lao People's Dem. Rep.
Korea, Dem. People's Rep. of
Georgia
Azerbaijan
Syrian Arab Republic
Egypt
Nicaragua
Lebanon
Sudan
Congo, Dem. Rep. of the
Senegal
Tanzania, United Republic of
Qatar
Rwanda
Madagascar
Congo
Burkina Faso
Gambia
Libya
Tunisia
Uganda
United Arab Emirates
Burundi
Yemen
0 10 20 30 40 50 60 70 80 90 100
Russian Federation Ukraine
Source: UNCTAD secretariat calculations based on UNCTADstat and FAOSTAT.
Note: Data refer to the 2018–2020 average for 'wheat (including spelt) and meslin, unmilled' product. The selection of
developing countries is based on two criteria: (i) a ratio of net imports of wheat over domestic production exceeding 20 per cent;
and (ii) a ratio of imports from the Russian Federation and Ukraine over the total imports of wheat exceeding 50 per cent.
TRADE AND DEVELOPMENT REPORT UPDATE: MARCH 2022
UNCTAD Tapering in a Time of Conflict 12Preliminary data point to special vulnerabilities in Africa. In 2018–2020, Africa imported $3.7
billion of Russian wheat (32 per cent of the total) and another $1.4 billion from Ukraine (12 per
cent). In the case of Least Developed Countries (LDCs) the corresponding imports were
respectively $1.4 billion (29 per cent of the total) and $0.5 billion (10 per cent). The dependence of
individual African and LDC countries on wheat imports from the Russian Federation and Ukraine
is in many cases, far higher (Figure 3.1).
In the medium term, fear of ongoing geopolitical instability is likely to lead to reorganization of
value chains to reduce dependency on imports from countries that may be subject to sanctions. As
disruptions to value chains are being eased in the wake of the pandemic, calls have arisen for closer
further trade integration across the Atlantic and the South Pacific. Some strategically important
production processes, like military equipment, are likely to be ‘re-shored’.
In 2021, global trade of goods and services rebounded markedly and reached a record high of
$28.5 trillion, 13 per cent higher than its pre-pandemic peak. Greater merchandise trade
volumes – as demand has shifted sharply from services (travel, leisure and entertainment) to
durable goods since March 2020 – and higher unitary prices for some key commodities
supported this outcome.
The dollar value of merchandise trade grew 26.5 per cent in 2021. Netting out the price effect,
it is estimated that this segment of world trade grew 9 per cent in 2021 in real terms, after being
almost flat in 2019 and contracting more than 5 per cent in 2020, putting it about 3 per cent
higher than its pre-pandemic peak.
Figure 3.2 World merchandise exports, January 2015–Dec 2021
(Index numbers, average 2010 = 100)
Source: CPB Netherlands Bureau for Economic Policy Analysis, World Trade Monitor database.
Note: Country group classification relies on Ebregt (2020).
TRADE AND DEVELOPMENT REPORT UPDATE: MARCH 2022
UNCTAD Tapering in a Time of Conflict 13Overall, the rebound of merchandise trade was broad-based, both in terms of products and
exporting economies. Asian exporters led the recovery in terms of volumes since the region is
skewed towards manufactured goods such as automobile, electronics, furniture and machinery.
Meanwhile, large commodity-exporters benefitted from elevated export prices, though their
volumes are little changed from their pre-pandemic levels (Figure 3.2).
By contrast, the value of trade in services remained slightly below its 2019 figure, though it
rose about 17 per cent in 2021. The composition has, however, changed since the outbreak of
the pandemic. Digitally deliverable services such as computer, financial and business services,
together with air freight transport, have registered robust performances while other sectors like
the ones relating to travel and tourism are still severely depressed.
Figure 3.3 Global Supply Chain Pressure
Among the sectors that have more
Index (GSCPI), effectively navigated the Covid-19
January 2000–January 2022 pandemic, air cargo registered a
(Standard deviations from average value) stellar year in 2021, after it increased
5.00 by 7 per cent compared to 2019
4.00 owing to cost advantages compared
3.00
to the still-disrupted sea-container
shipping.
2.00
1.00 The pandemic and the 2021 recovery
0.00
created unprecedented challenges for
international trade. Logistical
-1.00
disruptions of all kinds,
-2.00
semiconductor and electrical steel
Jan-2000
Jan-2001
Jan-2002
Jan-2003
Jan-2004
Jan-2005
Jan-2006
Jan-2007
Jan-2008
Jan-2009
Jan-2010
Jan-2011
Jan-2012
Jan-2013
Jan-2014
Jan-2015
Jan-2016
Jan-2017
Jan-2018
Jan-2019
Jan-2020
Jan-2021
Jan-2022
shortages and rising commodity
prices led to broad-based shortages of
Source: Benigno et al. (2022). products, delays in delivery and
Note: The index is normalized such that a zero indicates that the soaring shipping costs in the face of
index is at its average value with positive values representing
how many standard deviations the index are above this
strong demand and health-related
average value (and negative values representing the opposite). measures to contain the pandemic. At
the time of publication, global supply
chain pressures remain high, and many observers believe that the ‘Great Supply Chain
Disruption’ will continue in 2022, though the Global Supply Chain Pressure Index, 2 albeit still
extremely high, suggests that pressures may have begun to moderate (Figure 3.3).
Business surveys also suggest that supply chain difficulties have somewhat eased at the
beginning of 2022 even though a return to normal will take time. 3 Overall, this situation could
well have long-term repercussions as large firms consider shortening their supply chains and
diversifying away from current suppliers. The war and the rising geopolitical tension
compounds this situation as many supply chains take on renewed strategic-military roles.
2
See Benigno et al. (2022).
3
IHS Markit. Why the Great Supply Chain Disruption Will Continue in 2022. News Release. 20 January 2022.
TRADE AND DEVELOPMENT REPORT UPDATE: MARCH 2022
UNCTAD Tapering in a Time of Conflict 14D. Supply shocks, conflict and inflation
1. The return of high inflation
As consumer price inflation moved sharply up from the mid-2021 onwards in the United States
and elsewhere, debate has continued over its causes, likely duration, and the appropriate policy
response. The debate has entered a new phase with the added set of price shocks from the war
in Ukraine.
Figure 4.1 Commodities and shipping prices, 1980–2022
A. Oil B. Wheat C. Gas
160 16 250
140 14
200
120 12
Dollars per bushel
Dollars per barrel
Euros per MWh
100 10
150
80 8
6 100
60
40 4
50
20 2
0 0 0
2005
2010
2015
2020
11/03/2022
1980
1985
1990
1995
2000
2005
2010
2015
2020
1980
1985
1990
1995
2000
2005
2010
2015
2020
11/03/2022
D. Lumber E. Freight
1800 25000
1600
1400 20000
1200
15000
Dollars
1000
Dollars
800
10000
600
400 5000
200
0 0
2005
2010
2015
2020
2017
2018
2019
2020
2021
11/03/2022
Source: UNCTAD secretariat calculations based on Refinitiv data.
Note: Weekly data. The indicator for oil refers to Brent crude; the one for wheat to the price of CBOT Composite; the one for
Gas to gas in the European market; the one for lumber to the price of CME Random Length Lumber; the one for
shipping to Freightos Container Index China/East Asia To North America West Coast.
On the supply side, a range of factors have combined to produce shortages and bottlenecks.
Global production and distribution were unable to adjust rapidly to the sudden surge in
expenditure, particularly for durable goods, as economies reopened. Supplies of energy and raw
materials, such as timber and metals, were unable to keep up with surging demand, and saw sharp
price increases towards the end of 2021. Global energy supplies were placed under pressure by
TRADE AND DEVELOPMENT REPORT UPDATE: MARCH 2022
UNCTAD Tapering in a Time of Conflict 15high demand in Asia, shortfalls of natural gas and reduced wind generation. War in Ukraine has
pushed some energy prices to ten-year highs along with the prices of some key commodities such
as wheat and corn. Global freight transport saw severe bottlenecks, with prices of container
shipping rising to record highs. Commodities prices have moderated somewhat since the start of
the conflict but remain substantially above pre-conflict levels (Figure 4.1).
Although raw materials supply and shipping recovered quickly, effects further down the supply
chain were more persistent: the long-standing trend toward inventory reduction made supply
chains more vulnerable, while fears of shortages led to hoarding of inputs in short supply.
Bottlenecks and supply shortages are caused not only by supply-side issues: demand has played
an important role, driven in, particular, by the shift in consumption from services to goods.
Driven by direct cash transfers, demand for goods rose sharply in the United States, exceeding
previous trends and spilling over onto global value chains. Production of key manufacturing
intermediate inputs such as semiconductors remained relatively constant during the pandemic,
but was unable to keep pace with surging demand for microchips in the production of vehicles
and consumer goods.
Also on the demand side, some have pointed to the unprecedented rise in fiscal deficits during
the pandemic, and rapid expansion of household savings and monetary aggregates in developed
countries as drivers of spending. While fiscal measures effectively supported incomes for
populations under lockdowns and pandemic restrictions, with the exception of the United
States, these did not lead to substantial increases in demand relative to pre-pandemic supply.
Prior to the outbreak of the war in Ukraine, it was expected that as supply adjusted, price
pressures would abate over the course of 2022.
Claims that excess growth in household savings and monetary aggregates are driving inflation
are not compelling either. Accumulation of cash balances in developed economies during the
pandemic is a reflection of the unequal distribution of income and work-related risks as those
in professional jobs were able to shift to working from home, while lower-paid workers in
sectors such as hospitality and personal services were faced with business closures and furlough
schemes. With hospitality sectors closed, those with protected incomes accumulated savings,
while those on lower incomes dis-saved.
Attempts to resurrect monetarist narratives about inflation driven by increases in the money supply
are not coherent. The issuance of large liabilities by the public sector in developed countries was
driven by the government deficits required to respond to the pandemic. Central bank support in the
form of bond purchase programmes converted these liabilities from bonds paying very low nominal
rates of interest into bank deposits paying zero interest. The mix between low yield debt and zero
yield deposits in the hands of the private sector may affect spending decisions marginally, but at
most this will account for a small fraction of current inflationary pressures.
The suggestion of an incipient wage-price spiral also lacks clear evidence. More hawkish
analysts point to record quit rates and widespread shortages of workers across a range of sectors
in rich countries. However, employment to prime age population ratios remain well below pre-
pandemic levels, suggesting substantial potential slack in labour forces. Beyond the current
period of post-pandemic upheaval, it is likely that unemployment rates will rise across much
of Europe and the United States by the end of 2022. There is little compelling evidence of wage
pressures in rich countries. In much of the euro area nominal pay increases are running at
TRADE AND DEVELOPMENT REPORT UPDATE: MARCH 2022
UNCTAD Tapering in a Time of Conflict 16around 2 per cent. In Italy and Japan, the figure is below 1 per cent. In the United Kingdom,
wage growth is higher, at around 5 per cent, but this comes after a decade of falling real wages;
profits margins are largely unchanged since before the pandemic. Finally, in the United States,
where household incomes have not taken the hit seen elsewhere and inflation is rising more
rapidly, nominal wage increases are running at around 5 per cent. 4 It seems more likely that a
greater part of the increase in consumer prices since 2019 can be attributed to corporations
raising their mark-ups to effectively protect the higher profits that have become a hallmark of
the current era rather than to wage costs per se. 5
For many developing countries, currency devaluation against the dollar is an important driver
of inflation: domestic currency depreciation raises the domestic price of imported goods and
therefore headline inflation measures. As the Fed and other central banks in developed
countries central banks tighten, the currencies of developing countries are likely to devalue
further. Policy tightening in the North, in response to supply-side bottlenecks, thus worsens the
problem of rising prices in developing countries.
2. How to respond?
Many developing economies have already raised interest rates from the lows reached during
the pandemic (Figure 4.2). Policy rates in Brazil, Chile and Paraguay have risen by at least five
percentage points and many countries in Eastern Europe and Western Asia have introduced
significant rate hikes. Even in those developing countries that have not raised rates during the
pandemic, policy rates are substantially higher than in developed countries.
High and rising interest rates are justified by policymakers as a response to inflation. But for
developing economies with open financial markets an important implication of rate hikes is
offering higher financial returns than advanced economies. As policy tightens in these
countries, policy makers in developing economies will be placed under pressure to tighten
domestic policy in an attempt to prevent capital outflow.
Policy options for responding to current inflation can be divided into three main categories.
Some advocates of orthodox inflation targeting argue that the imbalance between supply and
demand as a result of pandemic reopening will persist for sufficiently long that inflationary
expectations become embedded or “unanchored” and risk triggering a wage-price spiral.
Monetary policy should therefore be tightened rapidly to tame expectations and wage demands
and avoid the need for more aggressive action in the future. There is little evidence to support
this view. The claim that expectations drive inflation is driven more by the needs of
mathematical modelling than by evidence.
The second possible response is advocated by those who favour orthodox inflation targeting
but who regard inflation as driven by transitory supply-side factors. This was the dominant
view in central banking circles until the recent shift to a more hawkish stance. The problem
4
The Economist (2022). “Labour v capital in the post-lockdown economy”, 19 February.
5
The Economist (2021). “How America Inc is coping with rising inflation”, 12 June.
TRADE AND DEVELOPMENT REPORT UPDATE: MARCH 2022
UNCTAD Tapering in a Time of Conflict 17with this “wait and see” approach is that it offers nothing to support those who face lower real
incomes as a result of rising food and fuel prices.
Figure 4.2 Policy interest rates
(Pandemic minimum and current rates)
Minimum and current rates, Absolute change
(Per cent) (Percentage points)
Russian Federation
Angola
Ghana
Turkey
Kazakhstan
Tajikistan
Moldova, Republic of
Brazil
Georgia
Ukraine
Pakistan
Belarus
Armenia
Zambia
Kyrgyzstan
Azerbaijan
Madagascar
Sri Lanka
Mexico
Paraguay
Chile
Rwanda
Dominican Republic
Czechia
South Africa
Peru
Namibia
Eswatini
Colombia
Trinidad and Tobago
Poland
Central African CFA
Hungary
Iceland
Romania
Costa Rica
Korea, Republic of
Cambodia
New Zealand
United Kingdom
United Arab Emirates
United States
Norway
Canada
0 5 10 15 20 0 4 8 12
Most recent Pandemic minimum
Source: UNCTAD secretariat calculations based on Refinitiv data.
Note: Policy rates as of 17 March 2022.
The third approach is to recognize that interest rates are not the appropriate tool to use in
response to sharp supply-side shocks. Higher interest rates will reduce the real incomes of those
on variable rate mortgages, and raise borrowing costs for firms, particularly smaller firms with
lower profit margins. In order to generate significant reductions in total expenditure in
developed countries, monetary policy would likely need to be tightened sufficiently that an
TRADE AND DEVELOPMENT REPORT UPDATE: MARCH 2022
UNCTAD Tapering in a Time of Conflict 18economic “hard landing” results. As described above, the costs of this outcome would be borne
mostly by lower income households in rich countries and possibly in developing countries
The appropriate response is, instead, to use fiscal and administrative tools to manage the
distributional impact of higher costs of essential goods and commodities. Policy makers should
recognize that, particularly in situations of extreme stress such as the current moment, the basic
consumption needs outweigh the importance of what is, ultimately, an arbitrary price target.
Consumer price inflation indices can and should be allowed to remain historically high for the
short term, while policy tools should be deployed to minimize the costs to the most vulnerable.
In real terms, the FAO food price index reached levels in early 2022 which have only been
surpassed in the aftermath of the 1973 oil shock (Figure 4.3). Cereals, including maize and
wheat jumped sharply in the last year, and have moved higher again as a result of war in
Ukraine: together, the Russian Federation and Ukraine account for over a quarter of global
wheat exports, on which many countries in Africa and the Middle East are heavily dependent.
Natural gas and oil prices have increased. In both rich countries and lower and middle-income
countries, it is entirely reasonable to use a combination of price caps, quotas and subsidies to
assist with the provision of basic needs.
Price controls are already widely
Figure 4.3 FAO real food price index, 1961–2022 used in many developing countries,
(Index numbers, average 2014–2016 = 100) particularly low-income countries, on
food and fuels. Many advanced
140 economies implement price caps on a
130 range of items, particularly utilities
120 and energy. While such interventions
cannot mitigate supply-side shortages
110
and falling real incomes, they can
100
affect the distribution of costs among
90 the population so those better able to
80 afford reductions in income and
70 consumption take a greater share of
60
the burden.
2022
1961
1971
1981
1991
2001
2021
2011
Over the longer run, the only
effective response to recurrent
supply-side shortages driven by
Source: Food and Agriculture Organization (FAO). increasingly frequent climate-related
Note: The Food and Agriculture Organization annual average for disasters such as droughts, floods and
2022 is based on monthly data for January and February only.
wildfires is to substantially raise
investment in climate mitigation and
adaptation. As discussed in previous Reports, this will require fundamental restructuring of the
international financial system to enable developing countries to devote significant resources to
long-run investment in infrastructure, clean energy and technological upgrading.
TRADE AND DEVELOPMENT REPORT UPDATE: MARCH 2022
UNCTAD Tapering in a Time of Conflict 19E. Developing countries: common constraints, different
vulnerabilities
1. The fiscal squeeze in developing countries
In most developing countries, fiscal support in response to the pandemic amounted to a
substantially lower proportion of GDP than in developed countries. Still, developing countries
are now facing the prospect of global macroeconomic tightening in a particularly perilous
position, given substantial debt vulnerabilities. Many support schemes introduced during the
pandemic will be withdrawn just as rising food and fuel costs consume household budgets and
new pressures from the conflict in Ukraine arise, including on exchange rates and balance of
payments.
The pandemic capped a decade of growing external debt in developing countries: external debt
almost doubled from $6.5 trillion to $11.7 trillion between 2011 and 2020, rising from 41 to
69.5 per cent of GDP. 6 In 2020 alone, external debt increased by $678 billion and developing
countries transferred almost $1 trillion in debt servicing to external creditors. 7 In combination
with GDP declines and weak exports from developing countries, this accounted for an increase
of the aggregate external debt to GDP ratio of developing countries from 57.4 to 69.5 per cent,
and of the external debt to exports ratio from 176.2 to 252.6 in 2020. 8
These aggregate figures mostly relate to high-income developing countries, since these
countries accounted for 78 per cent of the developing countries’ total external debt in 2020.
Yet, this sharp increase took place across the board. The group of low-income countries, for
instance, experienced the sharpest relative increase between 2011 and 2020, as their external
debt more than doubled during this period, to reach 44 per cent of GDP in 2020. Meanwhile,
middle-income countries’ external debt reached 64 per cent of their aggregate GDP.
Developing countries’ capacity to service their external debt deteriorated during the first year
of the pandemic. The external-debt-to-export ratio increased in 121 out of 127 developing
countries for which data exist between 2019 and 2020, while in 51 countries this indicator stood
above 250 percent in 2020, which lies above the risk threshold of 240 per cent used by the IMF
for the low-income countries in its Debt Sustainability Framework (DSF).
Default episodes have so far remained confined to four countries. 9 This can be explained by a
favourable turn in external conditions following the sharp deterioration in the early months of
the pandemic, with a rapid rebound of exports, high commodity prices and renewed access to
6
UNCTAD secretariat calculations based on UNCTAD country classification.
7
Debt service payments to external creditors from developing countries excluding China and Singapore totaled $944 billion.
This total rises to $1.8 trillion if China and Singapore are included.
8
These ratios are driven partly by the slowdowns or falls in GDP and exports in 2020. The sharp deterioration in the debt to
exports ratio is partially explained by a small number of outliers. This group includes two countries in debt distress (Lebanon
and Bolivarian Republic of Venezuela), five Small Island Developing States (SIDS) (Cabo Verde, Mauritius, Sao Tome and
Principe, Jamaica and Samoa) and three low-income countries (Nepal, Sierra Leone and Gambia). These countries
experienced the largest deterioration in the debt to exports ratio amongst developing countries due to a substantial reduction of
exports. Excluding this group, the average debt to exports ratio of developing countries reached 211.4 per cent in 2020.
9
This group includes two countries which defaulted before 2020 (Bolivarian Republic of Venezuela and Lebanon) and two
countries with defaults in the aftermath of Covid-19 (Suriname and Zambia).
TRADE AND DEVELOPMENT REPORT UPDATE: MARCH 2022
UNCTAD Tapering in a Time of Conflict 20You can also read