Talking PRE-ELECTION REPORT - Tararua District Council
←
→
Page content transcription
If your browser does not render page correctly, please read the page content below

1

                                                       PREPARED FOR THE 2019 LOCAL ELECTIONS
                                                       FOR THE TARARUA DISTRICT COUNCIL

talking
PRE-ELECTION REPORT

                           k
   Enrol to vote, checat
  or update your info  g.nz
  www.elections.or AL ELECTIONS FOR
                   ON ON THE 2019 LOC
FOR MORE INFORMATI                   T OUR ELECTORAL
                   CT, PLEASE CONTAC
 THE TARARUA DISTRI            4080 OR 06 376 0110
             OFFICER ON 06 374
3
stimulate public What is a
The PER was added to Local Government Act 2002
(LGA) as one of the “Transparency, Accountability
and Financial Management” package of reforms
discussion Pre-election
in 2010 and has one very clear objective… Get
everybody talking!
Report (PER)?
More specifically, the purpose of a PER is to
“stimulate informed debate about council funding
and expenditure issues during local election
campaigns”.
Tararua District
The purpose of a pre-election
report is to provide information to
promote public discussion about the
issues facing the local authority.
SECTION 99A(4), LOCAL
GOVERNMENT ACT 2002
Welcome and Chief Executives Message
The purpose of this Pre-Election priority. We also have a significant
Report is to provide information programme of work planned for Beyond this, we are actively pursuing
to stimulate public discussion our wastewater network, including a range of opportunities that have Firstly, the LGA requires all NZ councils, namely the
about the issues facing the Tararua
District in the lead up to the local
obtaining resource consent renewals
for a number of our towns.
arisen as a result of the Provincial
Growth Fund that was established by Why is Tararua Chief Executive of all councils, to prepare a PER in the
lead up to a local election (and the next local election
government elections on 12 October
2019. The Local Government
Improving the resilience of our
Central Government in 2018. Council
has already secured funding for two District Council is on 12 October 2019).
preparing a PER?
roading network to better cope Secondly, as a council, we need to engage with our
Act 2002 requires me as Chief major projects and is investigating
with the effects of climate change communities in order to achieve the best results for
Executive to prepare this report further potential projects to submit.
continues to require increased the district. The PER enables us to demonstrate our
independently of the Mayor and We have also provided letters of
resources. This is particularly true performance over the last three years, share plans for the
Councillors. support for applications by other
in the area of emergency works next three years and discuss issues facing the district.
parties. Key dates for the
The intention of this report is to following severe weather events –
summarise Councils financial an occurrence that is continuing Another important focus for Council
2019 local elections Finally, it is hoped that better engaged communities will
impact on voter participation in local elections.
statements and forecast rates to increase in both frequency and continues to be the deepening of our
Enrolment update packs sent to
increases, as well as provide intensity. relationships with both Rangitane and 1 July
all enrolled voters.
information on key projects planned. Ngati Kahungunu. The opportunity for
Earthquake-prone buildings is
On the whole, Tararua District Council another area that Council will need
us all to further collaborate for the
Enrolment closes for printed roll.
Pre-election reports make it
is on track to deliver on the projects to increasingly focus on over the next
benefit of all that call Tararua home is People must enrol by this day easier for people to vote for
and programmes outlined in our few years. As well as addressing our
vital to our future as a district. to receive voting papers in the candidates whose priorities
2018-2028 Long Term Plan (LTP). own earthquake-prone buildings, It is my hope that this report
16 August mail. People who enrol after this align with their own.” HON RODNEY HIDE
day will have to request special
Many of our projects are in response we will begin profiling commercial will stimulate the discussion it is
voting papers from their local
to factors we have little or no properties in the district to identify designed to do and I encourage council electoral officer.
control over, i.e. increasing regulatory those that are potentially earthquake- you to seek further detail from our
pressures, mitigating the impacts of prone. documents such as our Long Term Voting documents sent by
climate change or building resilience Plan, Annual Plan, and Annual Report. 20-25 September
In our 2018-2028 LTP, we committed councils to all enrolled voters.
in both our roading and three waters
to promoting and facilitating
(wastewater, storm water and Voters are encouraged to have
economic development and we
drinking water) networks. 5 October their completed voting papers in
remain committed to this strategy.
the post by Saturday 5 October.
Kinge
We are making progress on our We are investing in activities that will
programme to upgrade our urban
water networks, including the
attract visitors to Tararua, and assist
business owners and entrepreneurs Blaf ir
Executiv
Midday Saturday
Voting closes at midday. k
Enrol to vote, checat
Chie 12 October
or update your info
sourcing, storage and treatment of to either grow their existing business
water, with Pahiatua a particular or establish new ones.
z
www.elections.org.n
AL ELECTIONS FOR
ON ON THE 2019 LOC
FOR MORE INFORMATI PLEASE CONTACT OUR
ELECTORAL
ARU A DISTRICT,
THE TAR 4080 OR 06 376 0110
OFFICER ON 06 374
5
What's in this Council's
The economy, technology and the way Council delivers services
are likely to be very different in the future. Council aims to provide
report? Strategic
leadership and affordable services that help to build strong and
resilient communities.
Direction
Council’s vision and strategic focus for the district, as disclosed in our
Long Term Plan, is:
How we've WE’LL TALK ABOUT COUNCIL’S FINANCIAL STATUS,
AS WELL AS CONFIRMING COMPLIANCE WITH OUR
performed FINANCE STRATEGY. Our Vision: “ A growing and prosperous district providing a wide range of
employment opportunities that is underpinned by highly efficient,
capable and affordable infrastructure.”
our major WE’LL PROVIDE YOU WITH DETAILS ON THE
MAJOR PROJECTS THAT WE HAVE SCHEDULED IN
projects THE NEXT THREE YEARS.
Council outcomes:
major issues WE’LL ALSO DISCUSS SOME OF THE KEY ISSUES
THAT WE FACE AS A DISTRICT AND HOW WE INTEND
The Outcomes are the link
between the Vision and the
2. PROSPEROUS ECONOMY
A strong, growing, prosperous local
4. GREAT LIFESTYLE
Recreation facilities, heritage and
facing the district TO RESPOND TO THESE NOW, AND IN THE FUTURE.
Council activities, providing the economy that attracts, welcomes public amenities that support an
focus for the groups of activities and retains businesses and outstanding lifestyle.
and performance measures in the residents. A district with a clear
5. SUSTAINABLE ENVIRONMENT
Long Term Plan. identity that promotes its lifestyle.
The district has a natural
1. EFFICIENT INFRASTRUCTURE 3. COLLABORATIVE COUNCIL environment that is protected,
Highly efficient, fit for purpose A council seen as a leader in preserved and enhanced for
and affordable rural and urban community partnerships and present and future generations.
What
The Local Government Act 2002 (LGA) sets out the minimum requirements for
content (or “disclosures”) of the Pre-Election Report (PER). infrastructure. collaboration to ensure services are
delivered in the most effective and
must be However, LGA allows reduced disclosures for chief executives of a local authority
that has an ordinarily resident population of fewer than 20,000 people. Tararua
affordable way.
in this District has an estimated 17,300 residents and has applied the reduced
disclosures.
Strategic focus:
report? The disclosures required in the 2019 Pre-Election Report for Tararua District
are summarised as follows: Council’s strategy is to continue
the focus on core infrastructure,
key reserves and recreational facilities
to aid economic development.
against the 2015–2025 Long Term
Plan strategies.
economic development, and This is seen as critical to the future
Progress against the amended
financial prudence. prosperity of the district.
strategies in the 2018–2028 Long
Information Information Information The 2018–2028 Long Term Plan
expanded the strategic priorities
This strategic focus is summarised in
the table below.
Term Plan will be reported in the
2018/19 Annual Report due out 28
Based on audited Based on Annual Based on audited to include building a resilient and
Refer to pages 14 to 25 of the 2017/18
August 2019.
Annual Reports plans long term plan connected community, and develop
Annual Report for the progress
FUNDING IMPACT STATEMENTS FUNDING IMPACT STATEMENTS FUNDING IMPACT STATEMENTS
2016/17 2018/19* 2021/22 STRATEGY 1: STRATEGY 2: STRATEGY 3:
Continued investment in Promoting and continued financial viability
SUMMARY STATEMENT OF SUMMARY STATEMENT OF SUMMARY STATEMENT OF core infrastructure to: facilitating economic through sustainable growth
FINANCIAL POSITION FINANCIAL POSITION FINANCIAL POSITION development through: and investment, including:
increase public safety on
2017/18 2019/20+ 2022/23 Council roads, footpaths, supporting and facilitating ensuring affordability;
recreation facilities, and in growth in local business;
RATES, RATE INCREASES AND RATES, RATE INCREASES AND
MAJOR PROJECTS public buildings;
BORROWING WITH QUANTIFIED LIMITS BORROWING WITH QUANTIFIED LIMITS reducing financial and
building district identity;
build resilience in water, business risk;
2023/24 wastewater, stormwater, promoting the district by
and roading networks; telling our story; financial sustainability
* The 2018/19 year is Year 1 of the 2018-2028 Long Term Plan that has been audited.
+ This is Year 2 of the Long Term Plan and, due to changes in the Local Government Act, the Annual Plan is not required to be audited. support efficient transport (long-term financial
access and digital providing business friendly health);
connectivity within the and welcoming support
district and regionally; for new residents and cost control.
businesses;
improve our environment
and meet our commitments facilitate the development
to the Manawatu River of key reserves and
Leaders’ Accord; recreational facilities
to attract (and retain)
meet legally required residents and visitors.
performance standards.
7
WHERE DO WE $ 1.34 $ 2.62 $ 1.20
SPEND YOUR 1.33
RESOURCE STRATEGY &
MANAGEMENT SERVICE CENTRES POLICY $
PUBLIC
RATES?
CONVENIENCES
2.11
ery
This summary shows where ev $
t on
$100 of your rates will be spen
Council services for the 2019/20
financial year. 11.15
$
WASTEWATER
$5.96
SUPPORT
ACTIVITIES
$ 2.68
$ 1.70 PARKS & STORMWATER &
RESERVES DRAINAGE
COMMUNITY
SUPPORT
$ 1.04
CEMETERIES $ 5.16 $ 2.81
3.34
LIBRARY
$
11.48
SWIMMING
-69C $
24.18
POOLS
$
82C
HEALTH &
SAFETY TREASURY WATER
ROADING SUPPLIES
EMERGENCY
MANAGEMENT
$ 3.44
COMMUNITY $ 5.96
5.27
BUILDINGS
39C $ REPRESENTATION
$ 2.47
ANIMAL
NOTE:
4.22
CONTROL SOLID WASTE
Figures are based on a calculation of the total
$ MANAGEMENT
FOOTPATHS
amount of rates collected for each service. Figures DISTRICT PROMOTION
may differ for individual ratepayers according to their & DEVELOPMENT
property type and values.
compare this to everyday items:
Average rates per
day for a ratepayer
in the district
7.27
$
$1.12 $4.50 $3.50 $2.20 $6.13
DAILY $2.20
LOAF OF CUP OF 2 LITRES LITRE OF HOUSEHOLD NEWSPAPER
BREAD COFFEE MILK PETROL ELECTRICITY
The targeted rate per day for Water is 83c and for Wastewater is 81c.
9
Significant
Capital Here’s a brief update on some of the
Wastewater Water supply Wastewater
Investment
major projects and programmes for the
financial years 2019/20 to 2023/24: consent leak detection and water
renewals programme supply
Council has been working to The team at Tararua Alliance network
programme to systematically survey renewals
upgrade the wastewater networks have commenced a multi-year
in towns across the district as
part of our commitment to the the water reticulation network of A significant percentage of the
Emergency Pahiatua water Pahiatua Manawatu River Leaders’ Accord
and in order to meet consent
the district. The programme will
highlight leaks in the network and
water and wastewater reticulation
network in Tararua was built over
roading works upgrade Main Street conditions set by Horizons Regional
Council. The various consent
schedule a programme for repair.
This programme will help conserve
50 years ago and is coming towards
Tararua District, like the rest of New
Zealand, is experiencing significant
Now that the water storage project
in Pahiatua is complete, Council’s
upgrade renewals are: our precious water and, when
the end of its useful life. In order to
minimise the risk of future outages
• Pahiatua – moving through a combined with our water storage across the network a programme
changes in weather patterns due focus turns to improving water This project, aiming to revitalise
mediation process and treatment projects, provide of renewals has been developed.
to climate change. As a result of quality. Pahiatua water is currently the Pahiatua Main Street, has
improved resilience in water supply Council is investing additional
increased frequency and intensity drawn from both a bore and the progressed significantly over the • Eketahuna – consent currently
for residents. resources in this programme
of these weather events we are Mangatainoka River as the bore is last year. We have consulted with under appeal with the
the community on three separate environment court that will see old cast iron and/or
having to undertake increasing insufficient to meet demand. The asbestos cement pipes replaced
amounts of emergency works to water drawn from the river poses occasions to hear what they • Woodville – being publicly
want for the future of their town. with modern alternatives.
keep roads operating following each quality challenges for Council and is notified
storm event. Not only does this what is causing current odour, taste During this consultation period
• Norsewood – commencing
divert staff from other planned road and discolouration issues. we developed a series of possible
application process
works, it also adds additional cost options for consideration and
As a result Council will need to collected feedback on each one. We • Pongaroa – commencing
to the total roading budget. Where
invest in more sophisticated were delighted with both the level application process Many of our projects are in
possible we are undertaking work
to minimise the impact of these
treatment equipment to deal with of engagement from the community A key feature of wastewater response to factors we have
storm events, such as removing
these issues. It is important we get and the overall satisfaction consent renewals is the little or no control over…
the right treatment option and this expressed for the proposed design requirement to adhere to increased
roadside trees that become hazards
means taking the time and making features. The community feedback standards, thereby improving the
during severe events. We are also
the investment to get it right. We is now being used to develop a quality of treated discharge into
constantly working to improve the
anticipate the work to build the new final detailed design in order to our environment.
design of our roads to lessen the
treatment plant will be completed commence construction. Once
impact of these events. While we
during this Annual Plan period. completed, the centre of Pahiatua
can mitigate the impact of these
events to some extent, we are will be a gathering space for locals
forecasting ever increasing capital and an attraction to encourage
and operating costs in this area. visitors to stop.
Wastewater there are a number of leaks and
areas impacted by overflowing
Network stormwater systems in periods
of wet weather. Given Council
Infiltration is undertaking a number of
Strategy wastewater treatment upgrades
it is important we ensure they are
Council has been undertaking designed to manage the appropriate
CCTV camera inspections of the volumes. Repairing leaks and
wastewater network across the stormwater overflows will reduce
district to better understand the the capital cost of the upgrades
condition and performance. This by reducing the volumes requiring
investigation has highlighted treatment.
that, while the network is in
reasonable overall condition,
11
Earthquake Digital External funding
strengthening network In order to maximise outcomes for • Central Energy Trust • Tourism and Trails Strategy –
of Council Council provided a commitment ratepayers while reducing costs
as much as possible, Council has
$165,000 towards upgrading
the under-veranda lighting in
this project will explore high
level opportunities to grow the
buildings to support the community led
group Connect Tararua in their
explored opportunities to seek the Pahiatua town centre. This district’s visitor market and
external funding to leverage existing, funding will enhance the safety develop a clear cycleway and
Council owns a number of efforts to improve the mobile and or attract new, investment. Council of Pahiatua for residents at night, walkway strategy.
properties that currently do digital connectivity in the district. has recently been successful in and aligns well with the wider
not meet the requirements of Connect Tararua has lobbied hard • Application support – in
attracting the following funding for Pahiatua Main Street Upgrade
the Building Act. Engineering to improve the cell phone and addition to our own successful
projects in the period ahead: project.
applications, Council has
assessments are being ordered digital connectivity for Tararua • Tourism Infrastructure Fund • Provincial Growth Fund (PGF) provided letters of support to:
for each of these buildings. As District. Their efforts appear to $102,404 to install toilets at the Council has been successful in
buildings are assessed Council will have resulted in an increase in the Mangatainoka Reserve, which securing funding for two projects • CEDA – for an application to
develop plans to undertake any number of planned cell towers from has seen a significant increase from the PGF: undertake a tourism study
remedial action required on a case one to ten, which is a significant in freedom campers. The into Te Apiti Manawatu Gorge
• Land Use Optimisation – this tourism opportunities.
by case basis. improvement. The group remain funding also included installing
project will investigate the
committed to ensuring the most solar compacting rubbish • Environment Network
opportunities to grow and
effective coverage possible from bins at Mangatainoka Reserve, Manawatu (Source to Sea) –
develop markets for four
Urban utilities the investment being made.
Waihi Falls and Akitio beach.
Solar compacting rubbish
horticulture crops in Tararua for an application to explore
social enterprise opportunities
expansion Council continues to support this
project to provide what is now
bins can reduce operating
costs significantly by requiring
District. A key consideration
for each of the crops being in the area of biodiversity along
researched is how they might the Manawatu River.
In the 2018–2028 Long Term Plan considered basic infrastructure in emptying less.
a modern world. Improving digital support farmers to meet the We are continuing to explore
Council made provision to extend • Energy Efficiency and requirements of the Horizons opportunities to attract external
the utilities network by 10 sections connectivity will be a huge enabler Conservation Authority (EECA) One Plan in order to gain funding to leverage the investments
per annum to provide for population for Tararua residents. $50,000 towards two electric resource consents. The crops made by Council as this reduces
growth. Council is currently vehicle charging stations in being researched are feijoas, funding required from ratepayers.
undertaking a project to review the Pahiatua town centre as part of hazelnuts, berries and cider
urban boundaries and infrastructure the Main Street upgrade project. apples.
requirements of Woodville,
Dannevirke and Pahiatua to provide
for anticipated population growth.
Waste services
Council adopted a new Waste recycled thereby reducing waste to ratepayers. Council also intends
Management and Minimisation landfill. Council has also altered undertaking education around
Plan 2017–2023 in December 2017. the fees and charges relating to waste minimisation to reduce the
Since then, Council has invested solid waste to ensure a user pays overall level of waste ending up in
in new glass collection containers philosophy applies rather than landfill.
that provide for glass to be fully this service being subsidised by
CAPITAL INVESTMENT
- Roading & footpaths, 3 Waters and Other
$25,000
$20,000
2,158 3,293 2,951 2,673
$15,000 2,780 3,791
5,394 4,656 3,140 2,415
6,723
6,049 5,088 3,459
$10,000
12,268 12,585 13,709
$5,000 9,437 9,947 9,580
8,136
$0
2016/17 2017/18 2018/19 2019/20 2020/21 2021/22 2022/23
Roading & footpaths 3 Waters Other
13
Financial Performance Financial
Infrastructure
Basis of There is no requirement for the Pre-
Key challenges: financial policy limits:
Preparation: Accuracy Election Report to be separately audited. As part of each 10 year Long Term RATES
However, the majority of information in
This Pre-Election Report brings of this report has already been audited,
Plan, Council is required to develop
two key strategies - Financial
Council has set limits on rates and rates increases to Local
together information previously Information either as part of the 2018–2028 Long Strategy and an Infrastructure
Government Cost Index Inflation plus 2%.
published in Council’s Long Term The following graph details the rates increases (actual and proposed)
Term Plan, or Annual Reports. Strategy.
Plan, Annual Plans, Annual Reports compared to the rates limits. Council continues to focus on
and associated summaries. It The Financial and Infrastructure delivering services in partnership and collaboration to maximise value
reflects the policies and strategies Strategies provide a framework to from rates.
contained in the 2018–2028 guide Council as it makes financial
Long Term Plan and service level and infrastructure investment
decisions of the current council at Funding Impact Statements decisions aligned to prudent,
that time. affordable and inter-generational ANNUAL RATES INCREASE
The Local Government (Rating) • The sources of funding to be equity principles. 6%
The financial information contained Act 2002 and the Local used.
in this Pre-Election Report has been The key challenges facing 5%
Government Act 2002, requires
compiled from the following sources: • The amount of funds expected Council are: 4%
each Council to prepare a
to be produced from each 3%
Funding Impact Statement • Vulnerability to natural hazards and
• The financial information for the source.
disclosing the revenue and climate change 2%
2016/17 and 2017/18 years has been financing mechanisms it • How the funds are to be 1%
extracted from the respective • Impact of changing regulations
intends to use. applied. 0%
Annual Reports, which have been • Economic and population growth 2013/14 2014/15 2015/16 2016/17 2017/18 2018/19 2019/20 2020/21 2021/22 2022/23
audited by the Auditor General; This statement is prepared in a This information can give a Actual Planned Forecast
different format to most of the quick overview of trends in rates • Changes to population
• The financial information for the other financial statements and that are used to fund different demographics Rates increase Rates Cap BERL Index
2018/19 and 2020/21 to 2022/23 essentially sets out in a single activities. • The sources and levels of funding
years has been extracted from the statement, the sources of both access
The Funding Impact Statement
2018-2028 Long Term Plan, which the operating and capital funding
should be read in conjunction • Maintaining affordability
has been audited by the Auditor for the services that Council
with Council’s Revenue and
provides. The key funding challenge means
General; and Financing Policy in Part 3 of the
The format of this statement has 2015-2025 Long Term Plan, which the level of investment required to
• The financial information for the address the strategic issues and
been prescribed in the legislation sets out Council’s policies in
year 2018/19 is extracted from the and does not have to meet opportunities has resulted in a need
respect of each source of funding
2018/19 Annual Plan. the accounting requirements. of operating and capital expenses for sustained rates increases between
The intention is that this new – i.e. the revenue and financing 3.8% and 4.3%.
format will provide a more mechanisms to be used to cover
understandable picture of what the expenses of the Council. The key infrastructure challenge
Council is spending money on is balancing the need to build
and how those expenditures are resilience and meet the increasing
funded, namely: environmental, health and safety
standards while maintaining
affordability for ratepayers.
The focu s for Coun cil in the The focus for Council in the coming
comi ng year s will be deli veri ng years will be delivering services in
k
serv ices in an effic ient and an efficient and effective manner, Enrol to vote, chec
effe ctiv e man ner, invo lving new at
or update your info nz
involving new and innovative
and inno vati ve appr oach es
www.elections.org.
approaches ensuring we maintain
ensu ring we main tain affo rdab ility. affordability.
AL ELECTIONS FOR
ON ON THE 2019 LOC
FOR MORE INFORMATI PLEASE CONTACT OUR
ELECTORAL
ARU A DISTRICT, 0110
THE TAR 374 4080 OR 06 376
OFFICER ON 06
Financial and                                                                                                                                                                                                                                                                  15

                     Infrastructure Strategies

 DEBT                                                                                                             FINANCIAL RATIOS
 Council uses both external and internal borrowing to fund the                                                    The table below shows the financial
 investments in infrastructure assets. Council mainly borrows from                                                prudence benchmark limits compared
 the Local Government Funding Agency (LGFA).                                                                      to actual and proposed limits.
 In its 2018–2028 Long Term Plan, Council has planned to undertake a
 significant capital investment programme. As a result, Council’s debt
 is projected to increase significantly from $21 million to a peak of                                             COMPARISON OF LIMITS                                                        AR 2016/17   AR 2017/18   LTP Yr 1   AP 2019/20        LTP Yr 3         LTP Yr 4         LTP Yr 5
 $41 million during the course of the Plan, which is close to Council’s                                                                                                   Limit                  2016/17      2017/18   2018/19      2019/20         2020/21          2021/22          2022/23
 current policy limits. The graphs below details Council’s debt and cash
 investments positions and the corresponding interest cost and revenue.
 However, there are strategies available to Council to increase its debt                                          RATES AFFORDABILITY BENCHMARK
 headroom. They are:
 • Re-prioritise planned projects to remain within the policy debt limits;                                        - Income Limit ($000's)                                                         22,546       23,046    23,215        23,868          24,875           25,713           26,726

 • Extend the debt limits to the limits in the LGFA covenants. The                                                - Actual or forecast Income ($000's)                                            21,838       22,309    22,884        23,879          24,674           25,612            26,611
   limits in Council’s policy is well below the LGFA covenants. These                                             - Increases Limit                                                               4.45%        5.53%     4.06%         4.30%            4.17%            4.21%            4.35%
   self-imposed lower limits are a prudent means to ensure Council
   maintains capacity to respond to unforeseen events both in the near                                            - Actual or forecast Increases                                                   1.71%       2.30%     3.95%         4.20%           3.88%            3.83%             3.93%
   and long-term future.
 • To improve liquidity by increasing the bank standby facility. Council
                                                                                                                  DEBT AFFORDABILITY:
   has a good relationships with its banks and can increase the facility
   on short notice.                                                                                               Net Debt as a percentage of total revenue               Less than 100%          34.0%        42.0%      41.0%         72.5%           77.0%           80.0%             90.0%

                                                                                                                  Net interest as a percentage of total revenue           Less than 7%             0.9%          1.1%      1.7%          1.9%            2.7%             2.8%             2.8%
 DEBT & CASH INVESTMENT POSITION                                                                                  Net interest as a percentage of annual rates income     Less than 10%             1.4%         1.9%      2.6%          3.8%            5.1%             5.5%             5.8%
                                                                                                                  (debt secured under debenture)
           50,000

           40,000                                                                                                 Liquidity (External, term debt + committed loan         Greater than 110%       175.0%       146.0%    155.0%        132.1%         128.0%            125.0%           124.0%
($)000’s

                                                                                                                  facilities + available liquid investments to existing
           30,000
                                                                                                                  external debt)
           20,000
                                                                                                                  Balanced Budget Benchmark                               Greater than 100%       102.0%       103.0%    96.6%         100.5%         102.3%            104.4%          96.9%*
           10,000
                                                                                                                  Essential Services Benchmark                            Greater than 100%       149.0%       163.0%    132.6%        144.2%          147.9%           140.7%           106.0%
                 -
                      2016/17      2017/18          2018/19        2019/20        2020/21     2021/22   2022/23
                                                                                                                  Debt Servicing Benchmark                                Less than 10%             1.4%         1.6%      2.4%          2.1%            3.3%             3.6%             4.2%

                       Total external debt                    Total cash & cash investments
                       Limit of net external debt             Net external debt
                                                                                                                                                                                                                                           * years in which Council is not compliant with limits.

 FINANCE INCOME & EXPENSE
              500

                -
($)000’s

            (500)

           (1,000)

           (1,500)
                      2016/17      2017/18          2018/19        2019/20        2020/21     2021/22   2022/23
           (2,000)

                       Finance income                         Finance cost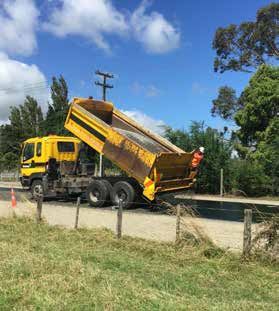
Financial
17
Statement of Cashflows Summary Statement of Financial Position
All amounts are in $,000’s 2016/17 2017/18 2018/19 2019/20 2020/21 2021/22 2022/23 All amounts are in $,000’s 2016/17 2017/18 2018/19 2019/20 2020/21 2021/22 2022/23
CASH FROM OPERATING ACTIVITIES ASSETS
Cash was provided from: Current Assets
Rates 21,065 21,652 22,885 23,878 24,617 25,560 26,557
Financial Assets 10,309 12,110 10,471 8,286 7,227 7,341 7,587
Grants & Subsidies 9,285 11,576 9,548 11,386 12,424 13,383 10,866
Other Current Assets 116 68 115 68 115 115 115
Fees, Charges and other receipts (incl Donations) 2,130 2,933 2,743 3,105 2,894 2,955 3,000
Total Current Assets 10,424 12,178 10,586 8,354 7,342 7,457 7,702
Interest received 188 202 224 80 95 40 42
Dividends and subvention payments received - - - - - - -
Other revenue 527 808 376 231 183 930 250 Non-Current Assets
Total 33,195 37,171 35,776 38,680 40,213 42,868 40,715 Other Non-Current Assets 884,096 931,969 912,360 943,601 964,487 990,386 1,013,403
Cash was applied to: Financial Assets 279 375 278 375 278 278 278
Payments to staff & suppliers 21,222 22,314 23,137 24,564 24,117 25,256 25,726
Total Non-Current Assets 884,374 932,344 912,638 943,976 964,765 990,664 1,013,681
Interest paid 513 551 830 813 1,309 1,504 1,678
GST payments - - - - - - -
Total 21,735 22,865 23,967 25,377 25,426 26,760 27,404 TOTAL ASSETS 894,798 944,522 923,223 952,329 972,108 998,122 1,021,384
Net cash inflow (outflow) form operating activities 11,460 14,306 11,810 13,303 14,786 16,107 13,310
LIABILITIES
CASH FROM INVESTING ACTIVITIES
Current Liabilities
Cash was provided from:
Other Current Liabilities 4,764 6,369 4,535 4,948 4,731 4,816 4,865
Proceeds from sale of fixed assets 191 - - - - - -
Borrowings 3,000 4,000 2,000 2,000 - 2,000 1,000
Proceeds from investments realised 6,144 2,906 250 - - (2,000) (2,000)
Total 6,513 2,906 250 - - (2,000) (2,000) Total Current Liabilities 7,765 10,369 6,535 6,948 4,731 6,816 5,865
Cash was applied to:
Purchase of fixed assets 17,028 19,629 18,316 21,383 20,192 19,521 15,452 Non-Current Liabilities
Purchase of investments 5,400 96 (2,184) (2,232) (1,706) (1,958) (1,788) Other non-current liabilities 977 1,068 1,145 1,190 1,151 1,154 1,156
Total 22,461 19,954 16,132 19,151 18,486 17,563 13,664
Borrowings 8,589 13,687 19,072 24,848 29,597 31,072 34,407
Net cash inflow (outflow) form investing activities (15,948) (17,048) (15,882) (19,151) (18,486) (19,563) (15,665)
Total Non-Current Liabilities 9,567 14,755 20,217 26,038 30,748 32,226 35,563
CASH FROM FINANCING ACTIVITIES
Cash was provided from: TOTAL LIABILITIES 17,332 25,123 26,752 32,986 35,479 39,042 41,428
Proceeds from borrowing 2,000 9,000 8,072 7,848 5,731 3,476 4,337
Tenant contributions received 89 - - - - - -
EQUITY
Total 2,089 9,000 8,072 7,848 5,731 3,476 4,337
Retained Earnings 348,461 344,809 342,466 327,476 346,048 349,663 350,131
Cash was applied to:
Other Reserves 529,005 574,591 554,004 591,866 590,582 609,418 629,826
Repayment of borrowings - 3,000 4,000 2,000 2,000 - 2,000
TOTAL EQUITY 877,466 919,400 896,470 919,342 936,630 959,081 979,957
Total 86 3,000 4,000 2,000 2,000 - 2,000
Net cash inflow (outflow) form financing activities 2,003 6,000 4,072 5,848 3,731 3,476 2,337
Net increase (decrease) in cash held (2,485) 3,258 - - 31 20 (18)
Total cash at start of the year 2,762 277 2,018 2,018 2,048 2,079 2,099
Total cash resources at end of the year 277 3,535 2,018 2,018 2,079 2,099 2,081
capital
19
Financial
funding impact statement
All amounts are in $,000’s 2016/17 2017/18 2018/19 2019/20 2020/21 2021/22 2022/23 Major Capital Projects
SOURCES OF OPERATING FUNDING The following table only lists the major projects Council has budgeted in the relevant years of the Long Term Plan
General rates, uniform annual general charges, rates 7,034 7,491 7,963 8,290 8,958 8,954 9,547 and Annual Plan.
penalties
Targeted rates (other than a targeted rate for water 14,804 14,818 14,921 15,589 15,716 16,658 17,064 All amounts are in $,000’s Total 2019/20 2020/21 2021/22 2022/23
supply) GROWTH
Subsidies and grants for operating purposes 5,084 5,266 4,181 4,424 4,231 4,586 4,746 Stormwater
Fees, charges, and targeted rates for water supply 2,347 2,324 2,743 3,105 2,894 2,955 3,000 Urban reticulation network extensions 340 85 85 85 85
Interest and dividends from investments 216 192 224 80 95 40 42 Stormwater 340 85 85 85 85
Local authorities fuel tax, fines, infringement fees, and 527 753 376 231 183 930 250
other receipts Wastewater
Total Operating Funding (A) 30,012 30,844 30,408 31,719 32,077 34,123 34,649 Wastewater reticulation network extensions 400 100 100 100 100
Wastewater 400 100 100 100 100
APPLICATIONS OF OPERATING FUNDING
Water Supplies
Payments to staff and suppliers 22,126 24,204 23,137 24,565 24,205 25,329 25,765
Water reticulation network extensions 280 70 70 70 70
Finance Costs 171 679 830 813 1,309 1,504 1,678
Water Supplies 280 70 70 70 70
Total applications of operating funding (B) 22,297 24,883 23,967 25,378 25,515 26,833 27,443
Growth Grand Total 1,020 255 255 255 255
Surplus (deficit) of operating funding (A-B) 7,715 5,961 6,442 6,341 6,561 7,290 7,206
LEVEL OF SERVICE
SOURCES OF CAPITAL FUNDING Stormwater
Subsidies and grants for capital expenditure 4,354 7,895 5,367 6,962 8,193 8,797 6,120 District Stormwater development 600 150 150 150 150
increase (decrease) in debt 1,665 (588) 4,072 5,848 3,731 3,475 2,336 Stormwater 600 150 150 150 150
Gross proceeds from sale of assets 368 - - - - - -
Wastewater
Other dedicated Capital funding - - - - - - -
Sewerage Treatment discharge to the Manawatu 309 - - - 309
Total sources of capital funding (C) 6,387 7,307 9,439 12,810 11,924 12,272 8,456
Pahiatua Wetland Development 200 200 - - -
Dannevirke Land Disposal consent 150 - - - 150
APPLICATIONS OF CAPITAL FUNDING
Pongaroa Treatment Upgrade 140 140 - - -
Capital expenditure
Wastewater 799 340 - - 459
- to meet additional demand 63 - 80 355 387 352 282
- to improve the level of service 7,992 6,949 5,662 8,898 6,746 4,756 2,272 Water Supplies
- to replace existing assets 8,908 12,851 12,574 12,130 13,058 14,413 12,898 Pahiatua Water Membrane treatment plant 2,700 2,700 - - -
Increase (decrease) in reserves (2,861) (6,532) (2,184) (2,232) (1,707) (1,959) (1,789) Water Leakage Strategy and Implementation 600 300 200 100 -
Increase (decrease) of investments - - (250) - - 2,000 2,000 Pongaroa Treatment Plant Stage 2 100 100 - - -
Total applications of capital funding (D) 14,102 13,268 15,882 19,151 18,485 19,562 15,663 Water Supplies 3,400 3,100 200 100 -
Roading & Footpaths
Surplus (deficit) of capital funding (C-D) (7,715) (5,961) (6,442) (6,341) (6,561) (7,290) (7,206)
Minor Safety Improvements 4,800 1,200 1,200 1,200 1,200
Pahiatua Main Street Upgrade 1,325 1,325 - - -
Funding Balance ((A-B)+(C-D)) - - - - - - -
Roading & Footpaths 6,125 2,525 1,200 1,200 1,200
Communites and recreations Facilities
Dannevirke Sports Centre development 250 - - 250 -
Communites and recreations Facilities 250 - - 250 -
Level of Service Grand Total 11,174 6,115 1,550 1,700 1,809CAPITAL PROJECTS
21
handy
Total 2019/20 2020/21 2021/22 2022/23
information:
RENEWAL
Wastewater
NOMINATIONS OPEN IN JULY USEFUL LINKS
Wastewater Reticulation renewals 1,800 400 400 500 500
Nominations for candidates for all available positions You can visit any of the below websites to learn more
Infiltration Strategy and Implementation 1,155 885 270 - -
(listed below) open on 19 July 2019 and close on 16 August about the 2019 Local Elections:
Wastewater 2,955 1,285 670 500 500
2019. Voting papers will be sent out from 20 September
Local Government New Zealand (LGNZ) website:
2019 and must be received by the electoral officer by
Water Supplies www.vote2019.co.nz
noon on Election Day, 12 October 2019.
Reticulation Water Mains Renewals 2,550 600 650 650 650 Information for voters and candidates about the 2019
Dannevirke Intake pipeline - No2 reservoir 1,520 - 20 750 750 For further information on the 2019 Local Elections, visit Local Elections.
www.tararuadc.govt.nz or www.vote2019.co.nz, or contact
Water Supplies 4,070 600 670 1,400 1,400 Tararua District Council website:
your local electoral officers:
www.tararuadc.govt.nz/vote2019
Roading & Footpaths Sandy Lowe Information for voters and candidates about the 2019
Drainage renewals 2,200 550 550 550 550 Electoral Officer Local Elections for the Tararua District - including
Pavement Rehabilitation 7,385 1,625 1,800 1,980 1,980 06 374 4080 or 06 376 0110 elections resources, key dates and information about
Sealed Roads Resurfacing 8,700 2,225 1,975 2250 2,250 sandy.lowe@tararuadc.govt.nz standing as a candidate.
Unsealed Road Metalling 3,520 880 880 880 880 Katrina Kerr Electoral Commission website:
Emergency Reinstatement 2,550 900 550 550 550 Deputy Electoral Officer www.elections.org.nz
06 374 4080 or 06 376 0110 Enrol to vote, check or update your enrolment details.
Footpath renewals 1,375 325 300 375 375
katrina.kerr@tararuadc.govt.nz
Bridge renewals 1,000 250 250 250 250
Carpark renewals 907 157 164 305 281 SUPPORTING DOCUMENTS
Structures Component Replacements 800 200 200 200 200 AVAILABLE POSITIONS
Tararua District Council 2018-2028 Long Term Plan:
Roading & Footpaths 28,437 7,112 6,669 7,340 7,316 Tararua District Council www.tararuadc.govt.nz/publications/plans-reports
• Mayor (1 mayor) Tararua District Council 2019/20 Annual Plan:
Communites and recreations Facilities
• Councillors - two wards www.tararuadc.govt.nz/publications/plans-reports
Pahiatua pool replacement 500 - 500 - -
North Tararua Ward (4 councillors)
Dannevirke Sports Centre Stadium renewals 213 - 40 173 - Tararua District Council 2017/18 Annual Report:
South Tararua Ward (4 councillors) www.tararuadc.govt.nz/publications/plans-reports
Communites and recreations Facilities 713 - 540 173 -
Community Board Members Tararua District Council Meetings and Agendas:
Support • Dannevirke Community Board www.tararuadc.govt.nz/publications/agendas-minutes
Pahiatua Service Centre Building 300 300 - - - (4 members)
Support 300 300 - - - • Eketahuna Community Board (4 members)
COUNCIL MEETINGS
Renewal Grand Total 36,475 9,297 8,549 9,413 9,216 Horizons Regional Council
Tararua Constituency (1 member) Tararua District Council 2019 Meetings Calendar:
www.tararuadc.govt.nz/your-council/meetings-calendar
MidCentral District Health Board
Members (7 members)
SUMMARY OF TOTAL CAPITAL EXPENDITURE Wellington Regional Council
Wairarapa Constituency - part of the Tararua District only
2016/17 2017/18 2018/19 2019/20 2020/21 2021/22 2022/23 (1 member)
Growth 63 5 80 355 387 352 282 Masterton Community Trust
Level of Service 8,018 6,238 5,662 7,478 6,747 4,757 2,273 – part of the Tararua District only (6 members)
Renewal 8,884 13,577 12,574 12,130 13,058 14,413 12,899
16,965 19,820 18,316 19,963 20,192 19,522 15,45423
glossary:
ACTIVITY The operation of a facility or GENERAL RATE The general rate OPERATIONAL EXPENDITURE All
the provision of a service. funds a range of services and is funding for providing services on a
based on: day-to-day basis, excluding renewal
ANNUAL PLAN (AP) The plan that
· land value of the property; and capital expenditure.
sets out what the council will be
working to achieve in a financial · how the property is used OPERATING FUNDING Revenue
– e.g. residential, business;
year, how it will spend its money, the received as part of day-to-day
· the location of the property
level of service to be provided, and activities. Includes user charges and
– e.g. urban, rural.
the level of rates and other revenue rates but not capital revenue (such as
required to fund that spending. SUBSIDIES AND GRANTS Revenue new loans).
received from an external agency to
ANNUAL REPORT (AR) The RATES A charge against the property
help fund an activity or service that
document that tracks the council’s to help fund services and assets that
the council provides.
yearly performance and reports the council provides.
against the relevant annual plan. GROUPS OF ACTIVITIES Council’s
TARGETED RATES A targeted rate
services are divided into eight
CAPITAL: LEVEL OF SERVICE Is the is used to fund activities where the
groups of activities based on their
creation of new assets or the addition local authority considers the cost
relationship and the rationale for
of new components to existing should be met by particular groups
providing them.
assets that extend any asset’s service of ratepayers, or that there is some
potential. INFRASTRUCTURAL ASSETS other benefit in funding these outside
Fixed utility systems that provide a the general rate.
CAPITAL: RENEWAL Is the
continuing service to the community
replacement of existing assets when SERVICE LEVELS The defined
that are not generally regarded as
they have reached the end of their service parameters or requirements
tradeable. These assets include
useful life. for a particular activity or service
North Island
roads, water and sewerage services
areas against which service
CAPITAL: GROWTH Is the creation and stormwater systems.
performance may be measured.
of new assets to meet increased
LOCAL GOVERNMENT ACT 2002 Service levels usually relate to quality,
demand.
quantity, reliability, responsiveness,
NEW ZEALAND
(LGA 2002) Refers to the Local
CCTV Closed circuit television. Government Act 2002 that defines environmental acceptability and cost.
the powers and responsibilities of
FUNDING IMPACT STATEMENT
territorial local authorities such as
(FIS) Written information that sets
the council.
out the funding mechanisms that
a local authority will use, their level, LONG TERM PLAN (LTP) A plan,
Norsewood
and the reason for their selection in covering at least 10 years, adopted
terms of the principles of financial under section 93 of the Local
management. Government Act 2002, that describes
Dannevirke
the activities the local authority will
engage in over the life of the plan,
why the local authority plans to
Woodville
engage in those activities and how
those activities will be funded.
Pahiatua Herbertville
Pongaroa
Akitio
Eketahuna
WellingtonPAHATUA SERVICE EKETAHUNA SERVICE
DANNEVIRKE SERVICE WOODVILLE SERVICE CENTRE & LIBRARY
CENTRE & LIBRARY CENTRE
CENTRE 31 Main Street, Eketahuna
136 Main Street, Pahiatua
45 Vogel St, Woodville Ph: 06 376 0219 (24 hours)
26 Gordon St, Dannevirke Ph: 06 376 0110 (24 hours)
PO Box 115, Dannevirke 4942 Ph: 06 376 0200 (24 hours) Fax: 06 376 8181
Fax: 06 376 0113
Fax: 06 376 1025
Ph: 06 374 4080 (24 hours)
Fax: 06 374 4137
INFO@TARARUADC.GOVT.NZ WWW.TARARUADC.GOVT.NZYou can also read