Taiwan's ecological footprint and overshoot day - Nature
←
→
Page content transcription
If your browser does not render page correctly, please read the page content below
www.nature.com/scientificreports
OPEN Taiwan’s ecological footprint
and overshoot day
Yung‑Jaan Lee*, Lei Chai & Po‑Shu Wu
This study examines Taiwan’s ecological footprint (EF) and its Overshoot Day from 2000 to 2018.
The latest EF calculation method is used to determine the conversion rates and equivalent factors
of bioproductive lands in each year to establish a database of Taiwan’s EF in that period. The results
reveal that Taiwan’s EF was 7.69 gha/person in 2000, dropping steadily to 6.46 gha/person in 2018.
Taiwan’s carbon footprint accounted for about 61% of Taiwan’s total EF, slightly higher than the world
average (60%). The carbon footprint as a proportion of the total EF has been increasing annually. This
study adopts social communication tools, such as the overshoot day and the earth clock, to promote
sustainable development goals and climate change policy initiatives. Global Footprint Network (GFN)
updates the overshoot day of each country in its database yearly, based on each country’s EF and
biocapacity. Since Taiwan is not included in GFN, this study adopts the same method and finds out
that Taiwan’s Overshoot Day in 2018 was March 14th, meaning that on March 14th, 2018, Taiwan
exhausted all of the biological resources that its bioproductive lands can regenerate in the year. If the
global population lived like Taiwanese, four Earths would be required to provide the resources used.
This result not only reflects the consumption of natural resources in Taiwan, but also indicates that
Taiwan should focus on sustainable development and reduce that consumption.
Ecological footprint (EF) is a widely used sustainability i ndicator1–4 to measure ecological demands of h uman5
and judge human pressures on the e cosystem6. As Ahmed et al.5 point out that human demands for ecological
resources have exceeded the biocapacity and led to overshoot, indicating that the use of the Earth’s resources
is higher than its ability to regenerate t hem2,8. It is thus suggested that it takes more than 1 year and a half to
regenerate the Earth’s resources that human consume in a y ear7. The Global Footprint Network (GFN) regularly
publishes studies that provide the EFs of 234 nations and territories around the world and updating calculation
methods and related p arameters8. As suggested, the acceleration of urbanization and industrialization has posed
new ecological security risks to metropolitan areas in low-income countries9.
Conversely, COVID-19 swept the world in 2020 and global pandemic prevention and control measures have
reduced human economic activities. According to the latest research from GFN, the COVID-19 pandemic has
resulted in a sharp fall in the global EF in 2 02010. The data reveal that the footprint associated with forest prod-
ucts has fallen by 8.4%, that associated with food remained flat (even as the population grew by 1%)11, and the
carbon footprint fell significantly by 14.5%: this was the first year in which the carbon footprint decreased since
the global financial crisis in 2008.
Taiwan’s performance in responding to and protecting against the COVID-19 pandemic in 2020 has been
relatively effective12,13. The relationship between the pandemic and the sustainability agenda should now be care-
fully reviewed14–16. Taiwan’s EF over recent years can be calculated to help to examine this relationship. Since
Taiwan is not included in the GFN, few relevant research results and data on Taiwan are available. For a long
time, Taiwan’s EF has for years been calculated by the Forestry Bureau of the Council of Agriculture to generate
a database of the country’s EF over time17.
Taiwan’s EF data are available for 2000–2011, but no systematic study of Taiwan’s EFs has been conducted
since 201218. Accordingly, the purpose of this study is to update and calculate Taiwan’s EFs from 2000 to 2018.
The latest methods are used to re-calculate Taiwan’s EFs from 2000 to 2011 and Taiwan’s EFs from 2012 to 2018
are obtained. The database of Taiwan’s EFs thus obtained enables the long-term trend of Taiwan’s EF to be tracked.
As GFN and other organizations have tracked the global EF for a long time, the EF has increasingly become
an effective indicator of sustainability. Lin et al.2 collated EF with other development indicators, such as the
Human Development Index (HDI). They pointed o ut2 that the relationship between national EF and the HDI
is convex: low EF is associated with low HDI and high EF is associated with high HDI. Does this fact imply that
almost no country can have a high HDI within the range of biological tolerance? Or may a high level of human
development come at the cost of ecological overshoot?
Chung-Hua Institution for Economic Research, Taipei, Taiwan. *email: yungjaanlee@gmail.com
Scientific Reports | (2021) 11:15068 | https://doi.org/10.1038/s41598-021-94540-7 1
Vol.:(0123456789)www.nature.com/scientificreports/
GFN and other organizations have developed other concepts for social communication. These include Over-
shoot Day, on which a region or country begins to use more than its own natural resources. After overshoot day,
the region or country is appropriating resources that will be needed in the future. Therefore, an earlier overshoot
day corresponds to less sustainable consumption and life10.
Methods and materials
EF is a sustainability monitoring indicator that has been widely used by the international community in recent
years. In 1994, Mathis Wackernagel and his Ph.D. advisor William Rees, a Canadian ecological economist,
proposed the concept of E F19. Its innovation is in shifting our understanding of sustainable development from
narrative to quantitative . Wackernagel et al.21 first calculated the EF of nations. Subsequently, Lin et al.8 pub-
20
lished the latest guidebook of GFN. The guidebook, which has been updated periodically, associated EF with
six types of bioproductive land (cropland, grazing Land, forest products, fishing grounds, built-up land, carbon
footprint), establishing an important tool for measuring progress toward sustainable development. EF can directly
or indirectly quantify the relationship between human society and the natural environment. It can also serve as
an indicator of measuring the balance between human society and ecosystem services. It reflects the impact of
human activities on the natural environment and can be used to calculate the natural resources that are made
available to humans via ecosystem s ervices3.
In practice, only the basic services for human activities have to be calculated, and double-calculation must be
avoided. The EF account is based on a calculation of the per capita consumption (Ci) of six consumption items
(i) from statistical data. To convert the six consumption values into a single value, the per capita consumption
(Ci) is divided by the average productivity (Pi) of each item (i), and the six values thus obtained are summed to
yield the EF per capita:
(1)
EF gha/person = Ci/Pi
where Ci (Per capita consumption): For a consumption item, the regional or national total weight is divided by
the total population, and the result given in units of weight, usually kilograms or tons. Pi (average productivity):
The production volume per unit area (conversion value) of a region or country. Production volume is usually
expressed in metric tons, and area is often expressed in hectares. Unified value: The bioproductive land area can
be simplified to a global hectare (gha) value.
In the calculation process, the EF must be corrected for trade and equivalent productivity to reflect (1) fre-
quent global economic and trading exchanges, including the import and export of consumer goods, (2) the fact
that the productivity of land with respect to different consumer products is not always the same. For example,
arable land is highly intensively managed and therefore has high productivity. Grassland is highly extensively
managed and therefore has low productivity. Therefore, an "equivalent correction" of the data is required, and it
is carried out using the "equivalent factor" (EQF), which is calculated as follows8.
EF of cropland, grazing land, fishing grounds and forest products (gha).
EF (i) = Total consumption (i)/Population/Bioproductivity (i) × EQF (i) (2)
The total consumption is the domestic production plus the imported amount minus the exported amount, in
tons; the bioproductivity and equivalent factors of different consumption items are different.
EF of built‑up land (gha).
EF = Built-up land area × Bioproductivity of cropland/Population × EQF (3)
The unit of built-up area is hectare. Since built-up land is assumed to have been converted from productive
cropland, calculation of the EF of built-up land assumes that the productivity and equivalent factors of the built-
up land are the same as those of the cropland.
Carbon footprint (gha).
EF = Carbon emission per capita × (1 − Ocean absorption rate)/Carbon fixation rate × EQF (4)
Carbon emission per capita is given in units of ton(s)/person; the ocean absorption rate is the proportion of
the carbon dioxide that is absorbed by the ocean that was emitted by human activities; the carbon fixation rate is
given in units of ton(s)/ha and represents the amount of carbon that can be absorbed per hectare of forest land.
The EF calculation consists of two parts. The first part determines the EF on the consumption/demand side;
the second determines the biocapacity on the production/supply side. These two values are evaluated on a par-
ticular scale (global, national or local) and are used in the basic formula for environmental sustainability, which
is Ecological Footprint (EF) − Biocapacity (BC) = Ecological Deficit (ED)17. ED reflects the over-utilization of
natural resources. A larger deficit represents greater severe over-utilization. According to the relevant statistics,
the world shifted from an ecological surplus to an ecological deficit around 19702, when the total amount of
resources consumed in human activities exceeded the environmental assimilation capacity (also known as the
self-purification capacity) of the earth. Accordingly, since 1970, we have been consuming natural resources that
should be available to future generations and increasing annual environmental impact.
Lin et al.2 reviewed global EF research from 2012 to 2018, focusing on the changes in research methods,
calculation formulas, and sources of data for determining EF during that period. The most important influence
Scientific Reports | (2021) 11:15068 | https://doi.org/10.1038/s41598-021-94540-7 2
Vol:.(1234567890)www.nature.com/scientificreports/
of the changes on the EF account was the update to the footprint calculation formula that was proposed by
Mancini et al.22.
The main purpose of this study is to calculate Taiwan’s EF and overshoot day. The updated carbon footprint
calculation formula has had a significant impact on Taiwan’s EF research—most significantly by adjusting the
carbon sequestration rate. The formula for the carbon sequestration rate is as follows.
Yc = AFCS/CCR
where Yc: annual average carbon sequestration rate per hectare of forest land. AFCS: annual average forest carbon
sequestration. CCR: carbon and carbon dioxide conversion rate, 0.2722.
In calculations of the carbon footprint before 2016, the values of AFCS were 0.97 t C ha−1 yr−1 (t: tons; C: car-
bon; ha: hectare; yr: year)22. In 2015, Mancini et al.22 revised the AFCS to 0.73 t C ha−1 yr−1 to reflect more realistic
carbon dioxide emissions and forest degeneration, and revised the carbon sequestration rate ( Yc) from 3.4 to 2.7.
In the carbon footprint calculation formula above, the carbon sequestration rate (YC) is in the denominator so a
decrease in the carbon sequestration rate increases the overall carbon footprint. Since 2016, the GFN guidebook
has used the carbon footprint calculation method as revised by Mancini et al.22. Lin et al.2 used this same new
carbon footprint calculation method to recalculate the global EF over multiple years.
Results
The results of this study are presented in several sections. The first section reviews Taiwan’s first-wave study of
EF from 2000 to 2011, and recalculates it using the latest research methods. In the second section, latest research
methods are used to update Taiwan’s EF for 2012 to 2018; the method for classifying bioproductive land that was
adopted by Lin et al.8 is used. In the third section, Taiwan’s biocapacity and ecological deficit are calculated, and
a comprehensive analysis of the ecological deficit over recent years is presented. The final section responds to the
review of EF research and social communication by Lin et al.2, calculating Taiwan’s overshoot days from 2000
to 2018. Overshoot day is one of the indicators of Taiwan’s sustainable development, and it is used herein in the
hope of communicating information related to sustainable development to members of society.
Review of EF studies from 2000 to 2011. Taiwan’s EF was calculated for the first time in 1998 using the
method of Wackernagel and Rees23, which divides bioproductive land into six major types (cropland, grazing
land, fishing grounds, forest products, energy land, and built-up land). In 1996, Taiwan’s EF was 4.67 hectares/
person. However, this value was not corrected the equivalent factor (EQF), and so was a gross underestimate. In
2005, Taiwan’s Council of Agriculture (COA) commissioned Lee and his colleagues to incorporate the equivalent
factor into the calculation of EF. They found that EF increased from 5.07 gha/person in 1994 to 5.14 gha/person
in 200324.
Since the global warming that is caused by increasing greenhouse gas emissions threatens global sustainable
development, to reflect the increase in carbon emissions that is increasing the EF value, GFN replaced the energy
land with carbon footprint. Lee24 then recalculated the EF of Taiwan for 2004, and found it to have increased
by a factor of approximately 1.3 from 5.14 to 6.72 gha (of which the carbon footprint accounted for 2.23 gha).
Wang et al.25 calculated Taiwan’s EF for 2007 as 6.54 gha. The most important changes in the EF calculation
concern the built-up land and the energy land. First, since obtaining hydropower data is difficult, the built-up
land footprint is calculated only using the areas of buildings in the built-up areas. Second, the energy land foot-
print was originally divided into “the consumer goods footprint” and "carbon footprint" but consumer goods
are complicated and difficult to handle statistically. Therefore, items related to consumer goods are excluded
from the calculation of energy land and only carbon emissions are considered. To respond to global trends in
EF calculation and to continue to track Taiwan’s EF, Lee and Peng17 calculated Taiwan’s EF for 2011, and found
it to be 9.43 gha/person, of which the carbon footprint was as high as 5.94 gha/person.
International EF research trends and the latest calculation methods are considered here. Methods of calcula-
tion of Taiwan’s EF and the results obtained using them for 2000 to 2011 are reviewed. The carbon sequestration
rate (Yc) that was applied in the carbon footprint calculation formula of Mancini et al.22 before 2016 was 3.4, but
the carbon sequestration rate ( Yc) that was used by Lee and P eng17 to calculate the carbon footprint of Taiwan
for 2000–2011 was 1.8. Substituting the corrected carbon sequestration rate into the carbon footprint calcula-
tion formula yields,
EF = Carbon emission per capita × (1 − Ocean absorption rate) × EQF/Yc (5)
The unit of carbon emission per capita is ton(s)/person. The ocean absorption rate that was calculated in 2014
was 1/417. The carbon sequestration rate was 3.420 and 1.817. This change to the different carbon sequestration
rate nearly doubled carbon footprint, increasing Taiwan’s overall EF by 2–3 global hectares/person (Table 1).
The difference in the carbon footprints that were calculated using different carbon sequestration rates explains
the value difference in the EF data from 2000 to 2011. In this study, the original data are adjusted and Taiwan’s EF
data from 2000 to 2011 are revised accordingly. Carbon footprint and EF are calculated using methods adopted
in international research. The revised footprints of all types of bioproductive land and the total EF in Taiwan
from 2000 to 2011 are as follows (Table 2).
Calculation of EF from 2012 to 2018. The classification method of Lin et al.8 is used to divide the EF
into six components, corresponding to cropland, grazing land, fishing grounds, forest product, built-up land,
and carbon footprint.
Scientific Reports | (2021) 11:15068 | https://doi.org/10.1038/s41598-021-94540-7 3
Vol.:(0123456789)www.nature.com/scientificreports/
EF 2000 2001 2002 2003 2004 2005
Yc = 1.8 10.47 9.39 9.76 9.98 8.95 9.64
Yc = 3.4 7.69 6.91 7.20 7.31 6.20 6.85
EF 2006 2007 2008 2009 2010 2011
Yc = 1.8 9.49 9.63 9.12 8.80 9.53 9.55
Yc = 3.4 6.63 6.73 6.35 6.19 6.73 6.70
Table 1. Impact of carbon sequestration rate on EF from 2000 to 2011 (unit: gha).
Years Cropland Grazing land Fishing grounds Forest products Built-up land Carbon footprint EF
2000 4.44 0.04 0.10 0.42 0.16 2.53 7.69
2001 3.69 0.03 0.17 0.33 0.13 2.56 6.91
2002 3.86 0.04 0.17 0.37 0.12 2.64 7.20
2003 3.80 0.04 0.18 0.42 0.13 2.74 7.31
2004 2.62 0.03 0.15 0.45 0.13 2.82 6.20
2005 3.18 0.04 0.15 0.44 0.16 2.88 6.85
2006 2.99 0.04 0.15 0.34 0.15 2.96 6.63
2007 3.02 0.03 0.17 0.38 0.15 2.98 6.73
2008 2.77 0.03 0.16 0.38 0.16 2.85 6.35
2009 2.95 0.03 0.14 0.22 0.16 2.69 6.19
2010 3.10 0.03 0.14 0.39 0.19 2.88 6.73
2011 3.01 0.03 0.16 0.38 0.19 2.93 6.70
Table 2. Taiwan’s EF from 2001 to 2011 (unit: gha).
1. Footprints of Cropland, Grazing Land, Fishing Grounds, and Forest Products
The footprints of cropland, grazing land, fishing grounds, and forest products, must be calculated separately
for each consumption item (i). The footprints of all consumption items are then summed. Cropland footprints
are components associated with cereals, potatoes, sugar and honey, seeds and oilseeds, and fruits (including
vegetables); grazing land footprints are components associated with meat and oils; fishing ground footprints are
associated only with aquatic products; forest product footprints are associated only with timber. The relevant
equation is as follows.
EF (i) = Total consumption (i)/Population/Bioproductivity (i) × EQF (i) (6)
Total consumption must be adjusted for international trade, by calculating domestic production, adding
imports and subtracting exports. Population here is the total population of Taiwan. Bioproductivity is the global
bioproductivity (conversion rate) of a certain consumption item, which is the total production of consumption
item (i) in the world divided by the area that is used to cultivate that
item (i). Different types of bioproductive
land have different equivalence factors.
2. Footprint of Built-up Land
The EF calculation assumes that built-up land was converted from cropland21. Therefore, all built-up land is
assumed to have the same bioproductivity as cropland. Therefore, the bioproductivity and equivalent factors of
built-up land are the same as those of cropland. Hence, only the built-up land area has to be calculated to obtain
the built-up land footprint.
EF = Built-up land area × Bioproductivity of cropland/Population × EQF (7)
The area of built-up
land is expressed in hectares and this land can be divided into urban land and non-urban
land. Population is the total population of Taiwan. The calculation of EF assumes that the bioproductivity and
equivalent factor of built-up land are the same as those of cropland.
3. Carbon Footprint
The carbon footprint represents the area of land that is required to absorb the C O2 that is emitted by human
activities. In calculating EF, the carbon footprint must be calculated independently to address the carbon emis-
sions that are caused by human activities. However, in calculating biocapacity, because the carbon footprint
Scientific Reports | (2021) 11:15068 | https://doi.org/10.1038/s41598-021-94540-7 4
Vol:.(1234567890)www.nature.com/scientificreports/
Land types 2012 2013 2014 2015 2016 2017 2018
Cropland 2.05 1.79 1.88 1.90 1.80 1.85 1.81
Grazing land 0.10 0.10 0.11 0.11 0.12 0.12 0.12
Fishing grounds 0.21 0.18 0.17 0.16 0.18 0.18 0.18
Forest products 0.35 0.32 0.34 0.32 0.27 0.25 0.27
Built-up land 0.19 0.19 0.19 0.19 0.19 0.19 0.19
Carbon footprint 3.71 3.71 3.79 3.79 3.84 3.93 3.89
EF total 6.61 6.30 6.48 6.47 6.40 6.51 6.46
Table 3. Footprints of six types of bioproductive land from 2012 to 2018 (unit: gha).
6.70
6.60
Global hectares (gha) per person
6.50
6.40
6.30
6.20
6.10
2012 2013 2014 2015 2016 2017 2018
Figure 1. Taiwan’s EF from 2012 to 2018.
shares the same land areas with the forest land footprint the calculation must not be double-counted. The carbon
footprint is calculated as follows.
EF = Carbon emission per capita×(1−Ocean absorption rate)/Carbon sequestration rate×EQF (8)
The unit of per capita carbon emission is ton(s)/person. The ocean absorption rate is the proportion of the
total amount of C O2 that is emitted in human activities that is absorbed by the ocean. Lin et al.8 provided the
most recently determined ocean absorption rate of 0.281. The carbon sequestration rate is expressed in ton(s)/
hectare, and it represents the amount of carbon that can be fixed per hectare of forest land. In this study, the
updated Yc = 2.722 is used in calculations. Table 3 presents the calculated EF for Taiwan from 2012 to 2018.
From 2012 to 2018, Taiwan’s EF slowly declined, although the decline in 2013 was particularly large because
of a decline in the cropland footprint, including low domestic production and e xports26. According to statistics
from the Central Weather B ureau27 of the Ministry of Transportation and Communications, warnings for nine
typhoons were issued in 2013—the largest annual number in the last decade. Therefore, the number of typhoons
might have been responsible for the low cropland production in that year, affecting the cropland footprint in that
year. The EF in 2013 was significantly lower than in the other years of interest (Fig. 1).
Taiwan’s overall EF trends from 2012 to 2018 and the various footprints (Fig. 2) reveal that carbon footprint
and cropland footprint account for a high proportion of the overall EF. From 2012 to 2018, Taiwan’s EF had
been slowly decreasing. The cropland footprint declined considerably while the carbon footprint continuously
increased. Despite the global emphasis on carbon emissions and their reduction, Taiwan’s carbon footprint
increased throughout the period of interest. Carbon reduction is a critical goal of Taiwan’s future energy and
environmental policies.
The carbon footprint is the main contributor to Taiwan’s EF; it is followed by the cropland footprint. The
cropland footprint represents about 20% of the total EF, while the carbon footprint accounts for about 61%. The
other four footprints represented small fractions of the total EF and did not change significantly.
Ecological deficit. This section compares Taiwan’s EF with global EF. It will first explain the calculation
of biocapacity, and then consider EF to obtain Taiwan’s ecological deficit. Since EF per capita is considered, it
should be divided by the total population of Taiwan to obtain the biocapacity per capita for Taiwan, as follows.
Scientific Reports | (2021) 11:15068 | https://doi.org/10.1038/s41598-021-94540-7 5
Vol.:(0123456789)www.nature.com/scientificreports/
Figure 2. Changes in the footprints of six types of bioproductive land from 2012 to 2018.
9.00
8.00
7.00
Global hectares (gha) per person
6.00
5.00
4.00
3.00
2.00
1.00
0.00
2000 2003 2006 2009 2012 2015 2018
Ecological Footprint Biocapacity Ecological Deficit
Figure 3. Changes in Taiwan’s EF, biocapacity, and ecological deficit from 2000 to 2018.
Bioproductive land area × Yield factor × EQF/Population (9)
Bioproductive land area is measured in hectares. The yield factor compares the biological productivity of a
specific consumption item (i) in a certain area with the global bioproductivity thereof as a ratio. In this study,
the yield factor is Taiwan’s bioproductivity (conversion rate) divided by the global bioproductivity (global con-
version rate). The equivalent factor and total population are as in the calculation of EF in the preceding section.
Although Taiwan’s EF remained roughly stable from 2012 to 2018, its biocapacity continued to decline,
causing Taiwan’s ecological deficit to rise. Figure 3 presents changes in Taiwan’s EF, biocapacity, and ecological
deficit from 2000 to 2018.
Overshoot day. Overshoot day is used to quantify an ecological deficit as it captures how quickly humans
are consuming the natural resources that the earth can provide in a y ear28. According to the GFN website, the
Earth Overshoot Day in 2020 was August 22, meaning that the world consumed all of the natural resources that
the earth could provide to humankind in 2020 by August 22, and through the rest of the year, it appropriated
Scientific Reports | (2021) 11:15068 | https://doi.org/10.1038/s41598-021-94540-7 6
Vol:.(1234567890)www.nature.com/scientificreports/
1 1.6
160 Earth Earths
140
Days aer Overshoot Day
120
100
80
60
40
20
0
1970
1971
1972
1973
1974
1975
1976
1977
1978
1979
1980
1981
1982
1983
1984
1985
1986
1987
1988
1989
1990
1991
1992
1993
1994
1995
1996
1997
1998
1999
2000
2001
2002
2003
2004
2005
2006
2007
2008
2009
2010
2011
2012
2013
2014
2015
2016
2017
2018
2019
2020
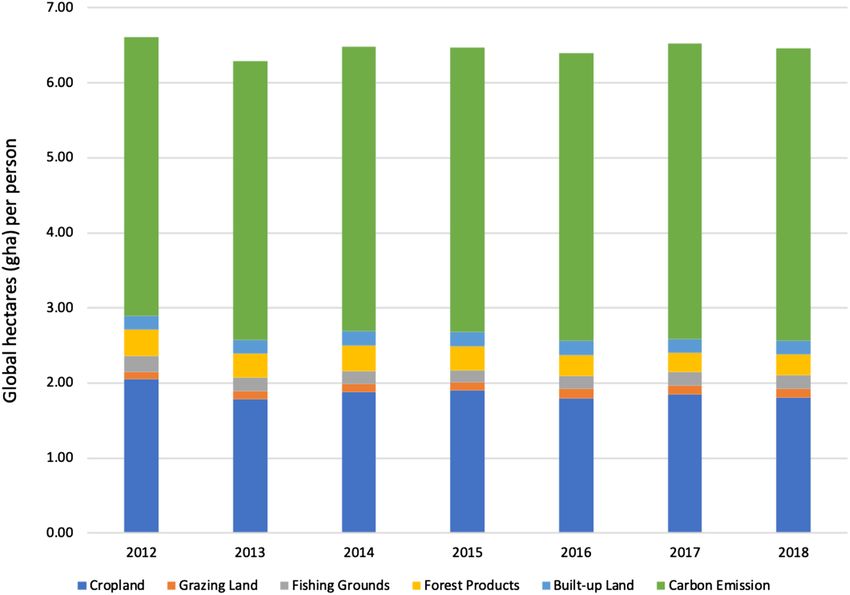
Figure 4. Earth overshoot day from 1970 to 2020. Source: Earth overshoot day (2020).
180
6/10
160
140
120
100
Days
80 3/14
60
40
20
0
1994 1997 2000 2003 2006 2009 2012 2015 2018
Figure 5. Taiwan’s overshoot day from 1994 to 2018.
future resources. Since 1970, the global overshoot day has been shifting forward (earlier) every year (Fig. 4),
meaning that humans are depleting the earth’s natural resources at an increasing rate, and that the over-con-
sumption of natural resources has become increasingly serious. As a result of the pandemic, 2020 is the year with
the latest Overshoot Day in the last decade—3 weeks later than in 2 01910. Therefore, the pandemic has reduced
the human consumption of natural resources, giving the earth some respite.
GFN updates the Overshoot Day of each country in its database yearly, based on each country’s EF and
biocapacity. Since Taiwan is not included in GFN, this study adopts the same method to calculate Taiwan’s
Overshoot Day. The calculation divides the biocapacity by EF and multiplies the result by 365 days in a year to
yield the number of days by which the ecological limit is exceeded; this number of days is then converted into
a date, as shown below.
Biocapacity/EF × 365 = Days (10)
The Overshoot Day can be used to determine whether Taiwan is moving toward sustainable development.
According to Fig. 5, the ecological Overshoot Day in Taiwan shifter earlier every year from 1994 to 2018. Taiwan’s
Overshoot Day in 1994 was June 10, and in 2018 was March 14, nearly 3 months sooner, reflecting the fact that
Taiwan is moving not toward but away from sustainability, continuing to appropriate the natural resources of
other regions or future generations.
Scientific Reports | (2021) 11:15068 | https://doi.org/10.1038/s41598-021-94540-7 7
Vol.:(0123456789)www.nature.com/scientificreports/
GFN and other, related organizations have designed websites and mobile apps that facilitate the calculation
of personal EF and personal overshoot days, so that individuals can quickly determine how quickly the earth’s
natural resources will be depleted were the world’s population to share their lifestyle. For example, if the world’s
population lived like Americans, humans would need five earths to provide the consumed natural resources28.
The US is used as a benchmark herein. The U.S.’ EF in 2018 was about 8.1 gha/person, while Taiwan’s EF in 2018
was 6.46 gha/person. Similarly, if the world’s population lived like Taiwanese, four earths would be required to
support everyone. A comparison of consumption in Taiwan with that in other major countries such as Russia,
India, Germany, and neighboring Japan, should motivate Taiwan to focus on sustainable development and reduce
its consumption of natural resources.
Discussion
This research concerns the development of recent EF research by international organizations such as GFN2,3,22,29.
The latest methods are used herein to calculate Taiwan’s EF from 2000 to 2018. Taiwan’s EF from 2000 to 2011 is
reviewed and revised based on the latest global research. Second, Taiwan’s EF data to 2018 are updated. Between
2012 and 2018, Taiwan’s EF was stable, but in 2013, fell significantly. From 2012 to 2018, Taiwan’s carbon footprint
accounted for about 61% of its overall EF, not only exceeded the international average of 60%, but also reflect-
ing the fact that Taiwan’s carbon emissions and carbon footprint are trending in the opposite direction to the
global reduction. Third, although Taiwan’s EF remained stable from 2012 to 2018, Taiwan’s ecological deficit has
continued to increase owing to a continuous reduction of biocapacity, reflecting a gradual decline in Taiwan’s
natural resources and a worsening unsustainable use of natural resources. Fourth, as one of the indicators of
sustainable development, EF must be communicated to the public in a way that they can understand and that
motivates them to make favorable changes in their everyday lives. GFN developed the Overshoot Day as a tool
for social communication. The calculations in this study indicate that Taiwan’s Overshoot Day in 2018 was March
13. On that date, Taiwan had exhausted the natural resources that its bioproductive land can provide, and spent
the remaining almost nine months appropriating the resources of other regions or future generations.
Based on this study, reducing Taiwan’s carbon emissions and carbon footprint is a critical goal of future policy.
Sustainable development policies in the areas of energy, the environment, the economy and society, and carbon
footprint reduction will be crucial. The results of this study provide a reference for future policy formulation
and implementation. Both scientific research and policy implementation must be communicated to the public.
Taiwan’s Overshoot Day, calculated in this study, is one tool for social communication.
Based on this study, a number of scientific and academic discussions should proceed in the future. These
should target the causes of the continuous increase in Taiwan’s ecological deficit, distinguished by climate zone
or location; developing EF methods that are suited to local conditions and the characteristics of different coun-
tries, climates and geographies; and obtaining first-hand information to make relevant sources of data more
complete, and accordingly, Taiwan’s EF will be able to be calculated more completely using various databases
and field surveys.
Data availability
The datasets used and analyzed during the current study are available from the corresponding author on reason-
able request.
Received: 11 April 2021; Accepted: 1 July 2021
References
1. Galli, A. et al. Assessing the ecological footprint and biocapacity of Portuguese cities: Critical results for environmental awareness
and local management. Cities 96, 102442 (2020).
2. Lin, D. et al. Ecological footprint accounting for countries: Updates and results of the National Footprint Accounts, 2012–2018.
Resources 7, 58. https://doi.org/10.3390/resources7030058 (2018).
3. Mancini, M. S. et al. Exploring ecosystem services assessment through ecological footprint accounting. Ecosyst. Serv. 30(Part B),
228–235. https://doi.org/10.1016/j.ecoser.2018.01.010 (2018).
4. Solarin, S. A. Convergence in CO2 emissions, carbon footprint and ecological footprint: Evidence from OECD countries. Environ.
Sci. Pollut. Res. 26, 6167–6181. https://doi.org/10.1007/s11356-018-3993-8 (2019).
5. Ahmed, Z., Zafar, M. W., Ali, S. & Danish. Linking urbanization, human capital, and the ecological footprint in G7 countries: An
empirical analysis. Sustain. Cities Soc. 55, 102. https://doi.org/10.1016/j.scs.2020.102064 (2020).
6. An, M. et al. The gap of water supply-demand and its driving factors: From water footprint view in Huaihe River Basin. PLoS ONE
16(3), e0247604. https://doi.org/10.1371/journal.pone.0247604 (2021).
7. Ahmed, Z. & Wang, Z. Investigating the impact of human capital on the ecological footprint in India: An empirical analysis.
Environ. Sci. Pollut. Res. 26(26), 26782–26796. https://doi.org/10.1007/s11356-019-05911-7 (2019).
8. Lin, D. et al. Working Guidebook to the National Footprint and Biocapacity Accounts 2019 (Global Footprint Network, 2019).
9. Yang, Y. & Cai, Z. Ecological security assessment of the Guanzhong Plain urban agglomeration based on an adapted ecological
footprint model. J. Clean. Prod. 260, 120973. https://doi.org/10.1016/j.jclepro.2020.120973 (2020).
10. Earth Overshoot Day. Earth Overshoot Day 2020. https://www.overshootday.org/. Accessed 11 Apr 2021.
11. UNFPA. State of World Population. https://www.unfpa.org/swop. Accessed 11 Apr 2021.
12. Summers, J. et al. Potential lessons from the Taiwan and New Zealand health responses to the COVID-19 pandemic. Lancet Reg.
Health. West. Pac. 4, 100. https://doi.org/10.1016/j.lanwpc.2020.100044 (2020).
13. Wang, C. J., Ng, C. Y. & Brook, R. H. Response to COVID-19 in Taiwan: Big data analytics, new technology, and proactive testing.
JAMA 323(14), 1341–1342. https://doi.org/10.1001/jama.2020.3151 (2020).
14. Devine-Wright, P. et al. “Re-placed”—Reconsidering relationships with place and lessons from a pandemic. J. Environ. Psychol.
72, 101514. https://doi.org/10.1016/j.jenvp.2020.101514 (2020).
15. Karaye, I. M. & Horney, J. A. The impact of social vulnerability on COVID-19 in the U.S.: An analysis of spatially varying relation-
ships. Am. J. Prev. Med. 59(3), 317–325. https://doi.org/10.1016/j.amepre.2020.06.006 (2020).
Scientific Reports | (2021) 11:15068 | https://doi.org/10.1038/s41598-021-94540-7 8
Vol:.(1234567890)www.nature.com/scientificreports/
16. Meagher, B. R. & Cheadle, A. D. Distant from others, but close to home: the relationship between home attachment and mental
health during COVID-19. J. Environ. Psychol. 72, 101516. https://doi.org/10.1016/j.jenvp.2020.101516 (2020).
17. Lee, Y. J. & Peng, L. P. Taiwan’s ecological footprint (1994–2011). Sustainability 6(9), 6170–6187. https://doi.org/10.3390/su609
6170 (2014).
18. Lee, Y. J. Land, carbon and water footprints in Taiwan. Environ. Impact Assess. Rev. 54, 1–8. https://doi.org/10.1016/j.eiar.2015.04.
004 (2015).
19. Wackernagel, M. Ecological Footprint and Appropriated Carrying Capacity: A Tool for Planning Toward Sustainability https://doi.
org/10.14288/1.0088048 (UBC, 1994).
20. Rees, W. Ecological footprints and appropriated carrying capacity: What urban economics leaves out. Environ. Urban 4(2), 121–130.
https://doi.org/10.1177/095624789200400212 (1992).
21. Wackernagel, M. et al. Ecological footprints of nations: How much nature do they use? How much nature do they have? In Com-
missioned by the Earth Council for the Rio+5 Forum (UNEP, 1997).
22. Mancini, M. S. et al. Ecological footprint: Refining the carbon footprint calculation. Ecol. Indic. 61, 390–403. https://doi.org/10.
1016/j.ecolind.2015.09.040 (2016).
23. Wackernagel, M. & Rees, W. Our Ecological Footprint: Reducing Human Impact on the Earth (New Society, 1996).
24. Lee, Y. J. Analysis and Comparison of Trends in Taiwan’s Ecological Footprint (Council of Agriculture, 2006) (in Chinese).
25. Wang, B. C., Chou, F. Y. & Lee, Y. J. Ecological footprint of Taiwan: A discussion of its implications for urban and rural sustainable
development. Comput. Environ. Urban 36(4), 342–349. https://doi.org/10.1016/j.compenvurbsys.2011.12.004 (2012).
26. Council of Agriculture, Taiwan (COA). Statistics Yearbook. https://agrstat.coa.gov.tw/sdweb/public/book/Book.aspx (COA, 2020)
(in Chinese). Accessed 11 Apr 2021.
27. Central Weather Bureau, Taiwan (CWB). Typhoon Database. https://r dc28.c wb.g ov.t w/T DB/ (CWB, 2020) (in Chinese). Accessed
11 Apr 2021.
28. Global Footprint Network (GFN). How Many Earths? https://www.footprintnetwork.org/ (GFN, 2020). Accessed 11 Apr 2021.
29. Lin, D. et al. Working Guidebook to the National Footprint Accounts 2018 (Global Footprint Network, 2018).
Acknowledgements
The authors would like to thank the Council of Agriculture of the Republic of China, Taiwan, for financially
supporting this research under contract 109 Lin Far-08.1-Bao-25 (in Chinese).
Author contributions
Prof. Y.-J.L. is responsible for the theoretical construction of ecological footprint, the development of research
methods, the literature review and the editing of the final manuscript. Mr. L.C. and Mr. P.-S.W. are responsible
for data collection, statistical analyses, and writing the first draft of the manuscript. Professor Y.-J.L., Mr. L.C.
and Mr. P.-S.W. have all read and approved the final manuscript.
Competing interests
The authors declare no competing interests.
Additional information
Correspondence and requests for materials should be addressed to Y.-J.L.
Reprints and permissions information is available at www.nature.com/reprints.
Publisher’s note Springer Nature remains neutral with regard to jurisdictional claims in published maps and
institutional affiliations.
Open Access This article is licensed under a Creative Commons Attribution 4.0 International
License, which permits use, sharing, adaptation, distribution and reproduction in any medium or
format, as long as you give appropriate credit to the original author(s) and the source, provide a link to the
Creative Commons licence, and indicate if changes were made. The images or other third party material in this
article are included in the article’s Creative Commons licence, unless indicated otherwise in a credit line to the
material. If material is not included in the article’s Creative Commons licence and your intended use is not
permitted by statutory regulation or exceeds the permitted use, you will need to obtain permission directly from
the copyright holder. To view a copy of this licence, visit http://creativecommons.org/licenses/by/4.0/.
© The Author(s) 2021
Scientific Reports | (2021) 11:15068 | https://doi.org/10.1038/s41598-021-94540-7 9
Vol.:(0123456789)You can also read