Supplement of Viscosity and phase state of aerosol particles consisting of sucrose mixed with inorganic salts
←
→
Page content transcription
If your browser does not render page correctly, please read the page content below
Supplement of Atmos. Chem. Phys., 21, 10215–10228, 2021
https://doi.org/10.5194/acp-21-10215-2021-supplement
© Author(s) 2021. CC BY 4.0 License.

Supplement of
Viscosity and phase state of aerosol particles consisting of sucrose
mixed with inorganic salts
Young-Chul Song et al.

Correspondence to: Mijung Song (mijung.song@jbnu.ac.kr)

The copyright of individual parts of the supplement might differ from the article licence.

S1. Measurements of bead speeds of particles
 Renbaum-Wolff et al. (2013a) introduced the method of the bead-mobility technique to determine
 viscosity of aerosol particles. In this study, bead speeds were measured at different relative humidity (RH)
 and then the bead speeds were converted to viscosities using a calibration line (Fig. S1). The calibration
 5 line was produced by measurement of bead speeds as a function of viscosities of sucrose/H2O particles at
 different RH. The values were fit to a power function, bead speeds (μm/ms) = ɑ × (viscosity (Pa s), η) b.
 a, b are the best-fit parameters, and used ɑ = 1.84×10⁻⁴ and b = -1.08 in this study. The values agree well
 with the previous study of Renbaum-Wolff et al. (2013a).

10
 Figure S1. A calibration line of mean bead speeds as a function of viscosities of sucrose/H2O particles at
 different RH. The red line indicates a best-fit line and pink envelopes indicate the 95% prediction bands
 of the fitting in sucrose/H2O particles. The mean bead speed error bars (on x-axis) represent the standard
 deviation from the measurements of 3-5 beads per particle at a given relative humidity.
15

 1

Figure S2 shows the mean bead speeds at different RH of sucrose/H2O (Fig. S2a), Mg(NO3)2/H2O and
 Ca(NO3)2/H2O (Fig. S2b), and sucrose/Mg(NO3)2/H2O and sucrose/Ca(NO3)2/H2O (Fig. S2c). The bead
 speeds of the sucrose/H2O particles decreased from ~9 × 10⁻⁴ to ~1 × 10⁻⁵ µm⋅ms-1 when the RH decreased
 from ~85 to ~69 % RH (Fig. S2a). In Fig. S2b, the mean bead speeds of Mg(NO3)2/H2O decreased from
20 ~5 × 10⁻² to 6×10⁻³ µm⋅ms-1 as the RH reduced from ~66 to ~35%, and the speeds of Ca(NO3)2/H2O
 decreased from 9 × 10⁻³ to 1 × 10⁻⁶ µm⋅ms-1 as the RH decreased from ~62 to ~12%. The mean bead
 speeds of sucrose/Mg(NO3)2/H2O particles decreased from ~6 × 10⁻³ to ~1 × 10⁻⁵ µm⋅ms-1 at RH ranges
 from ~68 to ~35%, and the bead speeds of the sucrose/Ca(NO3)2/H2O particles reduced from ~8 × 10⁻³ to
 ~5 × 10⁻⁶ µm⋅ms-1 as the RH decreased from ~80 to ~40% RH (Fig. S2c). These bead speeds of the
25 particles were converted to the viscosities using the calibration line shown in Fig. S1.

 2
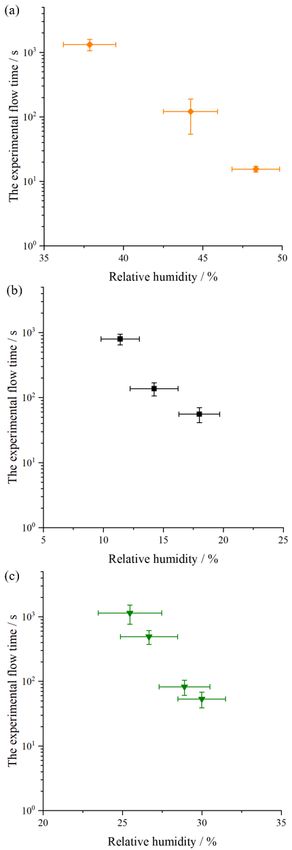
Figure S2. The bead speeds of each species as function of relative humidity (RH). (a) sucrose/H2O, (b)
 Mg(NO3)2/H2O and Ca(NO3)2/H2O, and (c) sucrose/Mg(NO3)2/H2O and sucrose/Ca(NO3)2/H2O particles.
 The x error bars indicate the uncertainty in the RH measurements. The mean bead speed error bars (on y-
30 axis) represent the standard deviation from the measurements of 3-5 beads per particle at a given RH.
 3
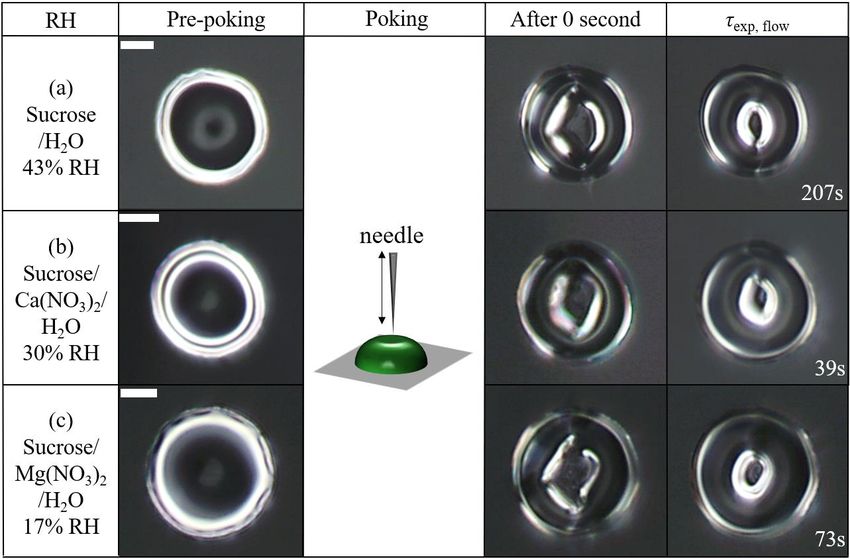
S2. Poke-and-flow experiments
 Figure S3 illustrates the optical images of sucrose/H2O, sucrose/Ca(NO3)2/H2O, and
 sucrose/Mg(NO3)2/H2O particles from pre-poking, poking, and post-poking. Using the ImageJ software,
 the area of the inner hole was calculated and the experimental flow time was determined when the area
35 decreased to 1/4 of the initial area. Figure S3 shows the experimental flow time of the sucrose/H2O
 particles at 43% RH as 207 s, sucrose/Ca(NO3)2/H2O particles at 30% RH as 39 s, and
 sucrose/Mg(NO3)2/H2O particles at 17% RH as 73 s. After the determining the experimental flow time
 (τ(exp, flow)) of the particles, the equation from Sellier et al. (2015) was applied to calculate viscosity. The
 τ(exp, flow) of the particles was converted to the lower limit to viscosity using the equation, The experimental
40 timescale (s) = 0.0032× (Viscosity (Pa s))+2.1× 10⁻⁷. For example, Fig. S3a shows an example of the
 optical images of sucrose/H2O at 43% RH. The τ(exp, flow) of this particle was 207 s, so that the lower limit
 to the dynamic viscosity was calculated as ~6×10⁴ Pa s. In this study, the upper limit to viscosity is
 unknown from the poke-and-flow technique. Figure S4a-c shows the τ(exp, flow) of sucrose/H2O,
 sucrose/Ca(NO3)2/H2O, and sucrose/Mg(NO3)2/H2O particles as function of RH.
45 In this work, the viscosities at RH where particles cracked were determined using the poke-and-flow
 technique (Renbaum-Wolff et al., 2013b; Grayson et al., 2015), based on the viscosity-value where
 secondary organic aerosol particles cracked from previous studies (Renbaum-Wolff et al., 2013b;
 Grayson et al., 2015; Song et al., 2016, 2019). Previous studies obtained the lower limit of the viscosities
 using a fluid simulation with the lower limit of physical parameters (density, contact angle, slip length,
50 and surface tension) and a fixed geometry with a quarter-sphere diameter (20 μm) which is similar what
 was observed in the poke-and-flow experiment after particles cracked (Renbaum-Wolff et al., 2013b;
 Song et al., 2016, 2019). In this study, the lower limit of contact angles for the sucrose, Ca(NO3)2 and
 Mg(NO3)2 were measured as ~72 °, ~93 °, ~93 ° for ~5 μl of each droplet deposited on a hydrophobic
 substrate. The lower limit of surface tension of sucrose, Ca(NO3)2, Mg(NO3)2 are from the literature
55 (Dutcher et al., 2010; Lee and Hildemann, 2013; Grayson et al., 2015). The lower limit of density was
 assumed to be the density of pure water. The lower limit of slip length was assumed to be 5 nm as
 described in previous work (Churaev et al., 1984; Baudry et al., 2001; Joseph and Tabeling, 2005;
 Renbaum-Wolff et al., 2013b; Li et al., 2014; Grayson et al., 2015). These lower limits of the contact

 4
angle, surface tension, density, and slip length are included as the lower limits of the physical parameters
60 that were used in previous studies employing the poke-and-flow technique (Renbaum-Wolff et al., 2013b;
 Graysong et al., 2015; Song et al., 2016, 2019). Thus, we defined the lower limit of the viscosities as ~108
 Pa s when a particle cracked during poke-and-flow experiments.

65 Figure S3. Optical images during poke-and-flow experiments at the points of pre-poking, poking, and
 post-poking for particles consisting of (a) sucrose/H2O, (b) sucrose/Ca(NO3)2/H2O, and (c)
 sucrose/Mg(NO3)2/H2O particles. The scale bar is 10 µm.

 5
70 Figure S4. The experimental flow time of each species as function of relative humidity (RH) from poke-
 and-flow experiments. (a) sucrose/H2O, (b) sucrose/Mg(NO3)2/H2O, and (c) sucrose/Ca(NO3)2/H2O
 particles. The x error bars indicate the uncertainty in the RH measurements. The y error bars indicate a
 standardization of 3 - 4 of poke-and-flow experiments at a given RH.
 6
S3. The morphologies of the particles during dehydrate cycles
75 We investigated the optical morphologies of the particles upon drying from ~100 to 0 % RH using an
 optical microscope (Olympus BX43 with 40× objective). Figure S5 presents the optical images of
 sucrose/H2O, Mg(NO3)2/H2O, Ca(NO3)2/H2O, sucrose/Ca(NO3)2/H2O, and sucrose/Mg(NO3)2/H2O
 particles during dehydration and hydrate cycles.

80
 Figure S5. Optical images of (a) sucrose/H2O, (b) Mg(NO3)2/H2O, (c) Ca(NO3)2/H2O, (d)
 sucrose/Ca(NO3)2/H2O, (e) sucrose/Mg(NO3)2/H2O particles on drying with a rate of 0.3% - 0.5% RH
 min−1. The white scale bar indicates 20 μm.

 7
85 S4. Parameterization of viscosities
 Parametrization of the RH as a function of the viscosities of the particles investigated was obtained using
 a 2nd order polynomial fit in log-scale (Fig. 4). Table S1 provides the parameterization of viscosities of
 each system.

 90 Table S1. Parametrization of viscosities of different particles. η denotes viscosity (unit: Pa s).
 System Parameterization Relative humidity
 (RH) range
 sucrose/H2O log10(Viscosity (η)) = 11.9 - 0.16×RH 24% < RH < 100%
 + 1.2×10⁻⁴×RH2
 Ca(NO3)2/H2O log10(Viscosity (η)) = 2.5 - 0.10×RH 6% < RH < 100%
 + 4.2×10⁻⁴×RH2
 Mg(NO3)2/H2O log10(Viscosity (η)) = -1.4 - 0.02×RH 31% < RH < 100%
 + 1.8×10⁻⁵×RH2
 sucrose/Ca(NO3)2/H2O log10(Viscosity (η)) = 10.4 - 0.23×RH 13% < RH < 100%
 + 9.9×10⁻⁴×RH2
 sucrose/Mg(NO3)2/H2O log10(Viscosity (η)) = 9.0 - 0.23×RH 6% < RH < 100%
 + 1.1×10⁻³×RH2

 S5. AIOMFAC-VISC with ZSR mixing rule for aqueous organic–salt systems
 The deployed mixing effects of organic and inorganic solutes on phase viscosity need to be considered
 95 with the AIOMFAC-VISC model. Different possible mixing models may be introduced. The approach
 deployed in this work is a ZSR-type mixing rule (see main text Sect. 2.4), which is briefly characterized
 in the following. The goal of our method is to split the system conceptually into a salt-free aqueous organic
 subsystem (subsystem 1) and an organic-free aqueous electrolyte subsystem (subsystem 2), such that we
 can compute the individual mixture viscosities ( 1 , 2 ) of those subsystems with AIOMFAC-VISC at the
100 same water activity (RH) as is computed by AIOMFAC for the whole mixed organic–inorganic system.
 The mixture viscosity of the full (ternary) system is then estimated using a weighted arithmetic mean of
 the logarithms of subsystem viscosities; formally,
 ln( / °) = 1 ln( 1 / °) + 2 ln( 2 / °), (S1)

 8
where 1 , 2 are weighting factors for the relative mass contributions from the subsystems, as described
105 in the following, and ° denotes unit viscosity (1 Pa s).
 In the ternary case, we can use mass conservation and describe the total mass of the system (m) as
 = + + , (S2)
 where subscripts org, el, and w denote, the organic, electrolyte (salt) and water components, respectively.
 Similarly, we can define the masses of the two subsystems, e.g. for the aqueous organic subsystem, 1 =
110 ,1 + ,1 , with subscript 1 denoting the subsystem and analogously for subsystem 2. Using a ZSR-
 type mixing rule, at any given water activity, the ternary system can be approximated as an additive
 combination of the two subsystems in terms of water content and organic and inorganic contributions.
 Here we define = ,1 and = ,2, such that we can express the organic-to-inorganic dry
 mass ratio (OIR) as
 ,1 ,1 1
115 OIR = = = . (S3)
 ,2 ,2 2

 Here, ,1 is the mass fraction of the organic (sucrose) in subsystem 1 (relative to that subsystem’s
 composition) and ,2 the mass fraction of the electrolyte (salt) in subsystem 2. We define the fractional
 contributions of masses from the two subsystems to the approximated mass of the whole system as 1 =
 1
 , hence 2 = 1 − 1 . Based on these definitions, it follows that
 1 + 2
 OIR × ,2
120 1 = . (S4)
 ,1 +OIR × ,2

 Using these weighting factors in Eq. (S1) allows for a predictive estimation of the mixture viscosity while
 ensuring that the target OIR is met. The mass fractions ,1 and ,2 result from the composition
 prediction at given water activity (equil. RH), here using the AIOMFAC model. Therefore, note that the
 values of the weights 1 , 2 , are not constant for a constant OIR; rather they must be computed at each
125 water activity level.

 9
130 References
 Baudry, J., Charlaix, E., Tonck, A., and Mazuyer, D.: Experimental evidence for a large slip effect at a
 nonwetting fluid-solid interface, Langmuir, 17, 5232–5236, doi:10.1021/La0009994, 2001.
 Churaev, N. V., Sobolev, V. D., and Somov, A. N.: Slippage of liquids over lyophobic solid-surfaces, J.
 Colloid Interf. Sci., 97, 574–581, doi:10.1016/0021-9797(84)90330-8, 1984.
135 Dutcher, C. S., Wexler, A. S. and Clegg, S. L.: Surface tensions of inorganic multicomponent aqueous
 electrolyte solutions and melts, J. Phys. Chem. A, 114(46), 12216–12230, doi:10.1021/jp105191z, 2010.
 Grayson, J. W., Song, M., Sellier, M. and Bertram, A. K.: Validation of the poke-flow technique
 combined with simulations of fluid flow for determining viscosities in samples with small volumes and
 high viscosities, Atmos. Meas. Tech., 8(6), 2463–2472, doi:10.5194/amt-8-2463-2015, 2015.
140 Joseph, P. and Tabeling, P.: Direct measurement of the apparent slip length, Phys. Rev. E., 71, 035303,
 doi:10.1103/Physreve.71.035303, 2005.
 Li, L., Mo, J. W., and Li, Z. L.: Flow and slip transition in nanochannels, Phys. Rev. E., 90, 033003,
 doi:10.1103/Physreve.90.033003, 2014.
 Lee, J. Y. and Hildemann, L. M.: Surface tension of solutions containing dicarboxylic acids with
145 ammonium sulfate, d-glucose, or humic acid, J. Aerosol Sci., 64, 94–102,
 doi:10.1016/j.jaerosci.2013.06.004, 2013.
 Renbaum-Wolff, L., Grayson, J. W. and Bertram, A. K.: Technical Note: New methodology for
 measuring viscosities in small volumes characteristic of environmental chamber particle samples, Atmos.
 Chem. Phys., 13(2), 791–802, doi:10.5194/acp-13-791-2013, 2013a.
150 Renbaum-Wolff, L., Grayson, J. W., Bateman, A. P., Kuwata, M., Sellier, M., Murray, B. J., Shilling, J.
 E., Martin, S. T. and Bertram, A. K.: Viscosity of a-pinene secondary organic material and implications
 for particle growth and reactivity, Proc. Natl. Acad. Sci., 110(20), 8014–8019,
 doi:10.1073/pnas.1219548110, 2013b.
 Sellier, M., Grayson, J. W., Renbaum-Wolff, L., Song, M. and Bertram, A. K.: Estimating the viscosity
155 of a highly viscous liquid droplet through the relaxation time of a dry spot, J. Rheol., 59(3), 733–750,
 doi:10.1122/1.4917240, 2015.

 10
Song, M., Liu, P. F., Hanna, S. J., Zaveri, R. A., Potter, K., You, Y., Martin, S. T. and Bertram, A. K.:
 Relative humidity-dependent viscosity of secondary organic material from toluene photo-oxidation and
 possible implications for organic particulate matter over megacities, Atmos. Chem. Phys., 16(14), 8817–
160 8830, doi:10.5194/acp-16-8817-2016, 2016.
 Song, M., Maclean, A. M., Huang, Y., Smith, N. R., Blair, S. L., Laskin, J., Laskin, A., DeRieux, W.-S.
 W., Li, Y., Shiraiwa, M., Nizkorodov, S. A. and Bertram, A. K.: Liquid-liquid phase separation and
 viscosity within secondary organic aerosol generated from diesel fuel vapors, Atmos. Chem. Phys., 19(19),
 12515–12529, doi:10.5194/acp-2019-367, 2019.

 11
You can also read