Supplement of Modeling silicate-nitrate-ammonium co-limitation of algal growth and the importance of bacterial remineralization based on an ...
←
→
Page content transcription
If your browser does not render page correctly, please read the page content below
Supplement of Biogeosciences, 18, 1719–1747, 2021
https://doi.org/10.5194/bg-18-1719-2021-supplement
© Author(s) 2021. This work is distributed under
the Creative Commons Attribution 4.0 License.

Supplement of
Modeling silicate–nitrate–ammonium co-limitation of algal growth and
the importance of bacterial remineralization based on an experimental
Arctic coastal spring bloom culture study
Tobias R. Vonnahme et al.

Correspondence to: Tobias R. Vonnahme (t.r.vonnahme@gmail.com) and Christoph Voelker (christoph.voelker@awi.de)

The copyright of individual parts of the supplement might differ from the CC BY 4.0 License.
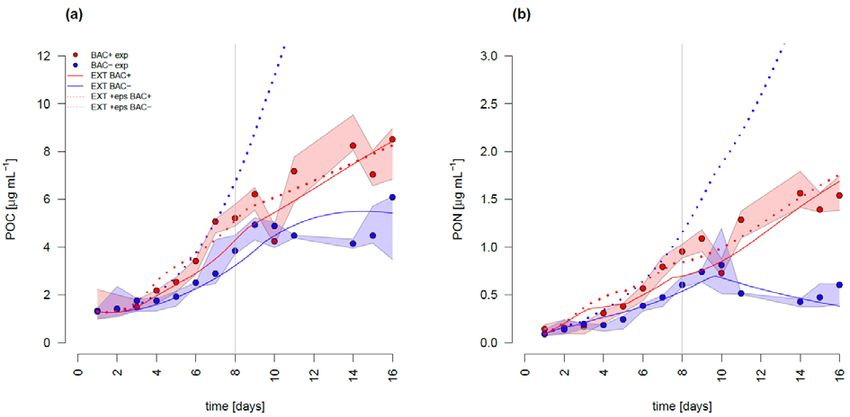
Supplementary material

Figure S1. a) POC concentrations of the measured data (circles and polygons) and model (red
and blue lines), including the original EXT model run (solid lines) and a model run showing
3% DOC aggregation to EPS as part of the POC pool (dashed line) and reduced inhibition of
photosynthesis after Si depletion (SiPS from 0.6 to 0.4). b) PON concentrations of the measured
data (circles and polygons) and model (red and blue lines), including the original EXT model
run (solid lines) and a model run showing 3% DON aggregation to EPS as part of the PON pool
(dashed line) and reduced inhibition of photosynthesis after Si depletion (SiPS from 0.6 to 0.4).
The model with EPS coagulation has an overall better fit to BAC+ (RMSEEXT=2.31,
RMSEEXT+eps=2.19), but leads to unrealistic POC and PON fits to BAC-.
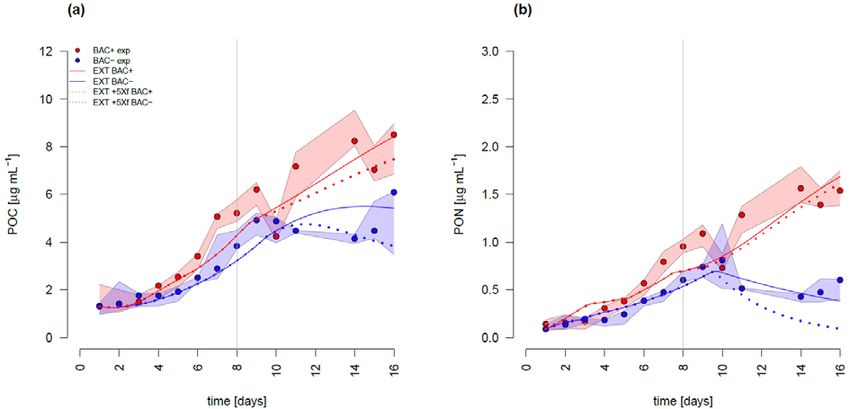
Figure S2. a) POC and b) PON concentrations of the measured data (circles and polygons) and
model (red and blue lines), including the original EXT model run (solid lines) and a model run
showing a five-fold increased DOM excretion after biofilm formation (dashed line). The
difference could be reversed by increasing the SiPS term from 0.6 to 0.8.
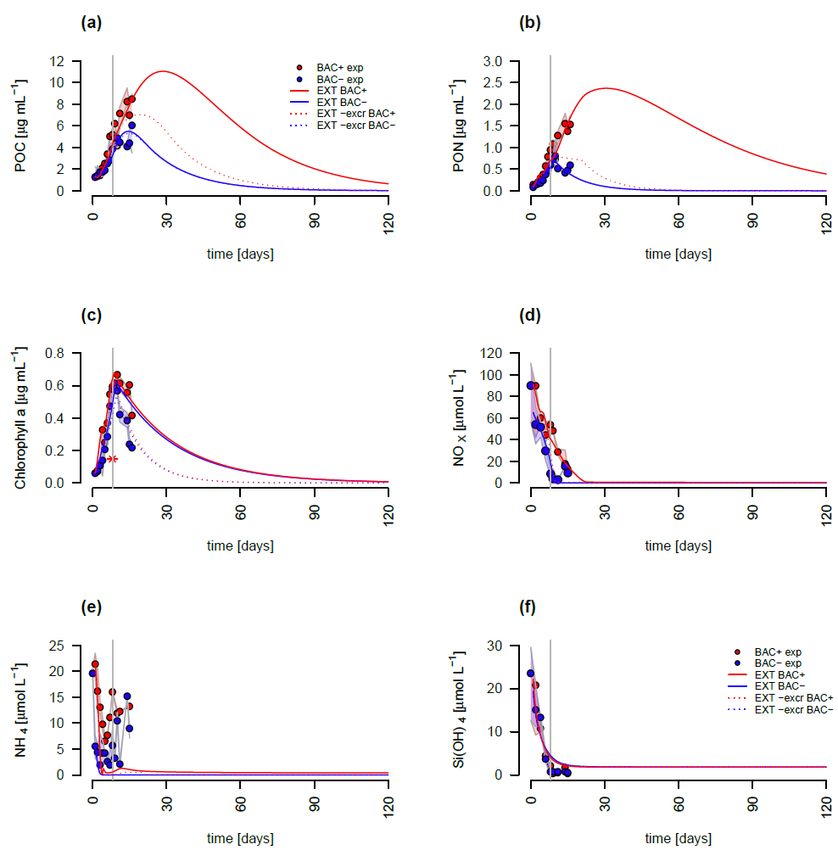
Figure S4. Model fit of the EXT model to the BAC- (blue) and BAC+ (red) experiment. Circles
show median values and the colored polygons show the minimum and maximum of the
measured data (n=3). Solid red and blue lines show the model outputs extended to 120 days of
a) POC, b) PON, c) Chl (including outlier at day 8 marked as asterisk), d) NOX, e) NH4, and f)
Silicate. The dotted line show the output of EXT without excretion.
Fig S5. Model fit of the logistic growth curve on bacterial median biomass converted to C
data (20 fg Carbon per bacterial cell).
Model tuning protocol (short version)
1. Fitting of the G98 model to the BAC- experiment
1.1. Model programming (R)
1.2. Model solving (ode function, Runge-Kutta method, deSolve package)
1.3. G98 parameter fitting on BAC- experiment
1.3.1. visual tuning (visual comparison with plots)
1.3.2. RMSE tuning (manual minimizing the RMSE Eq C2)
1.3.3. Automated tuning (FME package)
1.3.3.1. Normalize data (POC, PON & Chl x 10, DIN / 10)
1.3.3.2. Sensitivity analysis (SensFun function)
1.3.3.3. Parameter identifiability/ collinearity (Collin function)
1.3.3.4. Parameter selection (identifiable, in doubt higher sensitivity)
1.3.3.5. Automated tuning (RC, Kno3, n, and αChl, modfit function)
1.3.3.5.1. Global optimum (Pseudorandom search algorithm)
1.3.3.5.2. Local optimum (Nelder Mead algorithm)
1.3.4. Compare automated parameters with initial fit (visual & RMSE)
2. Fitting of the EXT model to the BAC+ experiment
2.1.1. Model programming (R)
2.1.2. Model solving (See 1.2)
2.1.3. EXT parameter fitting to BAC+ experiment (parameters from 1 unchanged)
2.1.3.1. Tuning of Bacterial growth parameters on bacteria (μbact, bactmax)
2.1.3.2. Tuning of Silicate parameters on silicate (Ksi, Vmax)
2.1.3.3. Tuning of remaining EXT parameters (See 1.3)
Table S1. Model extensions to represent biofilm dynamics. All equations are threshold based
after the onset of the biofilm formation.
 1) DOC and DON
 =
 aggregation as EPS

 =

 = −

 2) Increased DOM excretion = 2

xeps: fraction of excreted DOC and DON coagulating to EPS, MC: Molar mass of carbon (12 g
mol-1), xf2: DOM excretion after biofilm formation.
Table S2. Replicates for the different parameters per day and treatment (BAC- and BAC+).
Replicates used for the model plots are given as n. NH4 outliers with values over 100 µmol L-1
were removed (cell leakage due to overpressure during filtration) and are given as out. Nut
include the other nutrients measured on the nutrient analyzer (Silicate, Nitrate, Nitrite,
Phosphate). Particulate organic matter (POM) includes POC, and PON samples.
 NH4 Nut POM Chl Alg Bac
 time n out n n n n n
 BAC+
 0 2 0 3 3 3 3 0
 1 2 1 0 3 3 3 2
 2 2 1 3 3 3 3 3
 3 2 1 0 3 3 3 1
 4 2 1 3 3 3 3 3
 5 3 0 0 3 3 3 3
 6 2 0 3 3 3 3 2
 7 1 1 0 3 2 2 3
 8 2 1 3 3 3 3 2
 9 0 0 2 3 3 3 3
 10 2 1 0 3 2 2 3
 11 1 0 2 3 3 3 3
 14 0 0 3 3 2 2 1
 15 2 0 2 3 3 3 0
 16 0 0 0 3 3 3 0
 BAC-
 0 2 0 2 3 3 3 0
 1 2 0 0 3 3 3 3
 2 3 0 3 3 3 3 3
 3 3 0 0 3 3 3 3
 4 3 0 3 3 3 3 3
 5 3 0 0 3 3 3 3
 6 3 0 3 3 3 3 2
 7 3 0 0 3 2 2 3
 8 3 0 3 3 3 3 3
 9 2 0 3 3 3 3 3
 10 3 0 0 3 2 2 2
 11 3 0 3 3 3 3 2
 14 1 0 3 3 2 2 1
 15 3 0 3 3 3 3 0
 16 2 0 0 3 3 3 0
You can also read