Subscribe to our quarterly economic overview - Honkamp ...
←
→
Page content transcription
If your browser does not render page correctly, please read the page content below
Subscribe to our quarterly economic overview.
ECONOMIC AND INDUSTRY OVERVIEW | Q2 2021
I. General Economic Overview, Industry Overview and Company Outlook
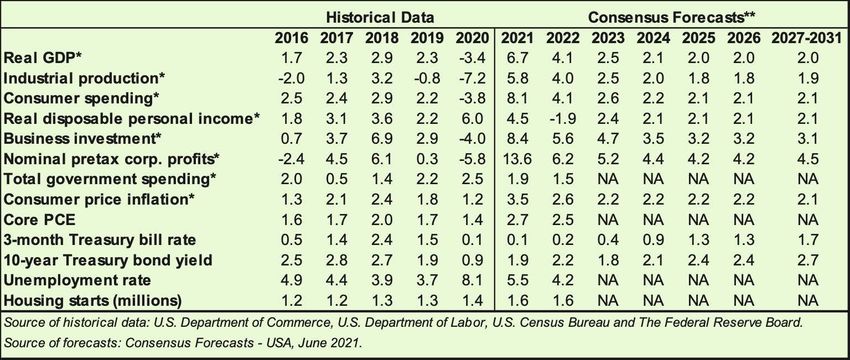
Historical Economic Data 2016 – 2020 and Forecasts 2021 – 20311
Summary of General Economic Overview – United States2
The second quarter of 2021 was defined by robust consumer demand as the economy kicks back into high gear,
as well as a struggle for domestic and global productive capacity to meet that demand. This combination saw an
increase in output, driven by record-breaking private consumption, as well as inflationary pressure. Prices,
especially manufacturing inputs, dramatically increased in Q2, partially due to productive capacity and supply
chains lagging the recovery in demand. Employment has slowed in its recovery, stubbornly trending at the 30-year
historical average. Though the country and the rest of the world are recovering, albeit at varying speeds, from the
pandemic, the economy continues to underutilize its capacity, both in the United States and abroad.
The defining economic challenge of the near term is balancing an economic recovery with inflationary pressure.
Driven by a successful vaccination rollout and economic reopening, the U.S. has seen a positive phase shift in its
recovery, particularly on the demand side, which many countries have yet to fully realize. The U.S. trade deficit,
which ballooned during the pandemic, is partially due to foreign consumption struggling to catch up.
Despite cause for optimism in the first half of 2021, we are not out of the woods yet regarding COVID-19. Major
challenges and uncertainties remain. Vaccination rates have begun to plateau, as a sizeable portion of the
population, nearly one third, has access but no interest in receiving a vaccine. This has led to a resurgence in
cases, driven as well by more virulent variants of the virus, such as the Delta and Lambda variants. The near-term
economic outlook will largely depend on the U.S. and the rest of the world’s success in inoculating its populace
from the virus while rebuilding the economy.
1
Economic Outlook Update™ 2Q 2021 published by Business Valuation Resources, LLC, © 2021. Exhibit 2A: Forecasts.
2
Economic Outlook Update™ 2Q 2021 published by TagniFi, LLC, © 2021.
HONKAMP KRUEGER & CO., P.C. 2ECONOMIC AND INDUSTRY OVERVIEW | Q2 2021
Below is a summary timeline of key COVID-19 events in the U.S. during the second quarter of 2021:
April 1, 2021 U.S. begins the quarter at 66,000 daily cases, 925 daily deaths, 30% of Americans fully vaccinated
April 8, 2021 UK variant now dominant in U.S.
April 18, 2021 Half of all U.S. adults have received 1 COVID-19 dose
April 23, 2021 States see drops in demand for COVID-19 vaccines
April 27, 2021 CDC eases mask restrictions for fully vaccinated individuals
April 29, 2021 Half of U.S. states report drops in COVID-19 cases
May 1, 2021 Cases drop to 52,000 per day, 720 deaths
May 10, 2021 Pfizer/Biontech vaccine approved for adolescents
May 10, 2021 FDA authorizes Pfizer vaccine for emergency use in adolescents
May 25, 2021 Half of American adults fully vaccinated
June 1, 2021 17,000 cases, 430 deaths per day
June 3, 2021 Initiative announced to boost vaccine rates
June 15, 2021 California becomes one of the last U.S. states to drop most Coronavirus restrictions
June 23, 2021 Delta variant concerns mount
June 25, 2021 COVID-19 deaths most common in unvaccinated
June 30, 2021 U.S. ends the quarter with 13,000 daily cases (80% reduction), 270 daily deaths (70% reduction)
In the second quarter of 2021, the U.S. economy continued to rebound from the fallout of the COVID-19 pandemic,
with emergency vaccine approvals sparking hope despite surging cases and the spread of new more contagious
variants.
By the end of the first quarter of 2021, U.S. daily case rates fell to an average 14,000 from a peak of 282,000 near
the beginning of the year. Deaths similarly fell from a high of around 3,500 per day to around 250 in late June. This
recovery surpassed expectations, fueling optimism that the recovery from the health crisis and resulting economic
shock may move ahead of schedule. However, though outside the scope of this Q2 report, we must note that July
saw cases quickly surge again, driven by the far more contagious Delta variant of the coronavirus, toward 100,000
per day. Deaths increased as well, with roughly 99% of those deaths now suffered by the unvaccinated.
The continued economic recovery hinges on America’s ability to balance public health priorities with commercial
dynamism. The best way to do that still appears to be through vaccination. However, the rate of vaccination began
to flatten in Q2, inching upward once it reached 50%. To illustrate, the percentage of the population that had
received the vaccine increased 14% in April, 6% in May, and less than 4% in June to end the quarter at 55%.
Rather than logistics or supply, the limiting factor is many Americans’ unwillingness to receive the shot. The
amount of public health and economic damage that the resurgence of COVID-19 can inflict on the U.S. will likely
depend to some extent on the rate of vaccination.
HONKAMP KRUEGER & CO., P.C. 3ECONOMIC AND INDUSTRY OVERVIEW | Q2 2021
June 2021 State Coincident Indexes: 3-Month Change
AK ME
VT NH Less than -1.0%
WA ID MT ND MN WI MI CT MA Between -0.5% and -1.0%
OR NV WY SD IA IL IN OH PA NY RI Between -0.1% and -0.5%
CA UT CO NE MO KY WV MD NJ DE Unchanged
AZ NM KS AR TN GA NC VA Between 0.1% and 0.5%
OK LA MS AL SC Between 0.5% and 1.0%
HI TX FL Greater than 1.0%
Source: TagniFi Econ
The Philadelphia Fed’s coincident index3 of economic activity in the U.S. rose 0.4% in June 2021 and 1.3% during
the second quarter. For the quarter, coincident indexes increased in 46 states and decreased in 4. Coincident
indexes reflect unemployment, payroll employment, manufacturing hours, and wages and salaries. Unemployment,
a major factor in the index, fell just 0.1% over the quarter, marking the smallest drop since the economy began
recovering from the pandemic.
The U.S. dollar index for goods and
services4 fell 1.13% during the second
quarter of 2021 and 6.57% compared to
June of 2020. The dollar’s steady fall
reflects greater risk appetite and concerns
about the ballooning American deficit, as
rising inflation expectations. Further
suppressing the dollar’s value: The U.S.
current account deficit, which has grown
every quarter since the start of 2020,
approached $200 billion in Q1.
3
Federal Reserve Bank of Philadelphia, Coincident Economic Activity Index for the United States [USPHCI], retrieved from FRED, Federal
Reserve Bank of St. Louis; https://fred.stlouisfed.org/series/USPHCI, Jul 30, 2021.
4
Board of Governors of the Federal Reserve System (U.S.), Trade Weighted U.S. Dollar Index: Broad, Goods and Services [DTWEXBGS],
retrieved from FRED, Federal Reserve Bank of St. Louis; https://fred.stlouisfed.org/series/DTWEXBGS, Jul 30, 2021.
HONKAMP KRUEGER & CO., P.C. 4ECONOMIC AND INDUSTRY OVERVIEW | Q2 2021
Economic Highlights
• Real GDP for the second quarter of 2021 grew at an annual rate of 6.5%, reaching an all-time high on
better-than-expected consumer demand.
• The U.S. dollar index fell 1.13% during the quarter and 6.63% over the last year.
• Throughout the second quarter, the effective federal funds rate stayed below 0.1%, consistent with
aggressive expansionary policy since the pandemic began.
• Short-term bond yields remained low during the quarter, and long-term yields lost some of their gains. The
10-year U.S. treasury yielded 1.45% annually at the end of June 2021 and the 30-year treasury yielded
2.06%, both down from the previous quarter.
• Unemployment fell to 5.9% in June, and nonfarm payroll employment gained 1.7 million jobs during the
second quarter.
• The Consumer Price Index rose 5.32% year-over-year, driven by higher fuel costs.
• Oil prices continued to rise during the second quarter, ending at $73.52 per barrel.
• New housing starts fell 2% compared to the first quarter but were up 44% year-over-year.
• U.S. capital markets continued to climb through the second quarter, as the VIX fell. The NASDAQ
Composite led U.S. equities at 9.5%, and the S&P 500 and Wilshire 5000 Index gained 8.2 and 8.1%,
respectively.
Business Activity
According to the Bureau of Economic
Analysis (BEA), real gross domestic
product (GDP)5 for the second quarter of
2021 grew at an annualized rate of 6.5%,
slightly higher than the first quarter’s 6.3%.
The second quarter’s growth represented
continuing recovery from the devastating
economic effects of the COVID-19
pandemic yet was well below economists’
expectations of an annualized growth rate
of 8.4%.
5
U.S. Bureau of Economic Analysis, Real Gross Domestic Product [GDPC1], retrieved from FRED, Federal Reserve Bank of St. Louis;
https://fred.stlouisfed.org/series/GDPC1, Jul 30, 2021.
HONKAMP KRUEGER & CO., P.C. 5ECONOMIC AND INDUSTRY OVERVIEW | Q2 2021
GDP growth in the second quarter
was due almost entirely to a 7.8%
annualized contribution from personal
consumption, the only component to
beat expectations. Private and
domestic investment, government
consumption and net exports all had a
slightly negative impact on GDP,
bringing annualized growth down by
1.3% between the three.
The Industrial Production Index6 is an economic
indicator that measures real output for all
facilities located in the United States
manufacturing, mining, and electric, and gas
utilities. The index stood at 100.1 at the end
of Q2, up 1.17% for the second quarter.
6
Board of Governors of the Federal Reserve System (U.S.), Industrial Production Index [INDPRO], retrieved from FRED, Federal Reserve
Bank of St. Louis; https://fred.stlouisfed.org/series/INDPRO, Jul 30, 2021.
HONKAMP KRUEGER & CO., P.C. 6ECONOMIC AND INDUSTRY OVERVIEW | Q2 2021
The Capacity Utilization Index7, which
attempts to capture industrial output as a
percentage of the economy’s maximum
production capacity, increased to 75.5%,
slowing as it approaches the pre-pandemic
level of 76.5%. The 10-year high for the
metric was 78.4% in August of 2018.
Interest Rates
The effective funds rate stayed near its
all-time low during the quarter rising slightly from
.07% to .08%, while short-term treasury rates
moved little during the quarter. Long-term treasury
bond yields, which had risen during Q4 2020 and
Q1 2021, fell slightly as COVID-19 concerns
weighed on investor sentiment and inflation
expectations continued to rise. The Fed’s upward
revision of inflation forecasts was the primary
catalyst during the quarter, while concerns that the
Delta-variant could hamper the recovery tapered
this movement. The result was a slight drop in
longer-term treasuries, while 1-year and 2-year
annual treasury yields ended the quarter
at 0.7% and 0.25%, respectively. The benchmark
10-year treasury yielded 1.45% annually at the end
of the quarter, while the 30-year treasury yielded
2.06%.
7
Board of Governors of the Federal Reserve System (U.S.), Capacity Utilization, Manufacturing (NAICS), retrieved from FRED, Federal
Reserve Bank of St. Louis; https://fred.stlouisfed.org/series/MCUMFN, Jul 30, 2021
HONKAMP KRUEGER & CO., P.C. 7ECONOMIC AND INDUSTRY OVERVIEW | Q2 2021
In the second quarter of 2020, the Federal
Reserve continued to keep the federal funds
target rate steady at a range of 0.00 to 0.25%,
stating that reducing unemployment outweighed
growing inflation as the central bank’s first
priority. The effective federal funds rate8 at the
end of Q2 was 0.08, similar to recent quarters.
The yield on the benchmark 10-year U.S.
treasury9 fell 29 basis points during the second
quarter to 1.45%, well below the average yield
of 4.16% over the last 30 years.
8
Board of Governors of the Federal Reserve System (U.S.), Effective Federal Funds Rate [FEDFUNDS], retrieved from FRED, Federal
Reserve Bank of St. Louis; https://fred.stlouisfed.org/series/FEDFUNDS, Jul 30, 2021.
9
Board of Governors of the Federal Reserve System (U.S.), 10-Year Treasury Constant Maturity Rate [DGS10], retrieved from FRED, Federal
Reserve Bank of St. Louis; https://fred.stlouisfed.org/series/DGS10, Jul 30, 2021.
HONKAMP KRUEGER & CO., P.C. 8ECONOMIC AND INDUSTRY OVERVIEW | Q2 2021
After rising every month of the first quarter,
corporate bond yields reversed and fell every
month of Q2. Moody’s Baa Corporate Bond Yield
Index10 ended the quarter at 3.32% compared to
3.77% in March. Moody’s Aaa Index moved
similarly from 3.04% to 2.63%. Starting in
March of 2020, the Federal Reserve took the
unprecedented measure of building a portfolio of
corporate bonds, effectively backstopping the
corporate bond market. Shortly after doing so,
the riskier Baa index reversed its yield spike and
began to fall lower. The move was less dramatic
for Aaa, but both markets were affected directly
by the Fed’s $13 billion portfolio, as well as by
its expansionary operations in 2020.
In early July, the Fed announced that it would
begin gradually selling off its bond holdings,
which could put near-term upward pressure on
yields, especially for the riskier Baa index. More
broadly, the Federal Reserve’s decision to actively
purchase corporate bonds marked a new frontier
for its role in capital markets.
Employment
The official unemployment rate11 saw its recovery
slow in Q2, falling marginally to 5.9%. This figure
matches the 30-year historical average but is
substantially higher than its pre-pandemic level of
3.5%. In response to stronger data, economists
surveyed by the Livingston Survey12 revised their
unemployment projections for the end of 2021 to
4.7%, down from a predicted 5.5% in December
of 2020.
10
Moody’s, Moody’s Seasoned Baa Corporate Bond Yield [BAAS], retrieved from FRED, Federal Reserve Bank of St. Louis;
https://fred.stlouisfed.org/series/BAA, Jul 30, 2021.
11
U.S. Bureau of Labor Statistics, Civilian Unemployment Rate [UNRATE], retrieved from FRED, Federal Reserve Bank of St. Louis;
https://fred.stlouisfed.org/series/UNRATE, Jul 30, 2021.
12
Federal Reserve Bank of Philadelphia, Livingston Survey,
https://www.philadelphiafed.org/surveys-and-data/real-time-data-research/livingston-survey, Jul 30, 2021.
HONKAMP KRUEGER & CO., P.C. 9ECONOMIC AND INDUSTRY OVERVIEW | Q2 2021
The U-6 unemployment rate13 is an alternative
measure of unemployment with a broader
definition, such as discouraged workers who are
not actively searching for jobs but want full-time
work and part-time workers who want full-time
work. The U-6 unemployment rate has generally
followed the same pattern as the official rate, and
has fallen in every month since April of 2020,
reaching 9.8% in June.
Nonfarm payrolls14 grew by 1.7 million jobs
in Q2 and 7.9 million compared to the same
period last year, marking a continued
rebound from the massive job losses of the
first half of 2020. The economy is still about
7 million shy of Q1 2020’s nonfarm payrolls
of 152.5 million.
13
U.S. Bureau of Labor Statistics Total Unemployed, Plus All Persons Marginally Attached to the Labor Force, Plus Total Employed Part Time
for Economic Reasons, as a Percent of the Civilian Labor Force Plus All Persons Marginally Attached to the Labor Force (U-6) [U6RATE],
retrieved from FRED, Federal Reserve Bank of St. Louis; https://fred.stlouisfed.org/series/U6RATE, Jul 30, 2021.
14
U.S. Bureau of Labor Statistics, All Employees: Total Nonfarm Payrolls [PAYEMS], retrieved from FRED, Federal Reserve Bank of St. Louis;
https://fred.stlouisfed.org/series/PAYEMS, Jul 30, 2021.
HONKAMP KRUEGER & CO., P.C. 10ECONOMIC AND INDUSTRY OVERVIEW | Q2 2021
Inflation
For the first time in many years, inflation is
squarely back on the minds of consumers and
market watchers. The Consumer Price Index15
rose 5.3% year-over-year in June, 4.5% without
food and energy prices included. Notably, the
price of a gallon of gas increased 47% in June
over the preceding year, from a national average
of $2.08 to $3.06. The Federal Reserve
acknowledged their awareness of the issue,
but did not foresee any rate hikes in the near
term. Speculation abounds over whether the
jump in inflation is transitory, driven by
rebounding demand and still-recovering
productive capacity, or more structural, driven
by government transfer payments and a large,
sustained federal deficit.
The Producer Price Index16 rose 5.6% over the
quarter to 228.5, well above the average annual
increase of 2.0% over the last 30 years. Notable
increases include gasoline at 9%, wood pallets
at 21%, and metals at 13%. The increase in
metals was largely driven by iron and steel,
which were up an average 21% between them.
15
U.S. Bureau of Labor Statistics, Consumer Price Index for All Urban Consumers: All Items [CPIAUCSL], retrieved from FRED, Federal
Reserve Bank of St. Louis; https://fred.stlouisfed.org/series/CPIAUCSL, Jul 30, 2021.
16
U.S. Bureau of Labor Statistics, Producer Price Index for All Commodities [PPIACO], retrieved from FRED, Federal Reserve Bank of St.
Louis; https://fred.stlouisfed.org/series/PPIACO, July 30, 2021.
HONKAMP KRUEGER & CO., P.C. 11ECONOMIC AND INDUSTRY OVERVIEW | Q2 2021
Treasury Inflation-Protected Securities (TIPS)
are a longer-term Treasury debt instrument
which pays a fixed interest rate but adjusts the
principal value according to inflation, effectively
indexing interest payments to inflation. TIPS
have continued to sell at a higher premium,
reflecting higher inflation expectations for the
future. The 5-year breakeven inflation rate17, an
indicator for the market’s inflation expectations
for the period, rose to 2.72% in May before
falling to 2.47%, slightly below the rate at the
start of the quarter.
U.S. crude oil18 prices rose substantially in Q2.
Crude oil prices ended the quarter at $73.52
per barrel in June 2021, up 24% from the
previous quarter. The price was driven upward
by several factors, including accelerating
demand in the U.S. and OPEC’s continued
inventory reduction.
17
Federal Reserve Bank of St. Louis, 5-Year Breakeven Inflation Rate [T5YIE], retrieved from FRED, Federal Reserve Bank of
St. Louis; https://fred.stlouisfed.org/series/T5YIE, Jul 30, 2021.
18
U.S. Energy Information Administration, Crude Oil Prices: West Texas Intermediate (WTI) – Cushing, Oklahoma [MCOILWTICO],
retrieved from FRED, Federal Reserve Bank of St. Louis; https://fred.stlouisfed.org/series/MCOILWTICO, Jul 30, 2021.
HONKAMP KRUEGER & CO., P.C. 12ECONOMIC AND INDUSTRY OVERVIEW | Q2 2021
Below we present several examples of inflation at the input level to provide an historical perspective on the recent
price spikes of some popular commodities. The charts include the global price of copper19, iron ore20, and corn21.
19
International Monetary Fund, Global Price of Copper [PCOPPUSDM], retrieved from FRED, Federal Reserve Bank of St. Louis;
https://fred.stlouisfed.org/series/PCOPPUSDM, Jul 30, 2021.
20
International Monetary Fund, Global Price of Iron Ore [PIORECRUSDM], retrieved from FRED, Federal Reserve Bank of St. Louis;
https://fred.stlouisfed.org/series/PIORECRUSDM, Jul 30, 2021.
21
International Monetary Fund, Global Price of Corn [PMAIZMTUSDM], retrieved from FRED, Federal Reserve Bank of St. Louis;
https://fred.stlouisfed.org/series/PMAIZMTUSDM, Jul 30, 2021.
HONKAMP KRUEGER & CO., P.C. 13ECONOMIC AND INDUSTRY OVERVIEW | Q2 2021
Housing
The housing market continued to show
its resilience to, and in some ways benefit
from, the economic conditions created by
COVID-19. New home starts22 ended the
quarter at 1.64 million, 25% above the
30-year average and consistent with figures
seen over roughly the past twelve months.
Single-family homebuilding continued to
surge as home demand remained strong in
suburban areas, while multi-family
construction began to rebound from a
substantial drop since the pandemic began.
Roughly 29% of housing starts were
multi-family projects, compared to 31%
and 28% on average in 2019 and 2020,
respectively.
The cost of financing for would-be
homebuyers remained near record lows
as the 30-year fixed-rate mortgage23 fell
during the quarter to 3.02%.
22
U.S. Bureau of the Census, Housing Starts: Total: New Privately Owned Housing Units Started [HOUST], retrieved from FRED, Federal
Reserve Bank of St. Louis; https://fred.stlouisfed.org/series/HOUST, Jul 30, 2021.
23
Freddie Mac, 30-Year Fixed Rate Mortgage Average in the United States [MORTGAGE30US], retrieved from FRED, Federal Reserve Bank
of St. Louis; https://fred.stlouisfed.org/series/MORTGAGE30US, Jul 30, 2021.
HONKAMP KRUEGER & CO., P.C. 14ECONOMIC AND INDUSTRY OVERVIEW | Q2 2021
The S&P Case-Shiller Home Price Index
(20-city)24 for May 2021 increased by 17%
year-over-year with Phoenix, Seattle, and
San Diego continuing to lead the nation in price
growth. Record-low mortgage rates and
constrained supply continued to push home
prices higher, a dynamic seen since the
pandemic began.
Consumer Spending
Personal Consumption Expenditures (PCE)25
soared in Q2, with June setting a record
$15.7 trillion. PCE grew 4.4% compared to
the previous quarter and 20.7% over the
same quarter last year.
24
S&P Down Jones Indices LLC, S&P/Case-Shiller 20-City Composite Home Price Index [SPCS20RSA], retrieved from FRED, Federal
Reserve Bank of St. Louis; https://fred.stlouisfed.org/series/SPCS20RSA, Jul 30, 2021.
25
U.S. Bureau of Economic Analysis, Personal Consumption Expenditures [PCE], retrieved from FRED, Federal Reserve Bank of St. Louis;
https://fred.stlouisfed.org/series/PCE, Jul 30, 2021.
HONKAMP KRUEGER & CO., P.C. 15ECONOMIC AND INDUSTRY OVERVIEW | Q2 2021
Auto manufacturers reported 15.4
million autos and light trucks sold26 in
June 2021, up 18% year over year but
down 13% from the end of the first
quarter. Coinciding with falling sales
was a nearly 4% jump in new vehicle
prices during Q2, driven by inventory
and chip shortages, to a record 154.8.
Used cars have seen an even greater
spike in prices; the relevant index27
jumped a headline-grabbing 30% in Q2
to another record of 197.23.
The University of Michigan’s consumer
sentiment index28 ended the second
quarter at 85.5, a modest rise from Q1’s
84.9 finish. During the previous 5 years,
the index regularly touched 20-year
highs around 100 before cratering to a
low of 71.8 in April of 2020, still well
above the 55.3 low of 2011. The
consumer sentiment index has been
on a general upward trend since its
April 2020 low but is still short of its 30-
year average of 87.7.
26
U.S. Bureau of Economic Analysis, Light Weight Vehicle Sales: Autos and Light Trucks [ALTSALES], retrieved from FRED, Federal Reserve
Bank of St. Louis; https://fred.stlouisfed.org/series/ALTSALES, Jul 30, 2021.
27
U.S. Bureau of Labor Statistics, Consumer Price Index for All Urban Consumers: Used Cars and Trucks in U.S. City Average
[CUSR0000SETA02], retrieved from FRED, Federal Reserve Bank of St. Louis; https://fred.stlouisfed.org/series/CUSR0000SETA02,
Jul 30, 2021.
28
University of Michigan, University of Michigan: Consumer Sentiment [UMCSENT], retrieved from FRED, Federal Reserve Bank of St. Louis;
https://fred.stlouisfed.org/series/UMCSENT, Jul 30, 2021.
HONKAMP KRUEGER & CO., P.C. 16ECONOMIC AND INDUSTRY OVERVIEW | Q2 2021
Capital Markets
The table below shows the quarterly,
year-to-date, and 12-month performance
of major U.S. equity indices. Capital
markets continued their bullish rebound
from the March 2020 crash, buoyed by
improving sentiment, encouraging
economic and vaccine data, and
bolstered by aggressive monetary and
fiscal policy. The Dow jones
Transportation Average had the smallest
increase this quarter at 1.7%, while the
tech-heavy NASDAQ and S&P 500 Index
were the highest performers at 9.5% and
8.2%, respectively.
Stock market volatility, as measured by the
VIX 29, ended the second quarter at 15.8.
It has trended downward over the last
12 months as the market outlook recovered
quickly on major government stimulus,
improving investor sentiment, and
encouraging economic data. This pattern
continued, though at a slower rate, in Q2,
ending the quarter at a new low since the
pandemic began and 18% lower than the
end of Q1.
29
Chicago Board Options Exchange, CBOE Volatility Index: VIX [VIXCLS], retrieved from FRED, Federal Reserve Bank of St. Louis;
https://fred.stlouisfed.org/series/VIXCLS, Jul 30, 2021.
HONKAMP KRUEGER & CO., P.C. 17ECONOMIC AND INDUSTRY OVERVIEW | Q2 2021
Outlook
In June 2021, the FOMC revised their inflation and real GDP growth projections upward, while expectations for
unemployment remained steady, as did longer run projections for all three indicators.
The FOMC revised their March projection for real GDP30 to 7.05% growth in 2021, slowing to 2.25% by 2023.
They expected Personal Consumption Expenditures (PCE)31 to grow 3.3% in 2021. They forecast that the
unemployment rate32 will reach to 4.6% in 2021 and 3.5% by 2023. Notably, the board projected at least two
rate hikes by the end of 2023, likely in response to the quarter’s higher than expected inflation figures.
Midwest Economy33
Summary of Economic Activity
Economic activity in the Seventh
District increased moderately in late
May and June and growth was limited
by labor and materials supply
constraints in many sectors. Contacts
expected strong growth in the coming
months. Employment increased
strongly, business spending increased
moderately, manufacturing increased
modestly, and consumer spending
and construction and real estate were
flat. Wages rose moderately while prices
rose strongly. Financial conditions
improved slightly. Prospects for agriculture
income in 2021 were little changed.
30
Federal Reserve Bank of St. Louis, FOMC Summary of Economic Projections for the Growth Rate of Real Gross Domestic Product
[GDPC1CTM], retrieved from FRED, Federal Reserve Bank of St. Louis; https://fred.stlouisfed.org/series/GDPC1CTM, Jul 30, 2021.
31
Federal Reserve Bank of St. Louis, FOMC Summary of Economic Projections for the Personal Consumption Expenditures Inflation Rate,
Central Tendency, Midpoint [PCECTPICTM], retrieved from FRED, Federal Reserve Bank of St. Louis;
https://fred.stlouisfed.org/series/PCECTPICTM, Jul 30, 2021.
32
Federal Reserve Bank of St. Louis, FOMC Summary of Economic Projections for the Civilian Unemployment Rate, Central Tendency, Midpoint
[UNRATECTM], retrieved from FRED, Federal Reserve Bank of St. Louis; https://fred.stlouisfed.org/series/UNRATECTM, Jul 30, 2021.
33
Primary Source: Federal Reserve, Beige Book – July 14, 2021, “Summary of Commentary on Current Economic Conditions” Extracted
wholly or largely verbatim and/or substantially paraphrased.
HONKAMP KRUEGER & CO., P.C. 18ECONOMIC AND INDUSTRY OVERVIEW | Q2 2021
Employment and Wages
Employment increased strongly over the reporting period, and contacts expected a similar-sized increase over the
next 12 months. Contacts across sectors reported continued difficulty in finding workers at all skill levels. Some
businesses seeking to ramp up production, particularly restaurants, had limited operating hours because of a lack
of workers. A temp agency contact said their openings increased and turnover rates were elevated; furthermore,
with the ease of finding new positions, workers were being more selective about workplace environment,
scheduling flexibility, and pay. Employers, temp agencies, and workforce development organizations pointed to
childcare challenges, retirements, and financial support from the government as important factors limiting labor
supply and remarked that worker concerns about health safety related to COVID-19 had largely gone away.
Overall, wage and benefit costs increased moderately. However, contacts across sectors noted strong pressure to
raise wages and there were widespread reports of businesses offering signing bonuses. One contact at a
university noted that salaries and retirement benefits that had been cut early in the pandemic had been restored.
Prices
Overall, prices rose strongly in late May and June, though contacts expected a moderate increase in prices over
the next 12 months. There were large increases in business output prices, driven by passthrough of higher
materials, energy, and transportation costs. Contacts highlighted higher prices for a wide range of materials
including metals, metal products, petroleum-based products, chemicals, electronics, and paper. Consumer prices
moved up robustly, particularly for new and used vehicles. Contacts pointed to solid demand, limited inventories,
and increased costs as sources of consumer price increases.
Consumer Spending
Consumer spending was flat over the reporting period but remained at elevated levels as retailers strained to meet
pent-up demand. Contacts said that overall, higher prices hadn't deterred consumers’ willingness to spend.
Spending on leisure and hospitality services continued to rebound. Contacts noted especially strong recoveries at
restaurants, casinos, and concessionaires at sporting venues and national parks. Nonauto retail sales remained
strong, particularly in the appliance, grocery, jewelry, and sporting goods sectors. Spending on building materials
and lawn and garden slowed but remained at a high level. Brick-and-mortar stores regained some market share
from e-commerce. New and used light vehicle sales slowed due to a lack of inventory and dealers indicated that
profit margins had widened. Dealers reported that they were increasingly selling from future vehicle allocations
from automakers.
Business Spending
Business spending increased moderately in late May and June. Retail inventories were low for many items, and
contacts expected inventory challenges to continue through the end of 2021. New and used light vehicle
inventories decreased and remained low, and dealers didn't expect new vehicle inventories to improve until the
end of the third quarter. Many manufacturing contacts said inventories remained below comfortable levels.
Contacts reported ongoing supply chain issues, especially for raw materials, metals, microchips, and specialty
parts, and expected the problems to continue into 2022. Demand for transportation services was strong and many
contacts reported shipping delays, both from within the U.S. and overseas. Capital expenditures increased
moderately, and contacts expected a similar-sized increase over the next twelve months. Many contacts noted that
lead times for capital equipment were much longer than usual. One contact said higher inventory expenses were
crowding out their capital purchases. Commercial and industrial energy usage increased modestly.
HONKAMP KRUEGER & CO., P.C. 19ECONOMIC AND INDUSTRY OVERVIEW | Q2 2021
Construction and Real Estate
Construction and real estate activity were little changed from the prior reporting period and remained at a high
level. Residential construction decreased modestly, but activity levels were healthy. Residential real estate activity
increased slightly, as did home sales, though the low number of homes on the market continued to hold back
activity. There was a large increase in home prices, while rents went up a bit. Nonresidential construction was
unchanged. A contact in southeast Michigan reported that an increasing number of projects were being postponed
because of high concrete and steel prices. Commercial real estate activity was also little changed, and prices and
rents were steady.
Manufacturing
Manufacturing production increased modestly in late May and June. Most manufacturing contacts indicated that
business was above pre-pandemic levels, but there were also widespread reports of logistical and supply issues
holding back growth. Auto output was little changed, as assemblers and suppliers remained constrained by
ongoing shortages of parts, notably microchips. Steel production increased slightly, and capacity utilization was at
a multiyear high, with contacts reporting greater demand from most industries, with the exception of autos.
Demand for heavy machinery increased, led by growth in construction and agriculture. Specialty metals
manufacturers reported a moderate increase in orders from an already high level. Many had reached full capacity
and were dealing with shortages of materials and longer lead times from suppliers.
Banking and Finance
Financial conditions improved slightly over the reporting period. Participants in equity and bond markets reported a
small improvement in conditions. Business loan demand increased moderately. One contact said that once firms
were successful in getting their PPP loans forgiven, they were more comfortable taking out new loans to fund
capital expenditures. Business loan quality increased slightly, with improvements reported across all sectors.
Business loan standards loosened a bit in a very competitive environment. In consumer markets, loan demand
increased slightly. Contacts reported that demand remained high, particularly in the auto and housing markets, and
that consumer credit quality remained favorable. Loan quality increased slightly, while credit standards were
unchanged on balance. Banks continued to be awash in deposits from both businesses and households.
Agriculture
Agriculture stayed on course to earn higher market-based incomes relative to last year, as most product prices
remained high enough to offset increased costs for freight, energy, fertilizers, and labor. On net, corn prices were
little changed, while soybean prices were a little lower over the reporting period. Although planted corn and
soybean acreage was up from last year, it was lower than expected earlier in the growing season, which helped
maintain prices. Crop conditions for corn and soybeans were mixed, as some parts of the District were in excellent
shape and others were stressed by drought. Hog and milk prices eased off highs during the reporting period, while
cattle prices were flat. One contact noted that a lack of workers in slaughterhouses had led to the suspension of
some contracts with poultry producers. Farmland values moved higher again.
HONKAMP KRUEGER & CO., P.C. 20You can also read