Structural colors of pearls - Nature
←
→
Page content transcription
If your browser does not render page correctly, please read the page content below
www.nature.com/scientificreports
OPEN Structural colors of pearls
Ryotaro Ozaki1*, Kei Kikumoto1, Masataka Takagaki1, Kazunori Kadowaki1 &
Kazushi Odawara2
The luster is the most important characteristic of pearls, whose colors depend on periodic structures
of aragonite crystal layers and conchiolin sheets. We here propose an optical model for analyzing
the structural colors of pearls that includes the transmission, reflection, and scattering of light in
pearls. Unlike other structural color materials, internal light scattering and its transmission are
the keys to understanding the optical properties of pearls. The appearance of pearls is determined
by the superposition of transmitted and reflected light. The transmission and reflection spectra of
pearls calculated using the proposed model show good agreement with experimental results. We
also demonstrate the rendering of images of pearls using the calculated spectra. Furthermore, the
appearance of pearls with different layer thicknesses are predicted by calculation based on the optical
model.
Pearls are gifts of nature and one of the most fascinating gems. Most gems such as gold, diamonds, sapphires,
and rubies are mined from the ground, but pearls are produced by mollusk shells that live in seas or lakes.
Among these gems, pearls are the only gems that humans can create from nature. The luster and color of pearls
are known as structural colors, which originate from multiple reflections in a nanolayered structure of nacre
(also called mother of pearl). Nacre is composed of aragonite crystal layers separated by conchiolin, which is
a protein secreted by mollusk shells. The thickness of these layers determines the color of reflection from the
nacre. To identify the cause of iridescence of pearls and shells, many researchers have studied the optics of pearls.
Historically, Brewster studied diffraction at steps on a surface of mother of pearl from an optical viewpoint in
his book published in 18331. In 1917, Pfund measured the reflection spectra of mother of pearl in the visible
and infrared regions2. He was the first to demonstrate that the interference color of mother of pearl is caused
by multiple reflections from the multilayered structure of nacre. Rayleigh theoretically studied the iridescent
color of mother of pearl around the same t ime3. In the 1930s and 1950s, Raman studied in detail the reflection,
transmission, and scattering of light in pearls and shells to investigate the appearance of natural and cultured
pearls4–9. Optical properties of pearls and shells have been studied by physicists in the past, but recently, genetic
and DNA studies have been actively conducted10–13.
Structural colors are abundant in nature, for example, in pearls, opals, morpho butterflies, jewel beetles, and
pollia fruits14–20. Optical calculations of structural colors are important both physically and practically. In 1917,
Rayleigh theoretically calculated reflections from multilayered structures to study structural colors of some
beetles and butterflies having a regularly stratified m edium14. In modern optics, many optical elements and
devices have been developed on the basis of thin-film interferences or multiple reflections in periodic structures,
e.g., gratings, Fabry–Perot structures, and photonic c rystals21,22. These optical elements have been used in spec-
trometers, lasers, optical filters, and other devices. The key features of these elements are wavelength selectivity
and field enhancements23,24. Visualizations of structural colors have also been developed with the advancement
of theoretical and numerical calculations for these modern optical elements. The realistic rendering of struc-
turally colored surfaces with thin-film interferences and multiple reflections has been achieved on the basis
of optical c alculations25–28. Not only the one-dimensional structural colors of the layered structures but also a
three-dimensional structural color of a morpho butterfly has also been visualized by three-dimensional mod-
eling numerical simulations29,30. This realistic rendering is expected to be used as a tool for designing industrial
products with such structural colors31.
In pearl grading, the value of a pearl is determined by several factors such as size, color, and luster among
others32–38. To evaluate pearl quality according to these factors, regression analysis has been proposed for Akoya
pearl grading35. Although the pearl grading includes many complex factors, pink pearls generally tend to be
prefer. To control the color of cultured pearls, we have introduced nondestructive method of measuring the
average aragonite crystal layer thickness in Akoya pearl farming38. This nondestructive method allows us to
roughly control the color of cultured Akoya pearls. On the other hand, it is not completely clear what a pearl
1
Department of Electrical and Electronic Engineering and Computer Science, Graduate School of Science and
Engineering, Ehime University, Matsuyama 790‑8577, Japan. 2Fisheries Research Center, Ehime Research
Institute of Agriculture, Forestry and Fisheries, 5516 Shimonada, Uwajima, Ehime 798‑0104, Japan. *email:
ozaki.ryotaro.mx@ehime-u.ac.jp
Scientific Reports | (2021) 11:15224 | https://doi.org/10.1038/s41598-021-94737-w 1
Vol.:(0123456789)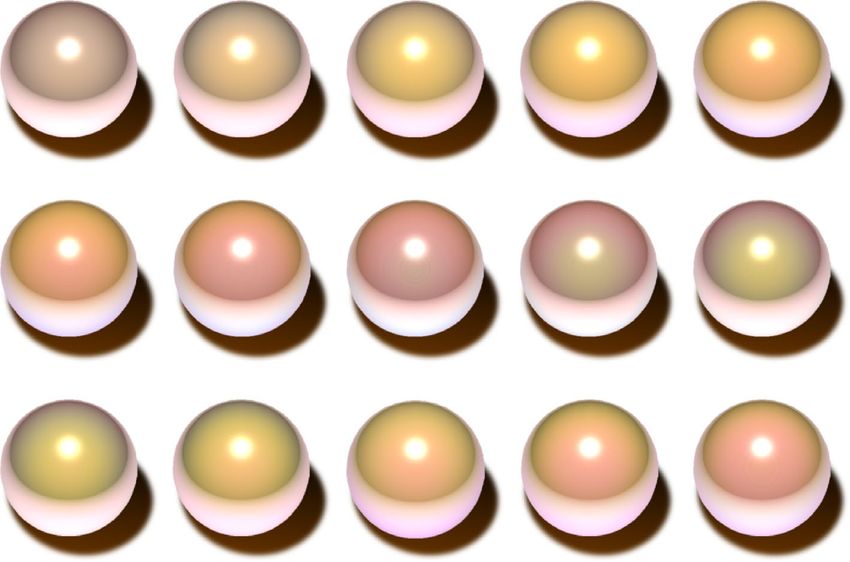
www.nature.com/scientificreports/
with a certain aragonite crystal layer thickness will look like. Since it takes at least one year to produce pearls in
pearl farming, visual simulation of pearls based on the layer thickness is important to improve the productivity
of pearls with the desired color. Some studies on the visual simulation of Akoya pearls have achieved a realistic
computer graphics r endering39,40. In those studies, the interference color of Akoya pearls is determined from
only the reflection, and then the texture and reflection intensity are adjusted to produce images of pearls. How-
ever, Raman mentioned that the reflection at a spherical surface is not sufficient to visualize the appearance of
pearls and the beauty of pearls is due to the superposition of the reflected light and chromatic diffusion h alo8,9.
He considered that the halo is produced by transmission diffraction from the individual crystallites in aragonite
layers in which each crystallite functions as a diffracting particle. Komatsu has also pointed out that pearls have
reflection and transmission interference colors in which the transmission interference color is complementary to
the reflection interference c olor36,37. According to his book, the color of Akoya pearls we see is the transmission
interference color37. However, the mechanism is not fully understood yet. The important point here is that both
Raman and Komatsu studied the appearance of pearls by focusing on the transmitted light from pearls. In general,
the appearance of structural colors is determined by the reflected light, but in the case of pearls, it is interesting
that the transmitted light is more important than the reflected light. Therefore, we have developed a new optical
model appropriate for pearls based on light transmission, reflection, and scattering in pearls. The transmission
and reflection spectra of Akoya pearls of three different colors calculated using the proposed model are in good
agreement with the measured spectra. We have also developed a rendering program coded using OpenGL Shad-
ing Language to reproduce the appearance of pearls using the calculated optical spectra. The rendered images
have high reproducibility of the interference colors of actual pearls. Furthermore, the appearance of pearls with
different aragonite crystal layer thicknesses is predicted by the calculation based on the optical model.
Results
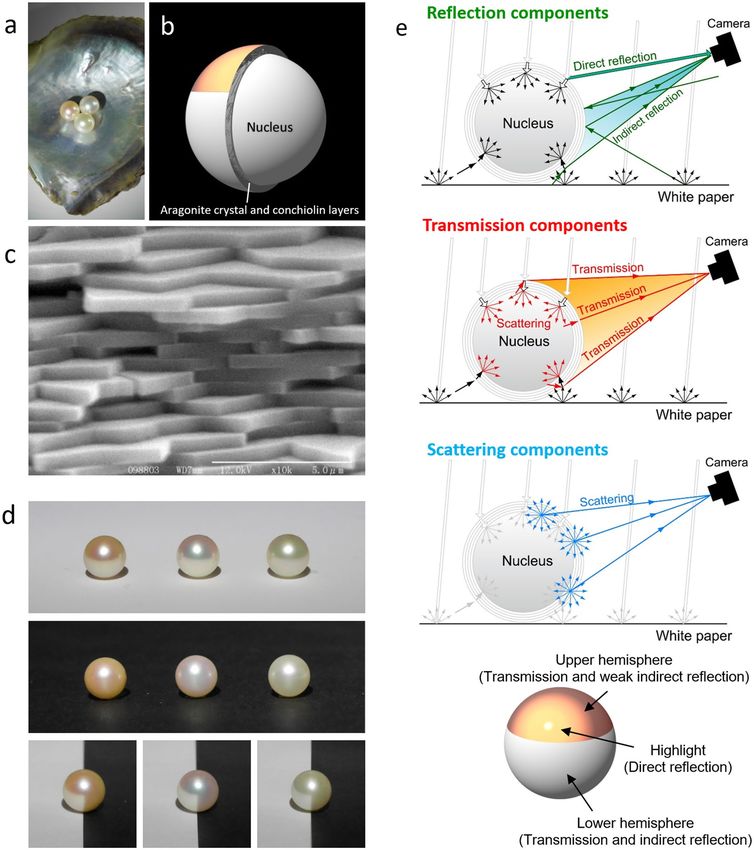
Pearls show various beautiful structural colors, which depend on the layer thickness in nacre (Fig. 1a). The
nucleus of a pearl is covered with nacre, which consists of aragonite crystal layers and conchiolin sheets (Fig. 1b).
These multilayers in nacre can be clearly observed by a scanning electron microscopy (Fig. 1c). The thickness
of an aragonite crystal layer is typically between 300 and 500 nm, and that of a conchiolin sheet is about 10 nm.
In this study, we used three different colors of Akoya pearls (Fig. 1d) to investigate the mechanism underlying
the structural color of pearls. The average thicknesses of the aragonite crystal layers of the orange, pink-green,
and green pearls were 320, 360, and 410 nm, respectively, which were determined from their reflection spectra.
The appearance of pearls is affected by surrounding conditions. The effect of the surrounding conditions is
clear when the pearls are placed against white and black background (Fig. 1d). Against the white background,
the upper hemispheres of the three pearls show different colors, whereas their lower hemispheres all appear
white. In contrast, the structural colors appear on almost the entire surface of the pearls against the black back-
ground. The difference is more clearly seen by placing it at the center of the white and black sheets of paper.
These pictures were taken in a dark room to prevent the projection of the environment onto the surface of the
pearls, and only one white LED was used for lighting (Supplementary Fig. 1). To explain these observations, we
propose a new optical model for pearls (Fig. 1e). Reflection components detected by a camera consist of direct
and indirect reflections. In the schematic illustration of the reflection components, white arrows represent light
from the light source and green arrows represent the reflection components detected by the camera. That is, the
camera captures the direct reflection from the light source at a point in the upper hemisphere and the indirect
reflection from the white paper, which mainly illuminates the lower hemisphere of the pearl. In this case, the
indirectly reflected light is much weaker than the directly reflected light from the light source. In the schematic
illustration of the transmission components, the red arrows represent the transmission components arising from
light scattering in the nucleus. In general, nucleuses are made of freshwater mussel and look like white beads
(Supplementary Fig. 2). Nucleuses have a layered structure with a layer thickness of several microns. Light in a
pearl is scattered at boundaries of layered structures in nacre and nucleus due to nonuniformity of the layered
structures. The light scattering plays an important role in the appearance of pearls. Since the light from the light
source does not enter into the camera directly under the lighting conditions (Supplementary Fig. 1), the detected
transmission light is the scattered light. That is, the light coming from various directions is scattered in the
nacre and nucleus, and then the light passes through the nacre and out into the air. In other words, the nucleus
functions similarly to a light source. Since the scattered light passes through the nacre consisting of multilay-
ers, transmission intensities of the light in certain wavelength regions decrease owing to multiple reflections in
the nacre. For this reason, the transmitted light comes from not only the upper hemisphere but also the lower
hemisphere. Therefore, the transmission interference colors can be seen from the entire surface of the pearl on
the black paper in which reflection is suppressed (Fig. 1d). On the other hand, the transmission interference color
is complementary to the reflection interference color. The observer will see the superposition of the transmission
and reflection interference colors at the lower hemisphere. The two overlapping complementary colors produce
the white color on the lower hemisphere when the pearl is placed on the white paper. Interestingly, according
to the model, the color of the upper hemisphere is determined by the transmitted light, even though the pearl is
irradiated with light from above (Supplementary Fig. 1). We have here explained that the transmission interfer-
ence color is complementary to the reflection interference color, but strictly speaking, these are not completely
complementary owing to light absorption of conchiolin.
To investigate their optical properties, the transmission and reflection spectra of the three pearls were meas-
ured. The reflection spectra were obtained by microspectroscopy (Fig. 2a), which can reduce the nonuniformity
of reflection wavelengths depending on the position because of the small observation area. In contrast, the trans-
mission spectra cannot be measured by microspectroscopy because the pearls scatter light and the optical path is
long. To obtain transmission properties, we have developed a measurement method for a transmission spectrum
Scientific Reports | (2021) 11:15224 | https://doi.org/10.1038/s41598-021-94737-w 2
Vol:.(1234567890)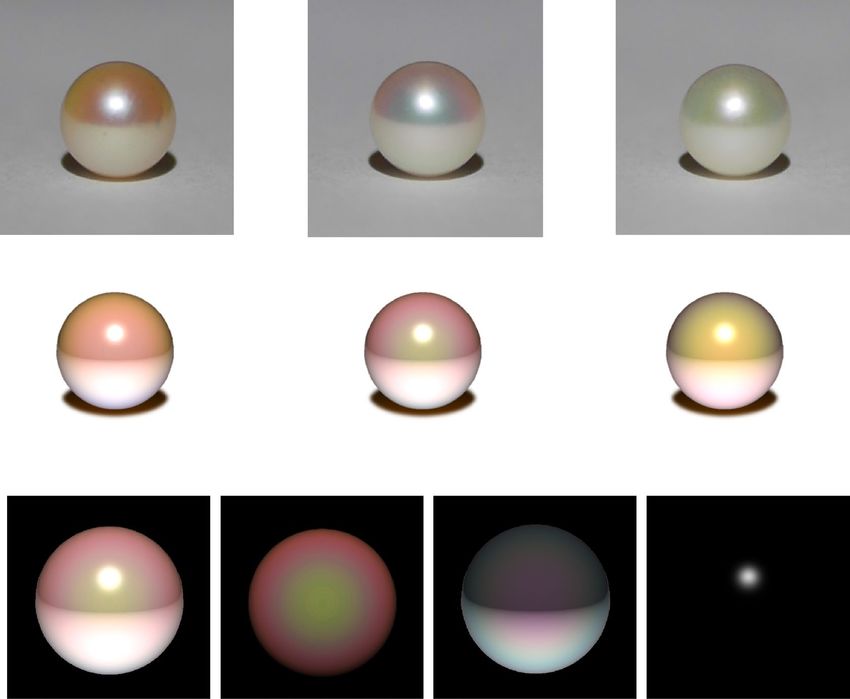
www.nature.com/scientificreports/

                                  Figure 1.  Structure, appearance, and optical model of pearls. (a) Three Akoya pearls of different colors. (b)
                                  Schematic illustration of structure of Akoya pearl. (c) SEM image of typical nacre of Akoya pearl. The length
                                  of the scale bar is 5 μm. (d) Photographs of three pearls placed on white and black sheets of paper. (e) Optical
                                  model for reflection, transmission, and scattering components of pearl.

                                  of a pearl using an integrating sphere, in which incident light from an LED enters the entire surface of a pearl
                                  except for the detector position (Fig. 2b). We consider that the system is suitable for measuring the transmission
                                  characteristics of pearls and verifying of the proposed transmission model (Fig. 1e). In the reflection spectra of
                                  the orange, pink-green, and green pearls (Fig. 2c–e), broad reflection bands show peaks corresponding to the
                                  center wavelength of multiple reflections from the aragonite crystal layers in nacre. The center wavelength λm of
                                  the reflection band for a normal incidence is given by λm = 2(n1d1 + n2d2)/m, where n1 and n2 are the refractive
                                  indices of the aragonite crystal and conchiolin layers, d1 and d2 are the thicknesses of the aragonite crystal and

Scientific Reports |   (2021) 11:15224 |               https://doi.org/10.1038/s41598-021-94737-w                                                    3

                                                                                                                                              Vol.:(0123456789)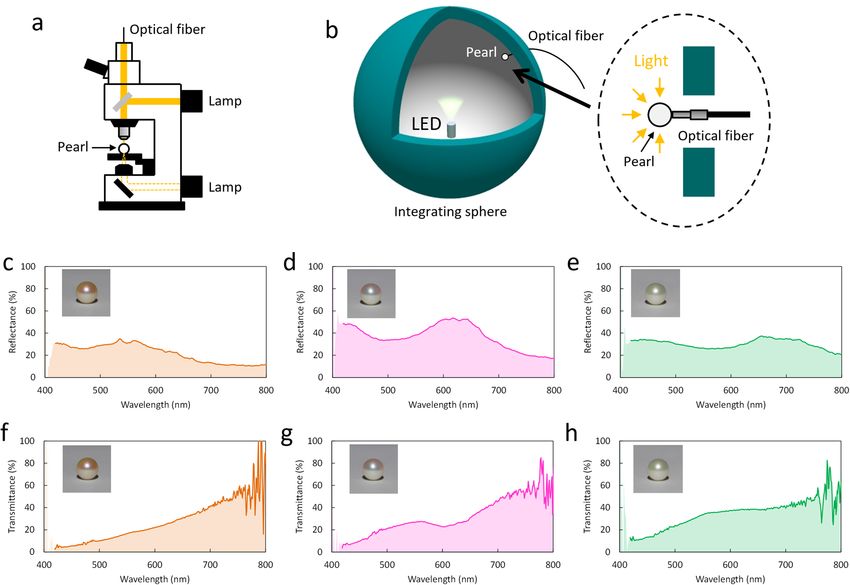
www.nature.com/scientificreports/
Figure 2. Reflection and transmission characteristics of pearls of three different colors. (a) Schematic
illustration of microspectroscopy setup for reflection measurement. (b) Schematic illustration of experimental
setup for transmission measurement using integrating sphere. (c–e) Reflection spectra of orange, pink-green,
and green pearls, respectively. (f–h) Transmission spectra of the three pearls.
conchiolin layers, and m is the order of reflection. The measured center wavelengths of the 2nd-order reflec-
tion bands for the orange, pink-green, and green pearls were approximately 560, 620, and 700 nm, respectively.
The thickness of the aragonite crystal layer d1 in nacre was determined using the above equation. The aragonite
crystal layer thicknesses of the orange, pink-green, and green pearls were estimated as 324, 360, and 408 nm,
respectively, where we used the following parameters: n1 = 1.68, n2 = 1.5, and d2 = 10 nm. The three spectra also
indicate that light is scattered in the pearls because the baseline is not zero and the light at shorter wavelengths
is scattered more than that at longer wavelengths. In the transmission spectra of the three pearls (Fig. 2f–h),
the light scattering reduces the transmittance on the short-wavelength side, which corresponds to the reflection
spectra. Furthermore, it can be seen that the stop bands of the pearls correspond to the reflection bands in the
reflection spectra. Although the stop band of the orange pearl is very weak, we consider that the absorption of
conchiolin in the orange pearl is stronger than those in the other two pearls.
To theoretically reproduce the transmission and reflection spectra, we have first calculated the spectral base-
lines on the basis of the Kubelka–Munk theory, which is a classical approximation for multiple scatterings41,42.
In this calculation, the light scattering in the pearls was calculated by assuming that the pearls are a scattering
medium and by simplifying the input and output of light (Fig. 3a). In actual pearls, the behavior of the light
transmission and reflection is three dimensional, but we used the one-dimensional model to calculate their scat-
tering. Although the model includes the assumption, the calculated scattering reflection Rs and transmission Ts
are in good agreement with the baselines of the measured spectra (Fig. 3b,c).
Interference components arising from the multiple reflections in nacre were calculated by the transfer matrix
method, which is widely used for the analysis of a one-dimensional layered structure43. To calculate transmis-
sion and reflection spectra of pearls, the determination of the thickness distribution of aragonite crystal layers is
necessary44. In general, the thickness of an aragonite crystal layer in nacre gradually decreases as a pearl grows45.
To reproduce the characteristics of nacre, aragonite crystal layer thickness profiles were numerically generated
by random decrement technique (Supplementary Fig. 3a–c). That is, the aragonite crystal layer is thick near
the nucleus and gradually and randomly thins toward the surface. In this calculation, the number of aragonite
crystal layers was set to be 1000, and the thickness was assumed to exhibit a normal distribution (Supplementary
Fig. 3d–f). Assuming the distributions for the orange, pink-green, and green pearls, the transmittance without
light scattering Ti0 can be calculated by the transfer matrix method (Fig. 3d–f). The transmission spectra includ-
ing light scattering in the pearls can be reproduced by combining the scattering and interference transmission
Scientific Reports | (2021) 11:15224 | https://doi.org/10.1038/s41598-021-94737-w 4
Vol:.(1234567890)www.nature.com/scientificreports/
Figure 3. Calculated scattering and interference spectra of three pearls. (a) Schematic illustration of
approximate model of scattering in pearl. (b) Calculated scattering reflection spectrum Rs and measured
reflection spectrum of pink-green pearl. (c) Calculated scattering transmission spectrum Ts and measured
transmission spectrum of pink-green pearl. (d–f) Calculated interference transmission spectra without
scattering Ti0 of orange, pink-green, and green pearls, respectively. The incident light is P-polarized and the
legend represents an incident angle. (g–i) Calculated transmission spectra T of pearls obtained by T = Ts ∙ Ti0
. (j–l) Calculated interference reflection spectra Ri of pearls. (m–o) Calculated reflection spectra R of pearls
obtained by R = Rs + Ri.
calculations. Since the scattered light in the nucleus passes through the aragonite crystal layers, the transmission
spectrum of the pearls T is given by Ts∙Ti0 (Fig. 3g–i). In other words, the scattered light in the nucleus acts as a
light source and the aragonite crystal layers function as a transmission color filter. In addition, using the result of
the transmission calculation, we can obtain the interference reflection component Ri by Ts − T (Fig. 3j–l). Since
the reflection from the pearls is a superposition of the scattering reflection Rs and interference reflection Ri, the
reflection spectrum R is given by Rs + Ri (Fig. 3m–o). The reason why the interference reflection Ri decreases at
shorter wavelengths is that the scattering reflection Rs increases at the shorter wavelengths. On the basis of the
above procedure, we calculated the reflection and transmission spectra for P- and S-polarizations including the
light scattering of the pearls. The calculated reflection and transmission spectra for the orange, pink-green, and
green pearls at normal incidence (Fig. 4a–f) show good agreement with the experimental results (Fig. 2c–h).
Scientific Reports | (2021) 11:15224 | https://doi.org/10.1038/s41598-021-94737-w 5
Vol.:(0123456789)www.nature.com/scientificreports/
a 100 b 100 c 100
80 80 80
Reflectance (%)
Reflectance (%)
Reflectance (%)
60 60 60
40 40 40
20 20 20
0 0 0
400 500 600 700 800 400 500 600 700 800 400 500 600 700 800
Wavelength (nm) Wavelength (nm) Wavelength (nm)
d 100
e 100
f 100
80 80 80
Transmittance (%)
Transmittance (%)
Transmittance (%)
60 60 60
40 40 40
20 20 20
0 0 0
400 500 600 700 800 400 500 600 700 800 400 500 600 700 800
Wavelength (nm) Wavelength (nm) Wavelength (nm)
Figure 4. Calculated reflection and transmission spectra of three pearls. (a–c) Calculated reflection spectra
of orange, pink-green, and green pearls, respectively. The incident angle is 0°. (d–f) Calculated transmission
spectra of three pearls for normal incidence.
The visual simulator for the pearls has been coded using OpenGL Shading Language. Using the self-coding
shading program and the calculated reflection and transmission spectra, we reproduced the appearance of the
pearls with different aragonite crystal layer thicknesses. The appearance of the simulated pearls is in excellent
agreement with that of real pearls (Fig. 5a,b). For example, in the real and rendered images of the green pearl,
most of the upper hemisphere is green. In the real and rendered images of the orange pearl, the color of the
upper hemisphere changes from dark orange to light orange with increasing distance from the center. Similarly,
in the real and rendered images of the pink-green pearl, the color of the upper hemisphere gradually changes
from green to pink. Furthermore, the lower hemisphere in all real and rendered images of the pearls is white. We
have also rendered the image with a different viewing position (Supplementary Fig. 4). The simulation results
are in good agreement with the real images, even at a different angle. These indicate that our models and optical
calculations are appropriate for pearls.
The rendered images consist of three color components: transmission and reflection interference colors and a
highlight (Fig. 5c). In the transmission component, the pearl has the transmission interference color depending
on the angle. We here assumed that the light scattering in the nucleus and aragonite crystal layers is isotropic
light scattering and that the intensities of the light scattered in all directions are homogeneous. The color of the
transmission light is determined by the multiple interferences in the aragonite crystal layers. The light from
the center of the pearl to an observer is incident at normal incidence, and the incident angle for the observer
increases with the distance from the center (Supplementary Fig. 5). The calculated transmission spectrum at
normal incidence (Fig. 4e) has two broad peaks at around 530 and 800 nm, in which the color of the peak at
530 nm corresponds to green and the peak at 800 nm does not strongly affect the visualization owing to infrared
light. When the incident angle increases, the spectrum shifts to shorter wavelengths (Fig. 3d–o). At highly oblique
incidence, the shorter broad peak shifts to the blue wavelength region and the longer broad peak shifts to the
red wavelength region. Therefore, the color of the pearl gradually changes from green to pink. Furthermore, the
transmission image is similar to that of the pearls placed on the black paper (Fig. 1d), in which the reflection
light is suppressed by the black paper. On the other hand, the indirect reflection components strongly depend
on the surrounding conditions. We here calculated the reflection interference color by irradiating the pearl with
light indirectly reflected from the white paper (Fig. 1e). In this situation, the light from the white paper mainly
brightens the lower hemisphere of the pearl, and the reflection interference color also depends on the angle and
position. Note that reflection interference colors are complementary to transmission interference colors. That
is, from the comparison between the transmission and indirect reflection images, the green and pink parts are
opposite to each other. This is because the peak and dip wavelengths are opposite between the transmission and
reflection interference colors (Fig. 4). The highlight of the direct reflection from the light source is assumed to
be white owing to the light saturation of the detector. The rendered image is the superposition of all images that
considers the scattering, interference, indirect reflection, and direct reflection of light. Now, we can clearly explain
that the lower hemisphere of the pearl on the white paper is white. This is because the lower hemisphere color
is due to the superposition of the transmission interference and complementary reflection interference colors.
The most important application of the simulation is the visualization of pearls, which depends on the layer
structure in nacre. The images of pearls have been rendered with different average aragonite crystal layer thick-
nesses (Fig. 6). The pearl with d = 200 nm is green, which gradually changes to yellow, orange, pink-green, green,
and yellowish-orange with increasing layer thickness. This is the most important result of the present study. These
images suggest that the color of pearls changes repeatedly from green to orange and pink-green. Furthermore,
interestingly, the range of conditions for making pink-green pearls, which are more expensive than those of other
Scientific Reports | (2021) 11:15224 | https://doi.org/10.1038/s41598-021-94737-w 6
Vol:.(1234567890)www.nature.com/scientificreports/
a
Orange pearl Pink-green pearl Green pearl
b
Orange pearl Pink-green pearl Green pearl
c
Rendered image Transmission Indirect reflection Direct reflection
Figure 5. Real pearls and rendered images. (a) Photographs of three pearls of different colors. (b) Rendered
images of pearls obtained using proposed optical model. (c) Transmission, indirect reflection, and direct
reflection components of rendered image of pink-green pearl.
colors in the market, is narrow. The prediction of color patterns in pearls would greatly help pearl researchers
and farmers academically and practically.
Discussion
The optical properties of pearls have been investigated by observing changes in appearance depending on the
surrounding environment and measuring reflection and transmission spectra. The reflection spectra of pearls
were measured by conventional microspectroscopy, whereas the transmission spectra of pearls could not be
measured owing to a strong scattering. To measure the transmission properties of the pearls, an integrating sphere
was used for the measurement of transmission spectra. On the other hand, to explain the changes in appearance
depending on the surrounding environment, we have developed an optical model that considers the scattering
in pearls and the transmission and reflection interferences in nacre. The scattering in the nucleus and nacre has
been calculated on the basis of the Kubelka–Munk theory, and the multiple interference colors in nacre have been
calculated by the transfer matrix method. The transmission and reflection spectra calculated using the proposed
model are in good agreement with the experimental results. We have also developed the pearl visual simulator
coded by OpenGL Shading Language. By using the simulator and the calculated spectra, we have succeeded in
visualizing Akoya pearls with different interference colors on a computer. We hope that our proposed model
becomes the new standard for analyzing the optical properties of pearls.
Methods
Spectral measurements. The reflection spectra of the three pearls were measured by microspectroscopy.
A pearl on the stage was irradiated with a halogen coaxial epi-illuminator. The reflected light was detected with
an optical fiber connected to a CCD multichannel spectrometer (StellarNet, BLUE-Wave). The microspectros-
copy can reduce the error due to the nonuniformity of reflection wavelengths because of the small observation
area. In contrast, transmission spectra cannot be measured by microspectroscopy because pearls scatter light
and the optical path is long. To obtain effective transmission properties, we measured the transmission spectra
of the pearls using an integrating sphere. As shown in Fig. 2b, a pearl attached to an optical fiber was placed in
the integrating sphere, to which the light enters the entered and illuminated surface of the pearl except for the
Scientific Reports | (2021) 11:15224 | https://doi.org/10.1038/s41598-021-94737-w 7
Vol.:(0123456789)www.nature.com/scientificreports/
d = 200 nm d = 220 nm d = 240 nm d = 260 nm d = 280 nm
d = 300 nm d = 320 nm d = 340 nm d = 360 nm d = 380 nm
d = 400 nm d = 420 nm d = 440 nm d = 460 nm d = 480 nm
Figure 6. Simulation of appearance of Akoya pearls. The average aragonite crystal layer thickness d gradually
changes. The variance σ2 of all layer thickness distributions is set to be σ2 = 30 nm.
detector position. A white LED was used as a light source and the light intensity with and without the pearl was
measured with the spectrometer.
Calculations of transmission and reflection spectra. Light scattering in a pearl was calculated on the
basis of the Kubelka–Munk theory, which is widely used to analyze multiple light scatterings. Transmission and
reflection intensities through a multiple-scattering medium are expressed as
1 − A2 exp(−ατ )
Ts = , (1)
1 − A2 exp(−2ατ )
1 − exp(−2ατ )
Rs = , (2)
1 − A2 exp(−2ατ )
where τ is the optical length of the scattering medium, and A and α are given by
(3)
α = K(K + 2S),
K + 2S − α
A= . (4)
K + 2S + α
Here, K and S are nondimensional absorption and scattering coefficients of the scattering medium, respec-
tively. In this study, the coefficients are set to be K = (300 × 10−9/λ)/τ and S = [(500 × 10−9/λ)4]/τ. It is assumed that
the pearl has a constant extinction coefficient and Rayleigh scattering occurs in the pearl.
To obtain interference components, the transmission spectrum Ti0 of the pearl without scattering was calcu-
lated by the transfer matrix method, which is widely used for the analysis of a one-dimensional layered structure.
Since the light transmitted from the pearl passes through the multilayer and scattering medium in series, the
total transmission spectrum T including light scattering was calculated as T = Ts∙Ti0. On the other hand, since
one observes the superposition of the scattering reflection Rs and interference reflection Ri, the total reflection
spectrum R including light scattering was calculated as R = Rs + Ri. In the interference calculations, we used
the following parameters: the thickness of the conchiolin is constant at 10 nm and the refractive indices of the
aragonite crystal and conchiolin are 1.68 and 1.5, respectively. Pearls have not only the aragonite layer thickness
nonuniformity (Supplementary Fig. 3) but also an in-plane nonuniformity. In the calculations, a Gaussian filter
is applied to reproduce the in-plane nonuniformity of pearls.
Rendering of pearl. The pearl visualization simulator has been coded using the OpenGL Shading Lan-
guage, in which the colors of pearls are determined by optical calculations. The colors of pearls consist of trans-
mission, direct reflection, and indirect reflection components. The transmission interference color has angular
dependence. However, the transmission color does not depend on the observer position because the nucleus
Scientific Reports | (2021) 11:15224 | https://doi.org/10.1038/s41598-021-94737-w 8
Vol:.(1234567890)www.nature.com/scientificreports/
functions as a light source. Since the transmission color changes depending on the distance from the center
under the condition, the transmission components of the pearl are concentrically colored in the program. The
color of the direct reflection is set to be white because the intensity of the direct reflection is very high. The
indirect reflection from the white paper is reproduced by placing a pseudo light source under the pearl. The
reflection color is complementary to the transmission color. Unlike transmission, the light intensity of reflection
depends on the position of the viewpoint. In addition, the intensities of the light source for transmission and
reflection differ in the program. This is due to the fact that the transmission light depends on the actual light
source, whereas the indirect reflection depends on the surrounding environment.
Received: 1 June 2021; Accepted: 13 July 2021
References
1. Brewster, D. A Treatise on Optics (Carey, Lea, and Blanchard, 1833).
2. Pfund, A. H. The colors of mother-of-pearl. J. Franklin Inst. 183, 453–464 (1917).
3. Rayleigh, L. Studies of iridescent colour and the structures producing it. II Mother-of-pearl. Proc. R. Soc. Lond. A 102, 674–677
(1923).
4. Raman, C. V. On iridescent shells. Part I. Introductory. Proc. Indian Acad. Sci. A1, 567–573 (1935).
5. Raman, C. V. On iridescent shells. Part II. Colours of laminar diffraction. Proc. Indian Acad. Sci. A1, 574–589 (1935).
6. Raman, C. V. & Krishnamurti, D. The structure and optical behaviour of iridescent shells. Proc. Indian Acad. Sci. A39, 1–13 (1954).
7. Raman, C. V. & Krishnamurti, D. The structure and optical behaviour of pearls. Proc. Indian Acad. Sci. A39, 215–222 (1954).
8. Raman, C. V. & Krishnamurti, D. On the chromatic diffusion halo and other optical effects exhibited by pearls. Proc. Indian Acad.
Sci. A39, 265–271 (1954).
9. Raman, C. V. & Krishnamurti, D. Optics of the pearl. Curr. Sci. 23, 173–176 (1954).
10. Kinoshita, S. et al. Deep sequencing of ESTs from nacreous and prismatic layer producing tissues and a screen for novel shell
formation-related genes in the pearl oyster. PLoS One 6, e21238 (2011).
11. Takeuchi, T. et al. Draft genome of the pearl oyster Pinctada fucata: A platform for understanding bivalve biology. DNA Res. 19,
117–130 (2012).
12. Funabara, D. et al. Novel genes participating in the formation of prismatic and nacreous layers in the pearl oyster as revealed by
their tissue distribution and RNA interference knockdown. PLoS One 9, e84706 (2014).
13. Takeuchi, T. et al. Divergent northern and southern populations and demographic history of the pearl oyster in the western Pacific
revealed with genomic SNPs. Evol. Appl. 13, 837–853 (2020).
14. Rayleigh, L. On the reflection of light from a regularly stratified medium. Proc. R. Soc. Lond. A 93, 565–577 (1917).
15. Parker, A. R. 515 million years of structural colour. J. Opt. A Pure Appl. Opt. 2, R15–R28 (2000).
16. Vukusic, P. & Sambles, J. R. Photonic structures in biology. Nature 424, 852–855 (2003).
17. Kinoshita, S. & Yoshioka, S. Structural colors in nature: The role of regularity and irregularity in the structure. ChemPhysChem 6,
1442–1459 (2005).
18. Sun, J., Bhushan, B. & Tong, J. Structural coloration in nature. RSC Adv. 3, 14862–14889 (2013).
19. Kimura, T. et al. Guanine crystals regulated by chitin-based honeycomb frameworks for tunable structural colors of sapphirinid
copepod, Sapphirina nigromaculata. Sci. Rep. 10, 2266 (2020).
20. Barrera-Patiño, C. P. et al. Photonic effects in natural nanostructures on Morpho cypris and Greta oto butterfly wings. Sci. Rep. 10,
5786 (2020).
21. Joannopoulos, J. D., Villeneuve, P. R. & Fan, S. Photonic crystals: Putting a new twist on light. Nature 386, 143–149 (1997).
22. Sakoda, K. Optical Properties of Photonic Crystals (Springer, 2001).
23. Ozaki, R. et al. Luminescent color control of Langmuir–Blodgett film by emission enhancement using a planar metal layer. Sci.
Rep. 8, 17119 (2018).
24. Lee, K.-T. et al. Flexible high-color-purity structural color filters based on a higher-order optical resonance suppression. Sci. Rep.
9, 14917 (2019).
25. Sun, Y., Fracchia, F. D., Drew, M. S. & Calvert, T. W. Rendering iridescent colors of optical disks. In EGSR 2000: Rendering Tech-
niques 2000 341–352 (2000).
26. Hirayama, H., Kaneda, K., Yamashita, H. & Monden, Y. An accurate illumination model for objects coated with multilayer films.
Comput. Graph. 25, 391–400 (2001).
27. Iwasaki, K., Matsuzawa, K. & Nishita, T. Real-time rendering of soap bubbles taking into account light interference. Proc. Comput.
Graph. Int. 2004, 344–348 (2004).
28. Wu, F. K. & Zheng, C. W. Microfacet-based interference simulation for multilayer films. Graph. Models 78, 26–35 (2015).
29. Okada, N. et al. Rendering Morpho butterflies based on high accuracy nano-optical simulation. J. Opt. 42, 25–36 (2013).
30. Musbach, A., Meyer, G. W., Reitich, F. & Oh, S. H. Full wave modelling of light propagation and reflection. Comput. Graph. Forum
32, 24–37 (2013).
31. Ershov, S., Kolchin, K. & Myszkowski, K. Rendering pearlescent appearance based on paint-composition modelling. Comput.
Graph. Forum 20, 227–238 (2001).
32. Elen, S. Spectral reflectance and fluorescence characteristics of natural-color and heat-treated “Golden” south sea cultured pearls.
Gems Gemol. 37, 114–123 (2001).
33. Snow, M. R., Pring, A., Self, P., Losic, D. & Shapter, J. The origin of the color of pearls in iridescence from nano-composite structures
of the nacre. Am. Mineral. 89, 1353–1358 (2004).
34. Toyota, T. & Nakauchi, S. Optical measurement of interference color of pearls and its relation to subjective quality. Opt. Rev. 20,
50–58 (2013).
35. Tani, Y., Nagai, T., Koida, K., Kitazaki, M. & Nakauchi, S. Experts and novices use the same factors—but differently—to evaluate
pearl quality. PLoS One 9, e86400 (2014).
36. Komatsu, H., Yazaki, J., Yamamoto, T., Tanaka, H. & Yokose, C. Study of the measurement of Teri in pearls I: Consideration about
the correlation of three kinds of evaluation methods of Teri in white Akoya pearls. J. Gemmol. Soc. Jpn. 31, 3–6 (2014) (in Japanese).
37. Komatsu, H. Dictionary of Pearls [Translated from Japanese.] (Senken shinbun, 2015) (in Japanese).
38. Odawara, K., Ozaki, R. & Takagi, M. Influence of the thickness of the nacreous elemental lamina of the pearl oyster Pinctada fucata
used as donor oysters on the pearls. Nippon Suisan Gakkai Shi 83, 981–995 (2017) (in Japanese).
39. Nagata, N., Dobashi, T., Manabe, Y., Usami, T. & Inokuchi, S. Modeling and visualization for a pearl-quality evaluation simulator.
IEEE Trans. Vis. Comput. Graph. 3, 307–315 (1997).
Scientific Reports | (2021) 11:15224 | https://doi.org/10.1038/s41598-021-94737-w 9
Vol.:(0123456789)www.nature.com/scientificreports/
40. Dobashi, T., Nagata, N., Manabe, Y. & Inokuchi, S. Implementation of a pearl visual simulator based on blurring and interference.
IEEE ASME Trans. Mechatron. 3, 106–112 (1998).
41. Kubelka, P. & Munk, F. Ein Beitrag zur Optik der Farbanstriche. Z. Tech. Phys. 12, 593–601 (1931).
42. Ishibashi, A. Wave Propagation and Scattering in Random Media (IEEE Press-Oxford University Press, 1997).
43. Born, M. & Wolf, E. Principles of Optics: Electromagnetic Theory of Propagation, Interference and Diffraction of Light (Pergamon
Press, 1964).
44. Ozaki, R., Yoshimoto, A., Watanabe, G., Kadowaki, K. & Odawara, K. Calculation of reflection spectrum with actual layer thickness
profile in nacre of akoya pearl oyster. J. Phys. Conf. Ser. 924, 14–16 (2016).
45. Muhammad, G., Atsumi, T., Sunardi, & Komaru, A. Nacre growth and thickness of Akoya pearls from Japanese and Hybrid Pinctada
fucata in response to the aquaculture temperature condition in Ago Bay, Japan. Aquaculture 477, 35–42 (2017).
Acknowledgements
This research was supported by grants from the Project of the Bio-oriented Technology Research Advance-
ment Institution NARO (the special scheme project on advanced research and development for next-generation
technology).
Author contributions
R.O. conceived the experiments and wrote the manuscript. K.O. prepared the pearls. R.O., K.Kikumoto and M.T.
performed the experiments. R.O. and M.T. performed the optical calculations. K.Kikumoto wrote the code of
the visual simulator. R.O., K.Kadowaki, and K.O. discussed and interpreted the results. The original idea of this
work was created by R.O. All authors contributed to the writing of the manuscript.
Competing interests
The authors declare no competing interests.
Additional information
Supplementary Information The online version contains supplementary material available at https://doi.org/
10.1038/s41598-021-94737-w.
Correspondence and requests for materials should be addressed to R.O.
Reprints and permissions information is available at www.nature.com/reprints.
Publisher’s note Springer Nature remains neutral with regard to jurisdictional claims in published maps and
institutional affiliations.
Open Access This article is licensed under a Creative Commons Attribution 4.0 International
License, which permits use, sharing, adaptation, distribution and reproduction in any medium or
format, as long as you give appropriate credit to the original author(s) and the source, provide a link to the
Creative Commons licence, and indicate if changes were made. The images or other third party material in this
article are included in the article’s Creative Commons licence, unless indicated otherwise in a credit line to the
material. If material is not included in the article’s Creative Commons licence and your intended use is not
permitted by statutory regulation or exceeds the permitted use, you will need to obtain permission directly from
the copyright holder. To view a copy of this licence, visit http://creativecommons.org/licenses/by/4.0/.
© The Author(s) 2021
Scientific Reports | (2021) 11:15224 | https://doi.org/10.1038/s41598-021-94737-w 10
Vol:.(1234567890)You can also read