Statistic Equation to Estimate the Amount of CO2 Emission Produced From High Traffic Density Roads - WSEAS
←
→
Page content transcription
If your browser does not render page correctly, please read the page content below
Rania Rushdy Moussa,
    WSEAS TRANSACTIONS on POWER SYSTEMS                                                Mahmoud M. M. Mansour,
    DOI: 10.37394/232016.2021.16.78                                                     Naglaa Mohamed Yossif

 Statistic Equation to Estimate the Amount of CO2 Emission Produced
                   From High Traffic Density Roads

 RANIA RUSHDY MOUSSA, MAHMOUD M. M. MANSOUR, NAGLAA MOHAMED YOSSIF
                     The British University in Egypt (BUE)
                         El-Sherouk City, Cairo 11837
                                    EGYPT

Abstract: - Energy consumption, especially the energy used for electricity supply has doubled in the past three
decades, causing a drastic increase in the carbon emissions produced. Between 1990 and 2005 globally, the
amount of CO2 emissions increased 25%. It is estimated that vehicles produce approximately 30% of the global
NOx and 14% of global CO2 emissions. Egypt is the fourteenth biggest wellspring of CO2 emissions among all
GEF program nations. It was proven that 66% of CO2 emissions comes from fossil fuel as a primary energy
consuming source, playing a key role in the overall carbon intensity. The problem of this research is that the
roads in developing countries produce a high level of carbon emissions, and the level is increasing due to the
heavy usage of fossil fuels in the transportation sector. This research presents statistical analysis equation to
analyse the amount of CO2 emissions produced from roads without using heavy and expensive equipment’s.
Moreover, the equation can be used as a tool to estimate the amount of CO2 emissions produced from roads
during the design phase in order to improve the design and reduce carbon emissions in roads. According to the
statistics the main factors affecting the amount of CO2 produced in roads are the electricity generations, types
of vehicles and vehicles speed. The research used experimental method to validate the equation by measuring
CO2 emissions in high traffic density road using measuring device and compared the measuring results with the
statistic equation results. The presented equation should help in reducing the amount of CO2 produced in roads,
in return it will help in reducing the growth of global problems such as climate change and ozone depletion.

Key-Words: - Carbon emissions, Vehicles emissions, Electricity generation, Traffic congestions, Air pollution.

Received: February 26, 2021. Revised: April 7, 2021. Accepted: April 9, 2021. Published: April 15, 2021.

1 Introduction                                               short time after that [17]. Since the Industrial
Today, the whole world considers Energy as the               Revolution, a rapid increase CO2 happened due to
major aspect effect urban developments; it is the            consumption of fossil fuel. This has led to many
ruler for all human activities such as industry,             problems as this disturbs the global carbon cycle.
services, housing, agriculture, and transportation.          This disturbance is basically leading to a planetary
Egypt as many countries, depend heavily on                   warming impact. This huge consumption brings
traditional energy sources like crude oil,                   about the generation of carbon dioxide (CO2) [17],
hydroelectric energy and natural gas. According to           Since the Industrial Revolution, a rapid increase
Egyptian-German Private Sector Development                   CO2 happened due to consumption of fossil fuel.
Program, the situation of energy in Egypt is unstable        This has led to many problems as this disturbs the
due to the present or foreseeable descent of natural         global carbon cycle. This disturbance is basically
gas and domestic oil resources [13]. Petroleum in            leading to a planetary warming impact. This huge
Egypt and different liquids production are                   consumption brings about the generation of carbon
diminishing and the consumption demand is                    dioxide (CO2) [17], and since it is a gas absorbing
growing, that means that depending on fossil fuel is         and also emitting thermal radiation, it creates
no longer an option for this country. The production         'greenhouse effect', in addition to other greenhouse
of Egyptian oil decreased for over a decade                  gases. The effect of global warming ranges from
subsequent to reaching a high point in the mid-              different impacts such as: physical, ecological and
1990s for over 900,000 b/d. In 2008, The production          health impacts, including extreme conditions of
grew over the following few years due to the help of         weather as floods, heat waves, storms and floods;
Western Desert and offshore output growth, but               leading to rising in sea-level, water systems
production growth started to diminish again in a             disruptions and altered crop growth [19]. In 2018,

    E-ISSN: 2224-350X                                   78                                    Volume 16, 2021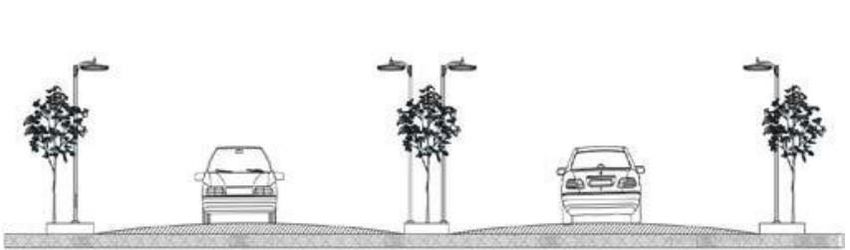
Rania Rushdy Moussa,
    WSEAS TRANSACTIONS on POWER SYSTEMS                                                   Mahmoud M. M. Mansour,
    DOI: 10.37394/232016.2021.16.78                                                        Naglaa Mohamed Yossif

CO2 global energy-related emissions were increased             sources in Egypt is Hydropower. Since 1985 to
1.7% to reach its peak of 33.1 giga tons (Gt) CO2.             around 1995, hydropower added around 28 to 22 %
This was the highest recorded growth rate, and 70%             of the overall produced energy by Power-plants in
higher than the average increase since 2010. The               Egypt, while hydro capacity contributed with 32.4
main reasons behind this drastic raise is the higher           to 21.5% [2]. The Egyptian ministry of Electricity
energy consumption resulting from a booming                    has a plan of building the first hydropower plant in
global economy, and the high-energy demand                     the middle east, reaching a capacity of 2,400 MW
needed to heat or cool some countries [12].                    by the technology of pumped-storage hydropower
The atmosphere concentration of CO2 has risen over             (PSH) at Ataqa Mountain, Red Sea, to harness
the last two centuries, it went from 280 to over 380           resources of renewable energy, Mohamed Shaker
parts per million by volume, and it is still increasing        Said, Minister of Electricity [18]. Egypt has several
daily. The electricity generation sector shared with           wind resources which considered the best in the
40% approximately (12Gt) of the CO2 emissions                  world. Presently, about 550MW of electrical energy
globally, produced from the combustion of fossil               generated in Egypt from Zafarana wind farm
fuels (natural gas, coal and oil) to generate heat that        situated on the Suez Coast Gulf, over Red Sea
is used to power steam-driven turbines. Carbon                 Coastline. Egypt is planning to generate more than
dioxide is the primary cause of heat trapping which            20 % of its power from renewable sources, while
is known as “Greenhouse gas (GHG)”. Heat                       12% will be generated from wind farms by year
trapping or Greenhouse is responsible for global               2025 [15] and [18]. Renewable resources have a big
warming, in addition to other nitrogen and sulphur             prospect in the Middle East, which have remained
oxides responsible for various environmental                   largely not used. There is very big potential for
impacts such as ozone depletion and climatic                   using solar energy in Egypt, its utilization is crucial
changes [1] & [8]. Despite the proof of dangers                for national sustainable development up to the hilt
caused by change of climate, attempts to reduce                of efficiently active energy planning in addition to
carbon emissions still are insufficient, unsuccessful          gradually becoming independent from fossil fuel
and in a lot of countries, does not exist. By year             [7]. That specific truth of solar power, since its
2050, 80% of Carbon emissions need to be reduced               prospect in the MENA region only quite exceeds the
[1], [7]. According to the world resources institute,          demands of global electricity. The towering
globally, the main sources of CO2 emissions are heat           intensity of direct solar radiation (2,000-2,600
and electricity with share of 31%, while agriculture           kWh/m2) in Egypt provides big prospect for solar
share 11%, transportation share 15%, forestry share            energy development, specifically in Upper Egypt
6% and manufacturing share 12%. Energy                         [14] & [18].
production of all types accounts for 72 % of all
emissions. Electricity sector shares approximately             2.1 The Quality of Atmospheric Air
31% of the global CO2 emissions; it is followed by             In Egypt, there are a lot of sources of air pollution,
transportation and industry [5]. The CO2 emissions             same as many countries. However, the formation
which are estimated globally from electrical power             and levels of dust, tiny particles and soot are more
industry were about 12 billion tones/yearly in 2010.           characteristic in Egypt than currently founded in
with shared almost 25% comes from USA, 25%                     different industrialized countries. Several sources
from China, 25% different pioneer countries in                 for those pollutants are open-air waste burning,
industry, and lastly 25% from the rest of the world.           industries and transportation. Cairo is considered
Egypt is in the 30th place. Which produce about 64             one of the most polluted cities due to the rapid
million tons of CO2 emissions each year as a result            urbanization, industrialization and the growing
of electrical power plants (almost 0.5% of emissions           number of vehicles [16]. Not long passed, "episode"
globally) [23]. Some relevant studies can be found             of air pollution occurred during autumn 1999 and
in [11] & [10].                                                early winter 2000 (October 1999 – January 2000).
                                                               Therefore, a program for air quality management
2 Air Quality in Egypt                                         based in scientific basis became pressing issue to
In 2009, Egypt depends heavily on coal as the main             keep air quality in major industrial and urban
source of electricity generation. Egypt is planning to         centres in Egypt. Air pollution is a pressing
increase the growth of renewables in generating                seniority in the development agenda for Egyptian
electricity, to approach total of 20% of energy                government because of peaking levels of locally
generation by 2020, where hydropower is 5.8%,                  emitted pollutants experienced in dense cities. In
wind 12% and for solar energy is 2.2% [1]. One of              Cairo between 1997 & 2004, Air Improvement
the most cheap and clean of power generation                   Project (CAIP), a Source-Attribution-Study (SAS)

    E-ISSN: 2224-350X                                     79                                      Volume 16, 2021
Rania Rushdy Moussa,
WSEAS TRANSACTIONS on POWER SYSTEMS Mahmoud M. M. Mansour,
DOI: 10.37394/232016.2021.16.78 Naglaa Mohamed Yossif
was conducted to characterize the contribution of the transportation sector has a huge share of the
different sources that pollute the air in Egypt. The countries Greenhouse gases due to the heavy use of
study revealed that 32% of air pollution is accounted fossil fuels [3]. In 2004, the transportation sector
from vehicle exhaust [4]. Other researchers also shared with an average of 29.16% of the overall
approved that vehicle exhausts are the mainly energy consumption in Egypt [9]. Moreover, it
dominant source of different pollutants in Cairo like produced around 31.6 million tons of CO2
black Carbon (BC) and the carcinogenic VOCs, Emissions which is approximately 26% of the total
benzene, toluene, ethylbenzene and xylenes CO2 emissions produce from energy generation. The
(BTEXS), and hydrocarbons (HCs) in fine street more the population grows, the more the need for
dust. The Egyptian government arranged some energy in the transportation sector will be needed
procedures to eliminate Greenhouse Gas emissions [2].
in the transportation sector; including the
improvement of the public transport, vehicles fuel 2.4 The Effects of CO2 Emissions on the
efficiency and surveillance on-road vehicle Egyptian Environment
emissions, in the company of different measures. Carbon emissions contribute to climate change,
However, the incorporation of strategies into which can have serious consequences on the
planning and workable achievements is not yet environment, consequently, on humans. The
assessed [2]. problem is that After CO2 is emitted into the
atmosphere, 20% will remain in the atmosphere for
2.2 Percentage of Carbon Emission thousand years, while 40% will remain for hundred
Energy is considered Egypt’s Greenhouse gases years, and the final 10% will take years to turn over.
dominant sector. Within this sector, electricity and This means that the heat trapping emissions released
heat production is responsible for 41%, today from the vehicles and the other mentioned
transportation 24%, manufacturing and construction sources are setting the climate the future generations
17%, other fuel combustion 11%, and fugitive will inherit [15].
emissions 7% of energy sector GHG emissions [24].
According to the International Energy Agency 2.4.1 Acid Rain
(IEA), it was concluded that between 1990 and Acid rain is the scientific term for the excessive
2012, Egypt’s total primary energy supply more ratio of acidity in rain as a result of gases (from
than doubled during this time, with fossil fuels different processes whether industrial or natural)
accounting for 94% and renewable energy sources these gases dissolve in rainwater forming several
with only 4% in 2012 [12]. Egypt's dependence on types of acids. The effect of Carbon emissions is of
hydrocarbons becomes predictable to keep concern as it dissolves in rain, converting into weak
increasing with the continuous social and economic acid, aka Carbonic Acid. The acidity spreads
developments. The increasing in energy demand is through wet and dry deposition. Wet deposition is
relentlessly compelled by 30 urbanizations, growing the most common form of acid rain which usually
output of industry, energy-intensive industries, falls in the form of snow, rain, hail or fog. While the
motor vehicle sales, and energy subsidies. However, particles of acid and gases can precipitation from the
the most rapidly increasing emissions are coming atmosphere during lack of moisture as dry
from the transportation sector, as a result of major deposition. The acidic particles and gases may
dependence on roads and private fuel vehicles used deposit to surfaces (water bodies, vegetation,
as the primary mean for transportation [24]. buildings) fast enough or it can react over transport
of atmosphere to create bigger harmful particles that
2.3 Transportation Sector can affect human health. However, the cumulative
Egypt is considered the largest Arab country, with a acids got washed off the following rain, when that
population of more than 90 million people which happened that acidic rainwater goes through the
makes it the second most populous country in ground, gets a chance to harm plants and wildlife,
Africa. According to research in 2013, the total including insects and fish. The deposited acidity to
number of licensed vehicles in Egypt was 7.04 the ground through dry deposition, mainly depend
million vehicles, and about 50% of them are in the on rainfall quantity that specific area received [21].
Cairo. Almost half of all vehicles in Egypt are cars,
specifically 3.83 million cars. The amount of people 2.4.2 The Rise of Water Level
transported by roads was around 115.6 billion Egypt's Carbon emission rate makes it easily
passengers/km, where the freight transport affected by climatic changes. Moreover, its densely-
amounted to around 43.1 billion tons/km. In Egypt, populated Nile delta is at high risk of raising the sea
E-ISSN: 2224-350X 80 Volume 16, 2021Rania Rushdy Moussa,
WSEAS TRANSACTIONS on POWER SYSTEMS Mahmoud M. M. Mansour,
DOI: 10.37394/232016.2021.16.78 Naglaa Mohamed Yossif
level. The studies of vulnerability estimation by the According to previous studies and to the literature
sector of priority are done as a part of the national presented in this research, the main factors affecting
developments action plan. The study results have the percentage of carbon emission in roads is the
indicated that the coastal zones, agriculture, number and type of vehicles passing through the
fisheries and aquaculture, water resources, roads and the electricity consumed to electrify the
settlements and human habitat, and human health road. According to the studies, these two factors
are most susceptible in order of severity and (electricity consumption and traffic flow) affecting
certainty of results [22]. While other studies the percentage of carbon emission directly and
suggested that during the growth of global indirectly. Directly, the type and number of vehicles
temperatures, this will create growth in Nile River passing through the road affecting the percentage of
evaporation causing inclination of water supply and CO2 while electricity affect the atmospheric
eventually water shortage, that will grow downpour emission through burning fuel to generate electricity
in the Ethiopian highlands (as a result of Egypt and this action may not take place around the road.
upstream) leading to increasing runoff in the Nile The highway roads carbon emissions are produced
River flows downstream in Egypt. from the electricity consumed to power the roads
and from the type and fuel used during vehicles
2.5 Streets and CO2 Emissions motion. Therefore, CO2 model is divided into two
In previous years, governments had less attention on parts; the first is calculating the carbon emissions
the reduction of CO2 Emissions which could be produced from electricity consumption and the
achieved by reducing traffic congestion in the second part is calculating the carbon emissions
Egyptian streets. Previous studies proved that when produced from vehicles motion. In order to calculate
the congestion increases, the CO2 Emissions the carbon emissions using this model, a site survey
automatically increases [3]. That is the reason why, need to be done first to identify the following data;
some guidelines are rules should be set and followed electricity consumption features, traffic density and
in order to reduce any amount of congestions. types of vehicles.
However, the challenge is in how big the Emission
reduction could be 33 when we reduce the 3.1 CO2 Emissions from Electricity
congestions? Different factors exist; which includes Consumptions
the behaviour of individual in driving, type of roads On both sides of highway roads, there are some
and vehicles and the condition of traffic; whether features that consume electricity such as lighting
good or bad [22]. The average emissions produced features, traffic controlling devices, electronic signs
of different types of vehicles in (Lit/Km). The and monitoring cameras. Each of which consumes
results showed that cars produce around 0.24 KG of electricity energy E kilowatt-hours (kWh). The
CO2 Emissions, a bus produce around 0.60 kg of energy E in (kWh) per day is equal to the power P in
CO2 Emissions and a motorcycle produce around watts (W) times’ number of usage hours per day t
0.10 kg of CO2 Emissions in 1 km. However, some divided by 1000 watts per kilowatt as shown in
vehicles could differ depending on its weight, power equation (3.1).
and other factors [3] & [9].
E(kWh=day) = P(W) x t(h/day)/1000(W/kW). (3.1)
3 Carbon Emission Statistical
Equation Table [1] and figure 1, represents the average grams
of CO2 emitted to produce one kWh of electricity
To calculate the carbon emissions in roads and
and heat using various energy sources as shown in
streets, heavy and expensive equipment’s are
table 1, the data varies depending on the
required and it is only used in existing sites. In this
performance of power plants.
section the research will present a new model for
measuring CO2 emission as result of electricity
Table 1. CO2 emitted against various energy
consumption and vehicles motion in highway roads
sources [20]
that has length L Kilometers (km).
This model can also estimate the average of CO2 Fi Fuel CO2 g/kWh
emission produced from a designed and under i=1 Other bituminous coal 840
construction highway roads by considering two i=2 Sub bituminous coal 930
main variables, these variables are the average i=3 Lignite brown coal 950
traffic density and the amount of electricity i=4 Patent fuel 860
consumed in the highway roads. i=5 Natural gas 380
E-ISSN: 2224-350X 81 Volume 16, 2021Rania Rushdy Moussa,
WSEAS TRANSACTIONS on POWER SYSTEMS Mahmoud M. M. Mansour,
DOI: 10.37394/232016.2021.16.78 Naglaa Mohamed Yossif
Type of Fuel VS CO2 emission
1000
800 knowing rgj and rdj, respectively. The values of
CO2 g/kWh
600 rgj and rdj can be found in [4].
400
3.3 Example (Simulated Data)
200
Data in this example is collected across four stages
0 Other Sub as following in Tables 2,3,4 and 5, through highway
Lignite Natural
bituminou bituminou Patent fuel
s coal s coal
brown coal gas has length L = 10km: On other hand the number of
CO2 g/kWh 840 930 950 860 380 light poels A = 4000; each of which has power
P = 500W and the number of usage hours per day is
Fig.1. Amount of CO2 produced from different type t = 12h: If the energy source is Natural gas, then
of fuel [21] F5 = 380g/kWh emitted carbon. Using Equation
(3.2) and (3.3), then.
Then for any fuel source Fi,i = 1,2,…,5, the CO2
emission (CE) as result of usage electricity Table 2. CO2 emission from 12 am. to 6 am. based on
consuming features such as lighting features, traffic vehicles:
controlling devices, electronic signs and monitoring Gasoline Diesel
cameras in highway of length L is shown in g1 (BMW) No. of (g1) = 7 d1 (Chevrolet) No. of (d1) = 30
equation (3.2). g2 (Fiat) No. of (g2) = 12 d2 (Mazda) No. of (d2) = 50
g3 (Ford) No. of (g3) = 4 d3 (Honda) No. of (d3) = 44
CEe(A,E,Fi)=AEFi (3.2)
g4 (Honda) No. of (g4) = 32 d4 (Volvo) No. of (d4) = 12
g5 (Jeep) No. of (g5) = 16 d5 (Kia) No. of (d5) = 16
3.2 CO2 Emissions from Vehicles Motion
In this model, two types of vehicles are considered. g6 (Volvo) No. of (g6) = 10
The first type of vehicles moved by gasoline and is
divided into g1, g2, …, gn according to the type of Using Equation (3.3): CEvm (g,d) = ……..g emitted
vehicle such as Honda, Ford, etc. Each one of these carbon.
types has fuel consumption rate rg1, rg2, …., rgn,
(mile per gallon). The second type of vehicles Table 3. CO2 emission from 6 am. to 12 pm. Based on
moved by diesel and is also divided into d1, d2, …., vehicles:
dm according to the type of vehicle, each one of Gasoline Diesel
these types has fuel consumption rate rd1, rd2, …., g1 No. of (g1) = 27 d1 No. of (d1) = 30
(Mitsubishi) (Chevrolet)
rdm, (mile per gallon). Then the CO2 emission as a g2 (Fiat) No. of (g2) = 12 d2 (Mazda) No. of (d2) = 50
result of the motion of two types of vehicles g3 (Ford) No. of (g3) = 24 d3 No. of (d3) = 44
(operating by gasoline (g) and diesel (d)) in highway (Mercedes-
of length L is given as shown in equation (3.3). Benz)
g4 (Honda) No. of (g4) = 52 d4 (Volvo) No. of (d4) = 12
g5 (Jeep) No. of (g5) = 36 d5 (Kia1) No. of (d5) = 43
CEvm(g,d) = L(∑nj=1 [No. of (gj)] x C(rgj) + ∑ mj=1 g6 (Volvo) No. of (g6) = 20 d6 (Kia2) No. of (d6) = 50
[No. of (dj)] x C(rdj)). (3.3)
Using Equation (3.3) CEvm (g,d) = ……..g emitted
Where C (rgj ) represent the grams of CO2 per km as carbon.
a result of fuel consumption rate rg1(mile per
gallon) and C (rdj ) represent the grams of CO2 per Table 4. CO2 emission from 12 pm. to 6 pm. Based on
km as a result of fuel consumption rate rdj (mile per vehicles:
gallon). From Equations (3.2) and (3.3), the CO2 Gasoline Diesel
emission (in gram) as a result of electricity g1 (BMW) No. of (g1) = 7 d1 No. of (d1) = 30
consumption and vehicles motion through highway (Chevrolet)
has length L is shown in equation (3.4). g2 (Fiat) No. of (g2) = 12 d2 (Tesla) No. of (d2) = 50
g3 (Nissan) No. of (g3) = 4 d3 (Honda) No. of (d3) = 44
CE = CEe(A,E,Fi) + CEvm(g,d) g4 (Honda) No. of (g4) = 32 d4 (Volvo) No. of (d4) = 12
= AEFi + L (∑nj=1 [No. of (gj)] x C(rgj) + [No. of g5 (Jeep) No. of (g5) = 16 d5 (Kia) No. of (d5) = 43
(dj)] x C(rdj)), i = 1, 2,…,5. (3.4) g6 (Volvo) No. of (g6) = 10
The two terms C(rgj ) and C(rdj ) can be
computed using the following source [3], after Using Equation (3.3) CEvm (g,d) = ……..g emitted
carbon.
E-ISSN: 2224-350X 82 Volume 16, 2021Rania Rushdy Moussa,
WSEAS TRANSACTIONS on POWER SYSTEMS Mahmoud M. M. Mansour,
DOI: 10.37394/232016.2021.16.78 Naglaa Mohamed Yossif
Table 5. CO2 emission from 6 pm. to 12 am. Based on
vehicles:
Gasoline Diesel
g1 (BMW) No. of (g1) = d1 No. of (d1) = 40
17 (Chevrolet)
g2 (Fiat) No. of (g2) = d2 (Mazda) No. of (d2) = 60
22
g3 (Mazda) No. of (g3) = d3 (Toyota) No. of (d3) = 10
14
g4 (Honda) No. of (g4) = d4 (Volvo) No. of (d4) = 12
52
g5 (Mercedes- No. of (g5) = d5 (Kia1) No. of (d5) = 13
Benz) 36
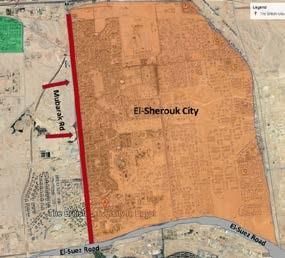
g6 (Volvo) No. of (g6) = d6 (Kia2) No. of (d6) = 50 Fig.2: The location of Shuhada Road [16].
20
d7 (Honda) No. of (d7) = 25
Using Equation (3.4) CEvm (g,d) = ……..g emitted 4.2 Components of Shuhada Road
carbon. Using Equation (3.5) the CO2 emission (in Shuhada Road is a main two directional road; as
gram) as a result of electricity consumption and shown in figure 3. Each direction has four lanes
vehicles motion through highway has length L = with a total width of 10m. There is a pedestrian
10km is........g carbon on a random day. sidewalk on the right side of each direction with a
total 1 meter width and 20 cm height. Moreover,
CEe (A, E, F5) = 4000 x (500 x 12/24 x 1000) x 380 there is a landscape strips that cuts the street into
= 38 x 1010 g emitted carbon. (3.5) two directions with 1m width and 20cm height as
shown in figure 3.
4 Experimental Method
In order to validate the statistical equation, the
project team purchased CO2 measuring device to
measure the amount of CO2 in high traffic density
road in Cairo, Egypt and to compare the device
reading with the data produced from the statistical Fig.3: A section View for Shuhada Road [19]
equation.
Lighting units exist on the both sides with 35 meters
between each lighting unit. The total number of
4.1 Study Area
lighting units is 456 units in each direction. Trees
The study area of this research is Shuhada Road.
and shrubs exist in the street Landscape strips.
This road used to be called Mubarak road which
was named attributed to President Mubarak, the
name of the road has been change to Shuhada Road 4.3 Equipment
after the Egyptian revolution in June 2013 which The Activity of vehicle will
means Martyrs. Shuhada Road located in El- be measured by
Sherouk city, Cairo-Egypt. Shuhada Road has been electrochemical sensor for CO
chosen to be the study area of this research due to measurement and a shock-
the availability of data and because it is a crowded resistant infrared CO2 sensor.
road that links Ismalia-Cairo desert road with Sues- The instrument used (testo
Cairo desert road, 315-3) is equipped to resist
Shuhada Road is considered the main road in El- external influences by its
Sherouk city, knowing that El-Sherouk city is one of robust design and the
the most crowded new suburbs in Cairo, it includes optionally available TopSafe, Fig.4. Testo 315-3
many public facilities, the most important facilities device is shown in figure 4.
in this suburb is the two private high educational During the measurement, optical and audible signals
facilities which are “the British university in Egypt shows immediately whether the variably adjustable
(BUE)” and “El-Sherouk Academy” and both of limit values have been exceeded.
them are located on Shuhada Road as shown in
figure 2. 4.4 Field Measurements
The case study focused on one direction only. Two
types of field measurements took place in this
E-ISSN: 2224-350X 83 Volume 16, 2021Rania Rushdy Moussa,
WSEAS TRANSACTIONS on POWER SYSTEMS Mahmoud M. M. Mansour,
DOI: 10.37394/232016.2021.16.78 Naglaa Mohamed Yossif
research, the first field measurement was targeting magnitude of the carbon emissions. The expected
the number of vetches crossing Shuhada road as a results are going to be compared by the
data input for the statistical equation. Four experimental results.
monuments were collected from Shuhada road; each The following notations are used in the proposed
measurement presents the number of cars, algorithm:
motorcycle, big vehicles such as (bus and tracks) as L = 0.015; (* L in meters represents the range of the
shown in Table 6. While the second field used instrument for measuring the amount of CO2
measurement were made by the research team and it (ppm)*) m = 4; (* No.of times for conducting the
measures the amount of CO2 in Shuhada road using experiment *) Y = {410.5, 419, 396, 433}; (*real
Testo 315-3 measuring instrument as shown in values registered by the instrument at four different
Table 6. periods of time.
Table 6. CO2 emitted against various energy
sources. 5 Results and Discussion
Duration Vehicle Number of CO2 Readings
According to the presented study, the presented
type Vehicle from Testo 315-3
measuring statistical equation will help in estimate the amount
instrument of carbon produced in specific road.
2:50– Car 251 406-415 ppm This research conducted a comparative analysis to
2:55 pm validate the presented statistical equation and to
Motorcycle 3
Truck 10 measure its efficiency and percentage of error.
Bus 2 As shown in Table 7, the results of CO2 readings
Microbus 2 from Testo 315-3 measuring instrument compared
2:55– Car 153 419 ppm to results from Statistical equation. As stated before
3:00 pm Motorcycle 3
Truck 8
the equation data input depended on field survey,
Bus 13 were the researchers counted the number and types
Microbus 8 of vehicles passed through the road in specific date
3:00-3:05 Car 177 396 ppm and time. However, the differences between both
pm Motorcycle 2 results are expected human errors, as shown in the
Truck 3 following Table 7.
Bus 5
Microbus 3
3:05-3:10 Car 184 433 ppm Table 7. Comparison between of CO2 statistic
pm Motorcycle 4 equation and the reading of measuring device
Truck 12 Duration Vehicle Number CO2 Statistical
Bus 2 type of Readings equation
Microbus 8 Vehicle from results
measuring
device
4.5 Calculating CO2 in Shuhada Road Using 2:50– Car 251 406-415 415.583
Statistical Equation 2:55 pm Motorcycle 3 ppm ppm
In order to calculate the amount of CO2 emissions in Truck 10
Shuhada roads, input data should be added to the Bus 2
equation to help the equation in calculating the CO2 Microbus 2
emissions. The data inputs are the different types of 2:55– Car 153 419 ppm 436.776
vehicles operating by gasoline or diesel, and the 3:00 pm Motorcycle 3 ppm
number of verticals passing through the road in 30 Truck 8
minutes. While the data outputs are the amounts of Bus 13
carbon emissions through four different periods of Microbus 8
3:00-3:05 Car 177 396 ppm 313.828
time on a certain day. The presented statistical pm ppm
Motorcycle 2
equation is based on the multivariate linear
Truck 3
regression method, the multivariate linear regression
Bus 5
method is one of the statistical methods used for Microbus 3
curve fitting and recently is considered as one of the 3:05-3:10 Car 184 433 ppm 487.065
Machine Learning methods. pm Motorcycle 4 ppm
An algorithm is implemented by Mathematica 12.1 Truck 12
software depending on the concept of the Bus 2
multivariate linear regression method to estimate the Microbus 8
E-ISSN: 2224-350X 84 Volume 16, 2021Rania Rushdy Moussa,
WSEAS TRANSACTIONS on POWER SYSTEMS Mahmoud M. M. Mansour,
DOI: 10.37394/232016.2021.16.78 Naglaa Mohamed Yossif
As shown in table 7, the percentage of error has References:
minimum of 2.3% and maximum error of 12.75% as [1] Abdallah, L. and El-Shennawy, T. (2013).
comparing the results of CO2 readings from Testo Reducing Carbon Dioxide Emissions from
315-3 measuring instrument and results from Electricity Sector Using Smart Electric Grid
Statistical equation. Applications. Journal of Engineering, 3, pp.1-8.
According to similar research’s using similar Available at:
variables (vehicles types and electricity https://www.hindawi.com/journals/je/2013/8450
consumption) to calculate the CO2 emissions using 51/ (Accessed 15 July 2020).
statistical equations, the percentage of errors reach [2] Ahmed, E. (2015). ‘Egypt's Policies for
20% [6]. Moreover pervious research indicates that sustainable transport’, UNCTAD secretariat,
the green space along the high traffic roads had pp.1-35 (report). Available at:
affected positively the CO2 absorption. Increasing https://unctad.org/meetings/en/Contribution/Ess
the greenery around the high traffic density roads am%20H.M.%20AHMED.pdf (Accessed 15
can mitigate the direct CO2 emissions produced by July 2020).
the urban transportation [25] and [3]. [3] Barth, M. and Boriboonsomsin, K. (2009)
Traffic Congestion and Greenhouse
6 Conclusion Gases. ACCESS Magazine, 1(35), pp.2-9.
In conclusion vehicles have huge effects on the Available at:
amount of emissions produced in Egyptian https://escholarship.org/uc/item/3vz7t3db
(Accessed 28 July 2020).
roads. The proposed equation will help urban
[4] CAIP (2000), Ambient PM2.5, PM10 and lead
planners and designers to estimate the amount measurements in Cairo, Egypt, CAIP reports,
of CO2 produced from roads during the design EEAA, Cairo.
process in which it will help in designing better [5] Center for climate and energy solutions. (2017).
roads and decrease the traffic congestions. Global emissions. World Resources Institute.
Traffic congestion causes the driver to start-stop [6] Chang, C. and Lin, T. 2018. Estimation of
the vehicle which causes the vehicle to produce Carbon Dioxide Emissions Generated by
more CO2 Emissions than smoother driving. Building and Traffic in Taichung City.
The amount of CO2 emissions produced from Sustainability 2018, 10, 112
passenger vehicles, play a predominant role in [7] DOE (US Department of Energy). (2010) “The
the CO2 emissions of urban on-road Smart Grid: an estimation of the energy and
CO2 benefits”. January, pp.1-172. Available at:
transportation, and more traffic CO2 emissions
https://energyenvironment.pnnl.gov/news/p
are derived from the private transportation than
df/PNNL-19112_Revision_1_Final.pdf
those of the public transportation in urban
(Accessed 28 July 2020).
roads. [8] EIA (U.S. Energy Information Administration).
Well-designed streets and maintain the street (2017) How much carbon dioxide is produced
quality, decrease the traffic congestions which per kilo watthour when generating electricity
will lead to decrease the emissions emitted in with fossil fuels? Available at:
the air from traffic congestion that reflects on https://www.eia.gov/tools/faqs/faq.cfm?id=
human health through polluting the 74&t=11 (Accessed 3 May 2020).
environment and causing sever health effects. [9] El-Dorghamy A. (2015) Fuel Economy and CO2
Emissions of Light-Duty Vehicles in Egypt.
Acknowledgements Centre for Environment and Development in the
The authors would like to acknowledge the Arab Region and Europe (CEDARE). pp.1-26.
Available at: http://web.cedare.org/wp-
support and contribution of the STDF (STIFA)
content/uploads/cedareimages/gfei_morocco_re
in this work. As part of the STDF Project port_feb08_final__english.pdf (Accessed 28
entitled, “The Role of Smart Streetscape Design July 2020).
on Reducing the Roads Carbon Emission in [10] Garcés, E.F.M., Herrera, J., Mafla, G.M. and
Egyptian Neighborhoods”, Project ID#33460. Caiza, A.F.M. 2019. Artificial Neuronal
Networks To Predict The Emissions of Carbon
Dioxide (CO2) using a Multilayer Network with
the Levenberg-Marquadt Training Method.
E-ISSN: 2224-350X 85 Volume 16, 2021Rania Rushdy Moussa,
WSEAS TRANSACTIONS on POWER SYSTEMS Mahmoud M. M. Mansour,
DOI: 10.37394/232016.2021.16.78 Naglaa Mohamed Yossif
WSEAS Transactions on Environment and [20] SunEarth Tool.com. 2021. Retrieved from:
Development, 16, 346-354. https://www.sunearthtools.com/tools/CO2-
[11] HSU, T-K. 2020. The Effect of Trade Openness emissions-calculator.php#top (April 6, 2021).
on Carbon Dioxide Emission in Taiwan: A [21] Tetra TechGreen Streetscapes Study, HOPE
Quantile Mediation Analysis. WSEAS Community Development Area, Washington,
Transactions on Environment and Development, 2009, pp. 3–25.
16, 434-439. (April 2,
Report. Retrieved 2019, from International 2021).
Energy Agency : [22] UNDP, United Nations Development
https://www.iea.org/geco/emissions/ Programme (2011) Improving the energy
[13] Janet, L.S. and Lisa, M. (2010) Prospects of the efficiency of lighting and other building
Renewable Energy Sector in Egypt Focus on appliances. Institution Name Cairo, Egypt. p.
Photovoltaic and Wind Energy. Egyptian- Available at:
German Private Sector Development https://www.ise.fraunhofer.de/content/dam/ise/e
Programme. Cairo, Egypt. P. Available at: n/documents/publications/studies/Fraunhofer-
https://sciforum.net/manuscripts/589/original.pd ISE_LCOE_Renewable_Energy_technologies.p
f (Accessed 25 June 2020). df (Accessed 7 July 2020).
[14] Knies, G., Mölle, U. and Straub, M. (2009) [23] UNFCCC. (2010). Egypt Second National
Clean power from deserts: The Desertec Communication under the United Nations
concept for energy, water and climate security. Framework Convention on Climate Change.
DESERTEC Foundation, pp.1-34 Available at [24] USAID. (2015). Greenhouse Gas Emissions in
http://www.chemtrailsgeelong.com/uploads/DE Egypt. Retrivied from:
SERTEC.pdf (Accessed 07 June 2020). file:///C:/Users/Rania/Downloads/GHG%20Emi
[15] Moussa, R.R., and Mahmoud, A.H., (2017). ssions%20Factsheet%20Egypt_v6_11_02-
Energy-scape Elements: An Approach on 15_edits%20(1)%20Steed%20June%202016_re
Integrating Landscape Elements with v08-19-2016_Clean.pdf (Accessed 10
Renewable Energy Devices. Journal of Cleaner December 2020).
Production, 153; 114-130. Retrieved from: [25] Zheng, J., Dong, S., Hu, Y., and Li, Y. 2020.
https://www.sciencedirect.com/science/article/pi Comparative analysis of the CO2 emissions of
i/S0959652617305127. expressway and arterial road traffic: A case in
[16] Moussa, R.R. (2019). The Effect of Piezo- Beijing. Plos One. Retrieved from
Bumps on Energy Generation and Reduction of https://doi.org/10.1371/journal.pone.0231536.
the Global Carbon Emissions. WSEAS
Transactions on Environment and Development, Contribution of individual authors to
15(46); 430-437. Retrieved from:
http://www.wseas.org/multimedia/journals/envir
the creation of a scientific article
onment/2019/a905115-474.pdf (ghostwriting policy)
[17] Moussa, R.R., Mahmoud, A.H., and Hatem,
T.M. (2020). A digital tool for integrating Dr. Rania Rushdy Moussa, has implemented the
renewable energy devices within landscape empirical Study.
elements: Energy-scape online application. Dr. Mahmoud Mansour has created the equation and
Journal of Cleaner Production, 254; 1-13. the statistical analysis
[18] NREA. (2016) New Renewable Energy Eng. Naglaa has collected data and organized the
Authority. Ministry of Electricity & Energy, manuscript.
Arab Republic of Egypt. Pp. Available at:
http://www.nrea.gov.eg/ (Accessed 15 July Creative Commons Attribution License 4.0
2020). (Attribution 4.0 International, CC BY 4.0)
[19] Ritchie, H., & Roser, M. (2017, May). CO₂ and
Greenhouse Gas Emissions. Retrieved 2018, This article is published under the terms of the Creative
Commons Attribution License 4.0
from Our World in Data: https://creativecommons.org/licenses/by/4.0/deed.en_US
https://ourworldindata.org/co2-and-other-
greenhouse-gas-emissions
E-ISSN: 2224-350X 86 Volume 16, 2021You can also read


