St. Joseph County 2021 Housing Plan - Three Rivers ...
←
→
Page content transcription
If your browser does not render page correctly, please read the page content below
St. Joseph County
2021 Housing Plan
                 Prepared for
  St. Joseph County Human Services Commission

                 Prepared by
     Southcentral Michigan Planning Council

           Adopted March 9, 2021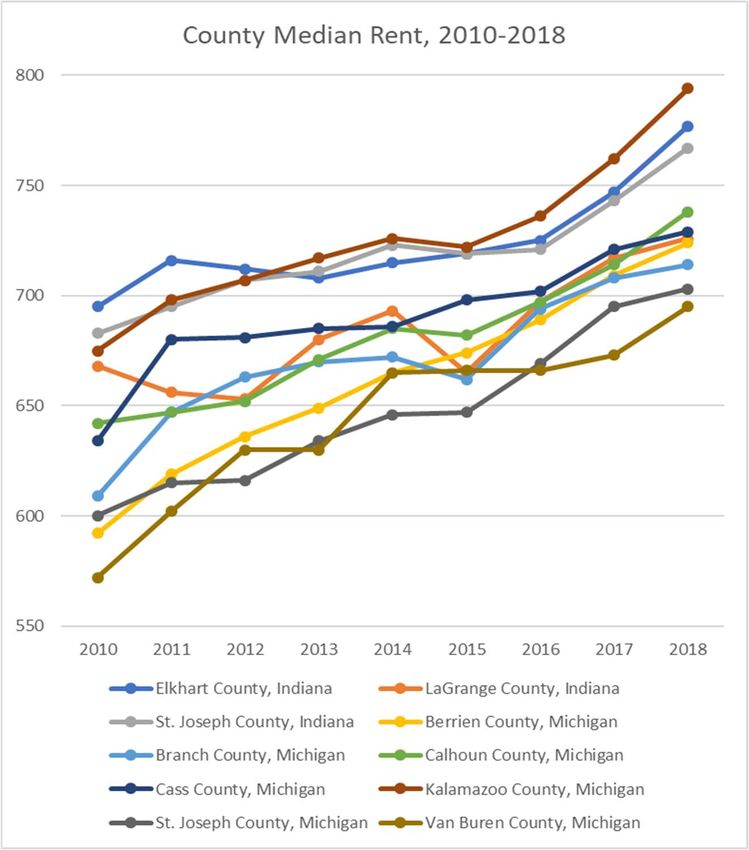
ST. JOSEPH COUNTY 2021 HOUSING PLAN
Contents
Chapter 1: Introduction .................................................................................................................................... 4
Overview ......................................................................................................................................................................... 4
Vision ................................................................................................................................................................................ 4
Approach to Creating This Plan .................................................................................................................................. 4
Chapter 2: Existing Conditions ....................................................................................................................... 5
Overview and Summary of Findings .......................................................................................................................... 5
Demographic Conditions ............................................................................................................................................... 6
Demographic Changes ........................................................................................................................................... 9
Movers and Migration ......................................................................................................................................... 10
Economic Conditions .................................................................................................................................................... 11
Labor Force ........................................................................................................................................................... 11
Income ..................................................................................................................................................................... 15
Incomes and Housing Affordability................................................................................................................... 17
Commuting ............................................................................................................................................................. 18
Housing Conditions ...................................................................................................................................................... 19
Housing Supply ..................................................................................................................................................... 19
Housing Quality .................................................................................................................................................... 21
Housing Costs and Housing Security ................................................................................................................. 22
Regional, State, and National Context .................................................................................................................. 28
Regional Conditions ............................................................................................................................................. 28
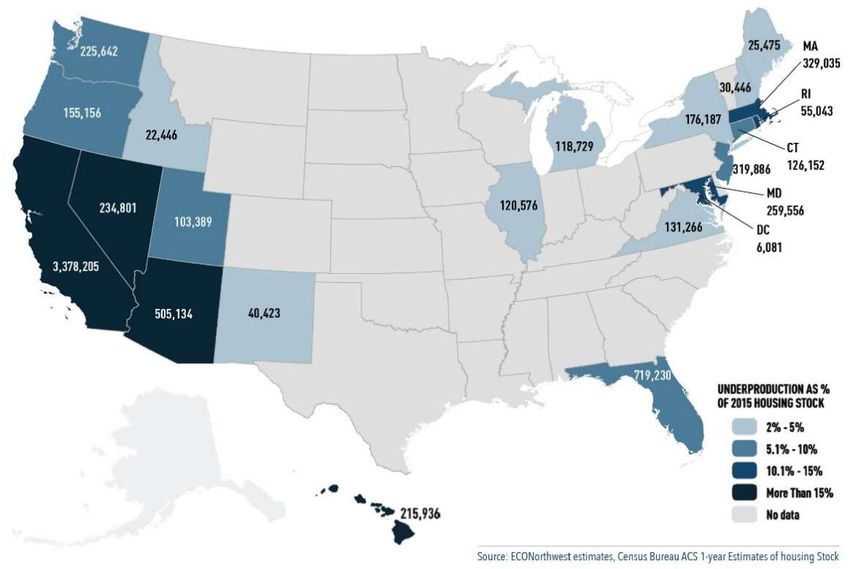
Statewide and National Contexts ........................................................................................................................... 34
Demographic Conditions ..................................................................................................................................... 34
Economic Conditions ............................................................................................................................................. 35
Housing Conditions ............................................................................................................................................... 35
Strengths and Challenges of The Housing Ecosystem .......................................................................................... 37
Summary ....................................................................................................................................................................... 38
Chapter 3: Goals, Objectives, and Strategies.......................................................................................... 39
Overview ...................................................................................................................................................................... 39
Goals, Objectives, and Strategies for the St. Joseph County Housing Ecosystem ......................................... 39
Goal 1: Maintain a diversity of housing options for all residents of St. Joseph County........................ 39
Goal 2: Increase available housing in the county for those who most need options with less
maintenance, for the long-term health of the entire community.................................................................. 41
Goal 3: Collaborate to better promote the county’s amenities to potential residents .......................... 43
Summary ....................................................................................................................................................................... 43
ST. JOSEPH COUNTY 2021 HOUSING PLAN 2
ST. JOSEPH COUNTY 2021 HOUSING PLAN

Chapter 4: Plan of Action ............................................................................................................................. 44
   Overview ...................................................................................................................................................................... 44
   Maintain Relationships................................................................................................................................................ 44
   Sharing Data ................................................................................................................................................................ 45
   Priority Action Steps, Key Partners, and Timelines for the Next Five Years ................................................... 46
         Goal 1: Maintain a diversity of housing options in St. Joseph County ...................................................... 46
         Action Step: The Housing Steering Committee creates an Inventory of Housing Assets ............................ 46
         Action Step: Local governments evaluate how zoning ordinances can more effectively guide housing
         developments.......................................................................................................................................................... 47
         Goal 2: Increase available housing options in the county for those who most need options with less
         maintenance, for the long-term health of the entire community.................................................................. 48
         Action Step: Stakeholders collaborate to expand senior homeowners’ access to maintenance resources48
         Action Step: Local jurisdictions and the Housing Steering Committee identify opportunities to increase
         rental options in the county .................................................................................................................................. 49
         Action Step: The Housing Steering Committee supports workforce training programs that increase local
         employment opportunities that support the health of the county’s housing ecosystem ............................... 51
         Goal 3: Collaborate to better promote the county’s amenities to potential residents .......................... 52
         Action Step: Stakeholders increase collaborative efforts to promote the county’s existing amenities ..... 52
   Five-Year Data Projections ....................................................................................................................................... 54
   Overview ...................................................................................................................................................................... 54
   Demographic and Economic Projections ................................................................................................................. 54
   Housing Projections ..................................................................................................................................................... 55
   Performance and Evaluation Measures .................................................................................................................. 57
   Summary ....................................................................................................................................................................... 58
Chapter 5: Adoption of the Plan ................................................................................................................. 59
   Preparation and Adoption ........................................................................................................................................ 59
   Partners ......................................................................................................................................................................... 59
Appendix A: Shared Data and Housing Asset Inventory Data .............................................................. 61
Appendix B: Existing Plans that Impact Housing in St. Joseph County.................................................. 62

 ST. JOSEPH COUNTY 2021 HOUSING PLAN                                                                                                                                                3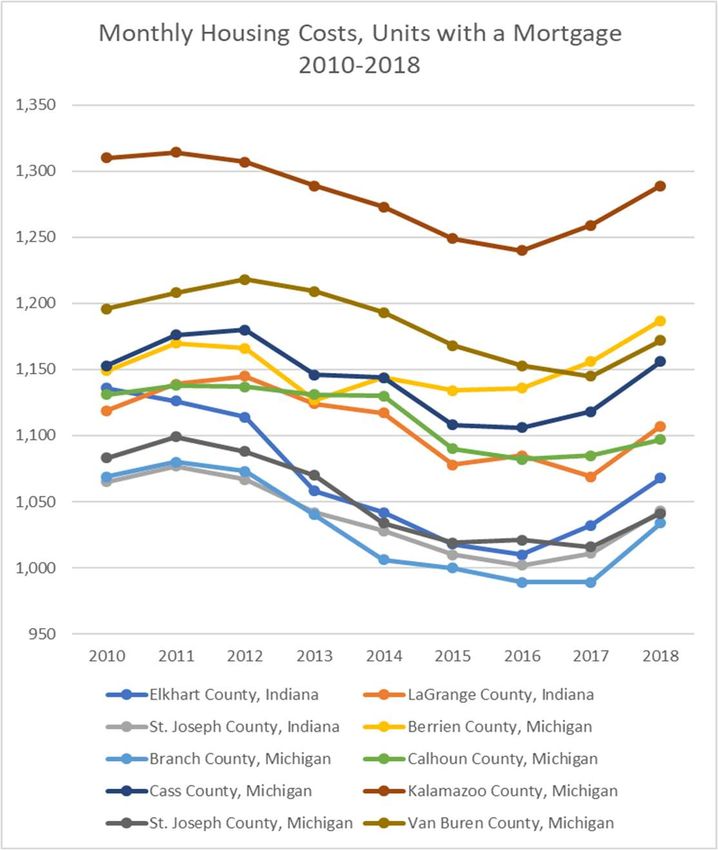
Chapter 1: Introduction
Overview
This chapter explains the shared vision for the future of housing in St. Joseph County, the history of
the methodological approach, and the partners who have contributed to the creation of this plan.
Vision
St. Joseph County is a welcoming place for people of all ages who enjoy life on the water, rural
living, and small-town character. The housing ecosystem of the county has a range of options for
new and current residents, and owners maintain their homes for future generations. Residents,
businesses, organizations, and governments work together to address housing issues because they
recognize that the county’s housing stock is a shared community asset. This plan is a living
document that stakeholders use to achieve this vision and guide the future of the county’s housing
ecosystem. The plan’s aims are to maintain a diversity of housing options for all residents, to
increase available housing options for those who most need options with less maintenance, and to
promote residents’ and visitors’ appreciation for St. Joseph County’s unique amenities.
Approach to Creating This Plan
In 2019, the St. Joseph County Housing Services Commission brought together government,
business, and nonprofit leaders with its Housing Task Force to address the complexity of needs in
the county’s housing ecosystem. Stakeholders decided that the county needed a comprehensive
housing plan to form a shared vision around how to address housing challenges and opportunities
across the entire county. The purpose of this plan is thus to guide the future investments and efforts
that are required sustain the health of St. Joseph County’s housing ecosystem. The planning
process was initiated by the St. Joseph County Human Services Commission (SJCHSC) which
formed a Housing Plan Steering Committee in partnership with their existing Housing Task Force to
guide the direction of the plan. SJCHSC also
contracted with the Southcentral Michigan
Planning Council (SMPC), the regional FINANCIAL CONTRIBUTORS
planning organization for St. Joseph County,
to prepare the plan. The planning approach
these leaders agreed to was collaborative City of Sturgis
and based on consensus. The following City of Three Rivers
entities contributed financial resources in Community Action
support of the planning process: KeyStone Place
St. Joseph County Government
Southcentral Michigan Planning Council
Southwest Michigan Prosperity Committee
ST. JOSEPH COUNTY 2021 HOUSING PLAN 4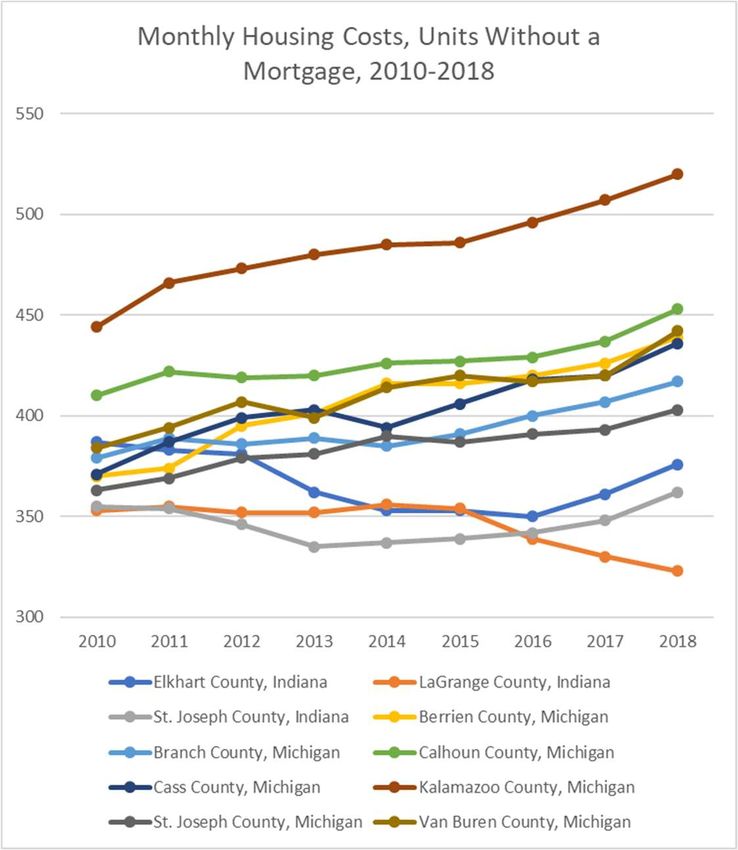
Chapter 2: Existing Conditions
Overview and Summary of Findings
This chapter presents data on the existing conditions of the county’s residents, workers, and
housing stock, as well as regional and national contexts. These conditions directly inform the
strengths, opportunities, and challenges of the county’s housing ecosystem. A brief summary of
findings is presented here.
Since 2000, the total county population has decreased while the median age of the county’s
residents has increased. This reflects an aging population, out-migration of mobile workers, and
changing demands on the housing ecosystem. Homeowners represent the largest portion of the
county’s households, but the number of renter households has been steadily increasing over the
last 20 years, even as prices have increased. As housing construction has slowed, more families
and seniors have remained in their homes for longer, fewer new houses were built, the supply of
homes available for sale decreased, and the demand for rental housing increased.
Economic conditions impact the housing ecosystem as well. The county’s unemployment rates have
been decreasing steadily over time, but employment opportunities differ by place, racial identity,
and age. Incomes have been steadily rising in the last decade and are comparable to nearby
counties, but workers are also more willing to move around the region in search of better
employment opportunities and higher wages. Lower incomes of residents and declining labor
force participation rates have caused increased demand for affordable housing options.
Future housing demand is projected to come from households without children in the home, renters,
and particularly from people over 65 years old. These folks will need affordable housing options,
likely in the form of smaller homes and rental units, but currently detached, single-family units
make up most of the county’s current housing stock. The mismatch between the county’s housing
stock and demand will be exacerbated unless efforts are made to diversify the county’s housing
products. Housing options near amenities and jobs would serve these populations best. Providing
senior homeowners with more low-maintenance housing options would also help make more
existing single-family homes available for purchase to potential new residents.
The major take-aways from this chapter indicate next steps that can be taken to ensure the
continued health of the county’s housing ecosystem. Since the current mix of housing does not
position the county to grow, housing stakeholders should prioritize preservation and partnerships.
Preservation of existing housing assets ensures that there are opportunities to settle new residents
in stable housing in the future, while partnerships expand local capacity for development. Since
the health of the housing ecosystem and of the county’s workforce are connected, local
jurisdictions, housing stakeholders, employers and other partners should establish shared priorities.
Local jurisdictions should stabilize and maintain their existing housing assets, and prepare for
future residential development. Ultimately, working in partnership across many sectors will
provide the most resources for preserving the long-term health of the county’s housing ecosystem.

 ST. JOSEPH COUNTY 2021 HOUSING PLAN                                                               5
Demographic Conditions
Significant shifts in the county’s population have changed the demand for housing in the past
twenty years. Since 2000, the county’s overall population has gradually declined by about 1,500
people. Most of the county’s local jurisdictions have maintained or lost population, with the only
exception being southwest Fabius Township. Since 2010, the largest population declines have
occurred in the villages and townships of Constantine and Burr Oak.

                                   Total Population, St. Joseph County
                             Sources: Decennial Census and ACS 5YR Est. DP05
                                 Year                  Total Population
                                 2000                    62,422
                                 2005                    62,273
                                 2010                    61,848
                                 2015                    61,022
                                 2018                    60,897

This slow, downward population trend is expected to continue in the near future, with no
Census tract showing significant growth through 2025.1 Stakeholders will need to strategically
invest in the county’s housing supply in order to bring the housing ecosystem into balance with
current and future population demands.

1   Claritas 2020
    ST. JOSEPH COUNTY 2021 HOUSING PLAN                                                           6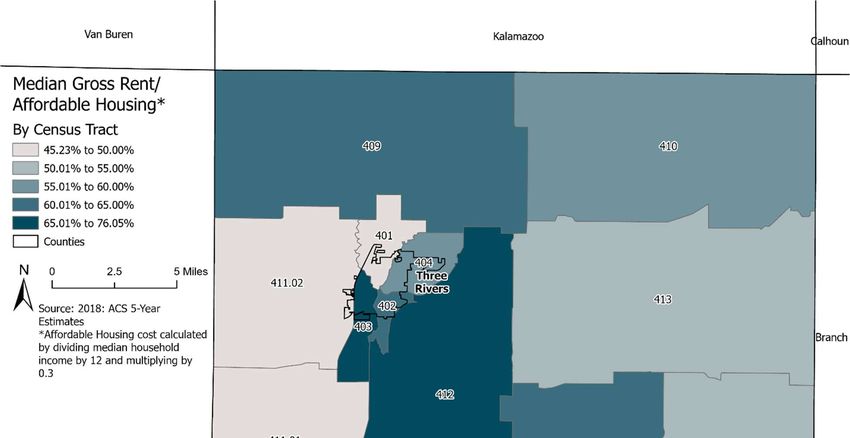
Map 1: Population Density by Census Tract in St. Joseph County, 2018

The following table breaks down past and projected population changes by Census tract, in order
to demonstrate the different housing challenges that will be faced across the county. Tracts that
have recently seen growth are likely to continue to grow in population, while tracts that have lost
population are likely to see continued decline, although at a slower rate.

 ST. JOSEPH COUNTY 2021 HOUSING PLAN                                                             7
Total Population, St. Joseph County Census Tracts, 2010, 2018, and 2025 Projections
                              Source: ACS 5YR Est. DP05; Claritas 2020
                                                                             2025        Projected
     Place Name                                            Percent
                             2010          2018                            Projected      Percent
                                                        Change from
    (Census Tract)        Population     Population                       Population      Change
                                                       2010 to 2018
                                                                                        from 2018
Northern Three Rivers
                            3530          3622           +2.6%              3680         +1.6%
 and Lockport Twp.
  SE. Lockport Twp.         1874          1912           +2.0%              1933         +1.1%
   SW. Fabius Twp.          2963          3074           +3.7%              3132         +1.9%
   Three Rivers; NE
                            2249          2226            -1.0%             2228           0%
    Lockport Twp.
      SE. Sturgis           2791          2790             0%               2805         +0.5%
     SW Sturgis             3077          3074             0%               3095         +0.7%
     NW Sturgis             3233          3202            -1.0%             3214         +0.4%
      NE Sturgis            3317          3317             0%               3342         +0.8%
  Park & Flowerfield
                            4289          4235            -1.3%             4233           0%
        Twps.
Leonidas Twp, Mendon
                            3681          3609            -2.0%             3597         -0.3%
   Village & Twp.
Constantine Village &
                            4299          4169            -3.0%             4142         -0.6%
        Twp.

   W. Fabius Twp.          3103           3178           +2.4%              3226         +1.5%

    Florence Twp.          3023           2964            -2.0%             2960         -0.1%

 Colon and Nottawa
                            6786          6880           +1.3%              6949         +1.0%
       Twps.

  White Pigeon and
  Mottville Twps.; E.       4979          4993           +0.3%              5019         +0.8%
     Centreville

    Sherman Twp.           4372           4251            -2.8%             4226         -0.6%

  Burr Oak & Twp.          3729           3610            -3.2%             3585         -0.7%

ST. JOSEPH COUNTY 2021 HOUSING PLAN                                                                  8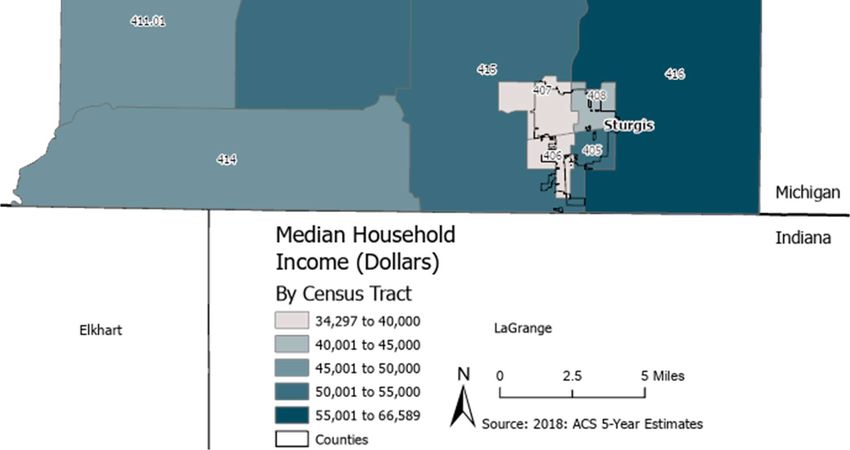
Demographic Changes
Residents’ age, gender, and racial identities can influence their housing preferences and their
ability to own a home. The most significant demographic change since 2000 was the increase in
the county’s median age. While the proportions of individuals in the county who identify as Black
and White have both declined since 2010, individuals with Hispanic/Latino identities, some other
racial identity, and individuals with multiple racial identities have increased in that same time.
Most households continue to be occupied by families, with extended family living situations
being more common in rental households. Older, single-person households have also become more
common in recent years.
                    Racial Identities in St. Joseph County. 2010 & 2018
                                Source: ACS 5-YR Est. S0701
                                                    % Change       Change in Proportion of
                         2010          2018         within Each    Population Represented
                                                    Population       from 2010 to 2018
 American Indian and      251           213            -15%                  0%
 Alaskan Native
 Asian                    345           304            -12%                  0%
 Black or African        1763           1309           -26%                -0.7%
 American
 Native Hawaiian,         807           1575          +95%                 +1.3%
 Pacific Islander,
 Some other race
 Hispanic or Latino      3770           4567          +21%                 +1.4%
 Origin
 Two or more races       1000           1818         +81.8%                +1.4%
 White                  54024          52185          -3.4%                -1.8%

         Median Age and Gender Balance in St. Joseph County. 2000, 2010, & 2018
                         Sources: Decennial Census and ACS Est.
  Year        Median Age       Percent Male       Percent Female    Average Household
                                                                          Size
  2000           35.6              49.4%              50.6%               2.63
  2010           38.0              49.5%              50.5%               2.71
  2018           39.7              49.7%              50.3%               2.59

These changes indicate that residents may have housing needs that are not being served by the
units that are currently offered. Different housing types might serve their needs better, like
multigenerational, small, and low maintenance options. Unless potential residents young and old
find a diversity of housing products to choose from in St. Joseph County, they may look elsewhere
to buy a home. To prevent future population loss, the county’s housing stock must meet the needs
of both an aging population and young working adults, so that these groups continue to establish
households in the county.

 ST. JOSEPH COUNTY 2021 HOUSING PLAN                                                            9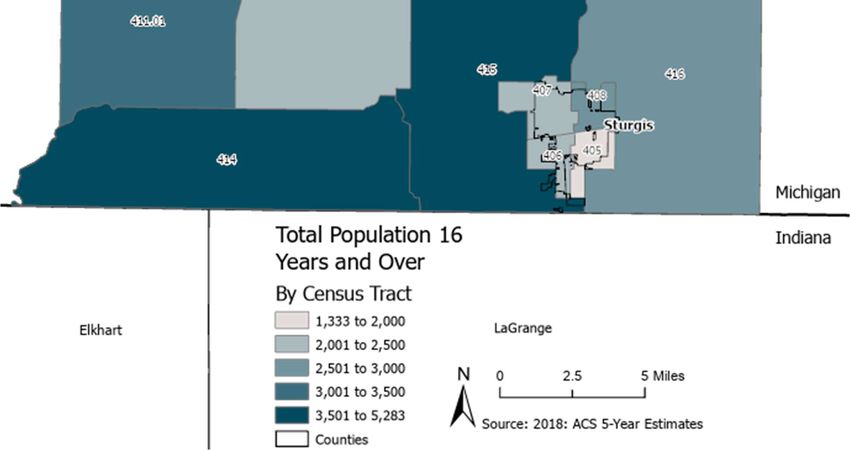
Movers and Migration
The decline in the county’s overall population (-339 people) from 2010 to 2018 has been driven
by people moving out of the county to other places in the United States. The greatest amount of
movers’ traffic has historically happened between Kalamazoo and St. Joseph Counties, both in-
bound and out-bound directions. From 2017 to 2018, however, out-migration slowed significantly,
resulting in a slight increase in the county’s overall population. Since about 2016, in-migration of
households has increased from out of state and from most bordering counties. The majority of
recent movers are young, and under 30 years old. Employment transitions have been the primary
drivers of moving into or out of the county, and a majority of recent movers live in rental housing. 2
Focus group participants reported challenges finding affordable, quality housing for both
professionals and seniors in the county. Some reported that local professionals were driving in
from Indiana or Kalamazoo to work in the county, presumably because they could not find the
types or quality of housing that they wanted in St. Joseph County. In response to this finding, the
steering committee members wished to prioritize housing maintenance and new residential
construction equally in this plan. Although labor, land, and materials shortages could slow new
housing development in the near future, stakeholders in St. Joseph County can still take action to
stabilize the population, maintain housing assets, and prepare for future development.
Ensuring stability of current residents and encouraging in-migration will both be critical to
maintaining healthy demand in the county’s housing ecosystem, as well as for the security of
government tax revenues. The county’s housing stakeholders can help encourage migration
through a number of collaborative strategies, such as supporting effective workforce development
programs (to increase residents’ earnings potential); and developing incentives for family co-
housing, accessory units, and deed transfer (to encourage return migration). Equally important will
be the need to plan for how the housing ecosystem responds to future emergencies such as natural
disasters or pandemics like COVID-19, to ensure that people experiencing homelessness and
vulnerable households can access shelter when it is most critical.
Considering the median incomes of recent migrants and the
IMPLICATIONS OF RECENT potential impacts of COVID-19, additional affordable
MIGRATION TRENDS homes will be needed in the county. In particular, there are
opportunities to provide more stable housing to some of
the many renter households that frequently move around
Out-migration drove within St. Joseph County. Smaller homes, such as tiny homes
population loss until 2017
and barn-do-miniums, ‘workforce housing,’ and homes in
Employment transitions drove the $125,000 to $180,000 price range could help some of
most migration
the county’s current renters move into homeownership,
Workforce training, disaster
because these options are more affordable. 3 Moving more
planning, in-migration
people to stable, permanent housing would also free up
incentives, and construction of
new, affordable ownership rental properties for potential migrants into the county, and
options are needed provide opportunities to offer residents financial and
homeowner education.
2 ACS 5YR Est. S0701
3 Prices based on area median incomes.
ST. JOSEPH COUNTY 2021 HOUSING PLAN 10Economic Conditions
Economic conditions have significant impacts on the county’s housing ecosystem because they in
part determine the quality and quantity of housing that residents can afford. This section
examines the labor force, income, and commuting trends in St. Joseph County and connects these
to the housing ecosystem, in order to uplift development and investment strategies that could
positively impact both employment and residential opportunities.
Labor Force
The characteristics of the county’s labor force determines the opportunity for employment and
earnings, which control what folks can spend on housing. 4 The labor force participation rate is the
number of employed and unemployed people in the labor force over 16 years old, divided by
the total civilian noninstitutional population. Residents of St. Joseph County in their 20s, 30s,
and 40s have the highest rates of participation in the labor force, and are also more likely to
have higher incomes.
Labor Force Participation Rates by Age
in St. Joseph County, 2010-2018
100
90
80
70
60
LFPR (%)
50
40
30
20
10
0
2010 2011 2012 2013 2014 2015 2016 2017 2018
Year
16 to 19 years 20 to 24 years 25 to 29 years 30 to 34 years
35 to 44 years 45 to 54 years 55 to 59 years 60 to 64 years
65 to 74 years 75 years and over
4 Bureau of Economic Analysis
ST. JOSEPH COUNTY 2021 HOUSING PLAN 11Educational attainment is a key determining factor of residents’ employment opportunities as well.
Most of the county’s workers only have a high school diploma and some college experience.
This indicates that some workers would be good candidates for workforce training programs that
help them keep their skills updated and increase their potential to receive higher earnings.
Housing stakeholders can help by supporting programs that provide high school graduates and
young adults 16-to-24 years old with skill training and highlight the county’s career pathways.
Training programs offered by Michigan Works!, St. Joseph County ISD, and Glen Oaks
Community College are targeted at strengthening workers’ participation in the labor force. These
institutions could also be potential supporters of residential development projects.
Educational Attainment of Labor Force Ages 25-64
in St. Joseph County, 2018
15% 12%
38%
35%
Less than high school graduate, 12% High school graduate (includes equivalency), 38%
Some college or associate's degree, 35% Bachelor's degree or higher, 15%
Examining unemployment rates by age and racial identities shows how residents differ in their
ability to access employment opportunities in the county. A positive trend is that unemployment
rates for all ages and all racial identities has been decreasing over the last decade. While
Hispanic and Latino residents have seen the greatest decrease in unemployment rates since 2010,
Black and African American residents of the county have consistently had the highest
unemployment rates. Unemployment rates have also differed by age, with members of the labor
force over 45 years old having much lower rates of unemployment than individuals under 25
years old. Addressing these discrepancies in unemployment would not only help to increase
residents’ incomes, but also could enable more people to establish households in the county before
they seek employment elsewhere.
ST. JOSEPH COUNTY 2021 HOUSING PLAN 12Unemployment Rates by Racial Identity and Year
in St. Joseph County
45
40
35
Unemployment Rate
30
25
20
15
10
5
0
2010 2011 2012 2013 2014 2015 2016 2017 2018
Year
American Indian and Alaska Native Asian
Black or African American Hispanic or Latino origin (of any race)
Some other race Two or more races
White
Unemployment Rate by Age Group
St. Joseph County
45
40
35
30
25
20
15
10
5
0
2010 2011 2012 2013 2014 2015 2016 2017 2018
16 to 19 years 20 to 24 years 25 to 29 years
30 to 34 years 35 to 44 years 45 to 54 years
55 to 59 years 60 to 64 years 65 to 74 years
75 years and over
ST. JOSEPH COUNTY 2021 HOUSING PLAN 13Production, transportation, material moving; management, business, science and arts; sales
and office occupations have been the most common in the county from 2010 through 2018.
Service occupations have become increasingly more numerous as well.5 The largest industry in St.
Joseph County has historically been manufacturing, and this industry still represented nearly 39%
of employment in 2018. Educational services, healthcare, and social assistance represented the
second biggest industry, or 16.7% of employment in 2018. Retail trade is the third most
represented employment industry, with 8.5% of employment in 2018.
Major Occupations in St. Joseph County
2010-2018
30000
25000
20000
15000
10000
5000
0
2010 2011 2012 2013 2014 2015 2016 2017 2018
Production, transportation, and material moving occupations:
Natural resources, construction, and maintenance occupations:
Sales and office occupations:
Protective service occupations:
Healthcare support occupations
Healthcare practitioner and technical occupations:
Education, legal, community service, arts, and media occupations:
Computer, engineering, and science occupations:
Management, business, and financial occupations:
One industry whose land interests may conflict with future residential and workforce development
is agriculture. While farming, fishing, and forestry represent only 1% of county occupations, a
significant portion of land in the county is prime farmland or farms of local importance, and the
majority of land area in the county is dedicated to agriculture. Low-density residential (LDR)
development is one type of land use that tends to encroach upon cropland, and thus the tradeoffs
of allowing this type of development in farm areas should be carefully considered. 6
5 ACS 5YR Est. S2401
6 American Farmland Trust 2020
ST. JOSEPH COUNTY 2021 HOUSING PLAN 14Income
The county’s overall household median income increased from $44,392 in 2010 to $50,117
in 2018, which is an encouraging positive trend. The median incomes of all age groups in the
county have increased since 2010. The tables below break down further the county’s median
incomes by age groups and racial identities of householders.
Median Incomes by Age Group of Householders, 2010 & 2018
Source: ACS 5YR Est. S1903
2010 Median Percent of 2010 2018 Median Percent of 2018
Income Households Income Households
Ages 15-24 $33,125 3.6% $36,875 5.3%
Ages 25-44 $50,453 32.7% $52,230 29.3%
Ages 45-64 $52,231 39.4% $60,788 38.1%
Ages 65+ $29,269 24.3% $38,067 27.3%
Median Household Incomes by Racial Identities, 2010 & 2018
Source: ACS 5YR Est. S1903
Racial Group 2010 Median Income 2018 Median Income
American Indian/Alaska Native $53,750 $26,304
Asian $47,228 $75,333
Black/African American $38,482 $25,776
Hispanic/Latino $35,087 $34,400
Two or more races $71,389 $46,779
White $45,103 $51,030
Entire County $44,392 $50,117
ST. JOSEPH COUNTY 2021 HOUSING PLAN 15Map 2: Median Household Incomes by Census Tract in St. Joseph County, 2018 ST. JOSEPH COUNTY 2021 HOUSING PLAN 16
Incomes and Housing Affordability
The standard metric of housing affordability is that residents do not pay more than 30% of their
household income for housing costs. Considering the data above, an idea of affordable housing
expenses can be drawn out. A household earning the area median income of $50,117 could
afford to spend around $1,250 per month on housing costs. However, the charts above
indicate that affordable housing costs vary across the county by age and race. Median
monthly housing costs in 2018 ranged from $403 in homes without a mortgage; to $703 gross
rent; to $1,041 in homes with a mortgage. While this may appear affordable, many households
who currently rent earn less than the median income and could not afford a mortgage and down
payment for a newly constructed home in St. Joseph County. To help make ownership an option
for these folks, they will need either options for increasing their income, down payment support, or
help building equity and savings.
In the regional housing market, St. Joseph County has competitive median incomes compared
to its neighboring counties. While this has potential benefits for employers, it also means that
residential developers may be drawn to work in more urbanized areas where folks with higher
incomes can afford to spend more on housing costs. The county’s household incomes may also be
held down in the near future as more residents in the 55-to-64 year age group enter retirement
over the next decade. A strategy that could address this challenge would be for housing
stakeholders in economic and workforce development to find ways to partner with regional
employers to provide stable, living-wage jobs and career pathways for young residents, in order
to grow opportunities for employment, home ownership, and residential development
simultaneously in the county.

 ST. JOSEPH COUNTY 2021 HOUSING PLAN                                                            17
Commuting
Job opportunities have a significant impact on where people live. Census commuter data reveals
how many people enter, leave, or remain in the county for work. 7 From 2015 to 2017, more
people living in the county commuted out for work, while the overall number of people employed
in the county declined. The county needs to maintain a steady supply of quality jobs that retain
residents and attract new talent to relocate in St. Joseph County for work.

                                                         Worker Flows in St. Joseph County, 2015 to 2017
                                      16,000

                                      14,000
     Number of Private Primary Jobs

                                      12,000

                                      10,000

                                       8,000

                                       6,000

                                       4,000

                                       2,000

                                          0
                                                               2015                                 2016                                2017
                                                                                                    Year

                                               Employed and Living in the Selection Area           Living in the Selection Area but Employed Outside
                                               Employed in the Selection Area but Living Outside

7   ACS 5YR Est. S0801; OnTheMap Inflow/Outflow Analysis
    ST. JOSEPH COUNTY 2021 HOUSING PLAN                                                                                                                18
Housing Conditions
This section looks at how housing conditions in St. Joseph County have changed in the last 20
years, creating a shortage of affordable rental properties and a surplus of low value, single-
family homes. Housing security has been steadily increasing for homeowners, while rents are
going up for others. Partnerships are needed to address critical issues like homelessness.
Housing Supply
Since 2000, the majority of the county’s households have been occupied by owners. While the
number of owner-occupied households has remained fairly consistent since then, however, vacant
and rental households have also increased. The county’s rental vacancy rate has declined from
21 percent in 2010 to only 2.9 percent in 2018, indicating a growth in demand for rental
properties. This demand is projected to increase in the next several years, which makes the rental
market integral to the future health of the housing ecosystem. However, five-year projections show
an increase in the county’s vacant housing units of all types.8 This indicates that there is a
disconnect between supply and demand for housing that will need to be addressed by both new
construction and preservation of existing high-quality homes.
Number of Renter, Owner, and Vacant Households, St. Joseph County. 2000, 2010 & 2018
Source: Decennial Census QT-H1; ACS 5 YR Est. DP04
Year Owner-Occupied Households Renter-Occupied Households Vacant Units
2000 17,986 5,395 3,122
2010 17,523 5,721 4,534
2018 17,816 6,206 3,850
5 Year Projections, Number of Renter, Owner, and Vacant Households, St. Joseph County
Source: Claritas 2020
Year Owner-Occupied Households Renter-Occupied Households Vacant Units
2025 17,628 5,825 4,833
8 Claritas 2020
ST. JOSEPH COUNTY 2021 HOUSING PLAN 19Map 3: Total Housing Units by Census Tract in St. Joseph County ST. JOSEPH COUNTY 2021 HOUSING PLAN 20
Housing Quality
The size, age, and value of residential structures are key determinants of housing quality. The size
of homes in the county is typical for the region with the vast majority of homes of all types having
two to three bedrooms. The typical housing unit size is a reflection of the county’s average
household sizes between 2.6 and 2.7 people, as well as the single-family home standard and the
age of housing stock in the county.9
Over 22,000 housing units, or 79% of the county’s existing housing stock, were built before
1990. This follows national trends – in 2018, the National Association of Home Builder’s median
age of housing was 37 years; but Michigan’s median age was higher, between 40 and 47 years.
The age of the housing stock indicates two potential challenges to the county’s housing ecosystem
– the first being that older homeowners, many of whom have paid off their mortgages, are
choosing to stay in their homes for longer. There may also be few options in the county for aging
residents to safely and comfortably downsize from their single-family-sized homes; and indeed,
this is supported by anecdotal evidence from focus groups. The second challenge is that
residential construction has slowed significantly since the 1990’s, due to higher material prices,
labor shortages, and recessions.
Another key determinant of the quality of housing is its value. The median value of a home in St.
Joseph County was $115,100 in 2018. The countywide estimate disguises spatial and quality
differences in value, however. Housing values are affected by differences in incomes,
demographics, government policy, housing quality, quality of life, and distances to economic and
job centers.10 7,568 (or 43%) of 17,816 owner-occupied homes in 2018 were valued at less than
$100,000.11 Geographically, the median home values of owner-occupied properties in eastern
Lockport Township, west Sturgis, and Three Rivers were also below $100,000. In contrast, the
highest median home values of owner-occupied units in 2018 were found in western Fabius
Township, Park Township, Flowerfield Township, Colon Township, and Nottawa Township.
There are tradeoffs to having so many low-value homes in the county. While they can be easier
to purchase due to a lower price, sometimes they can require a lot of investment to make livable.
This can make it more difficult for homes to turn over to new owners since it increases their up-
front costs. It also puts housing units at risk of losing value if they do not turn over. Current and
potential residents may look elsewhere if they cannot find quality housing in the county; and
according to focus group participants, this is already occurring. The county’s low-value homes
might instead get bought by outside investors, something that has been increasingly happening
across America since the Great Recession. Because of the conditions of these homes, absentee
investors often are incentivized to divide units into rentals and let the properties further degrade.
In a time where new development is likely to remain infrequent, it is crucial to preserve as many
existing properties and as much local ownership as possible. Local jurisdictions must identify their
priorities for household stabilization, preservation, or demolition, in order to invest their limited
resources in a way that will preserve the value of the most homes.

9 ACS 2018 5YR Est. DP04
10 De Bruyne and Van Hove 2013
11 ACS 5YR Est. DP04

    ST. JOSEPH COUNTY 2021 HOUSING PLAN                                                           21
Housing Costs and Housing Security
The county’s owner-occupied households tend to be more financially secure in their housing costs
than renter-occupied households. In 2018, 65 percent of homeowners with a mortgage paid less
than 25% of their household incomes toward housing. On the less secure side, more than 18
percent of homeowners with a mortgage are considered severely cost burdened, paying more
than 35% of their incomes toward housing.12 Since 2010, owner households have become
increasingly more secure, and the number of owner households reported as severely cost
burdened has gradually been decreasing since 2013.
Median Owner Costs with and without a Mortgage in St. Joseph County, 2000, 2010, & 2018
Source: Decennial Census; ACS 5 YR Est. DP04
Year Median Owner Costs with a Mortgage Median Owner Costs without a Mortgage
2000 $768 $229
2010 $1,083 $363
2018 $1,041 $403
Number of Owner Households with a Mortgage
by Monthly Housing Costs as Percent of Income
St. Joseph County, 2018
1971
Less than 20.0 percent
20.0 to 24.9 percent 593
25.0 to 29.9 percent
5504
30.0 to 34.9 percent 1216
35.0 percent or more
1532
12 ACS 2018 5YR Est. DP04
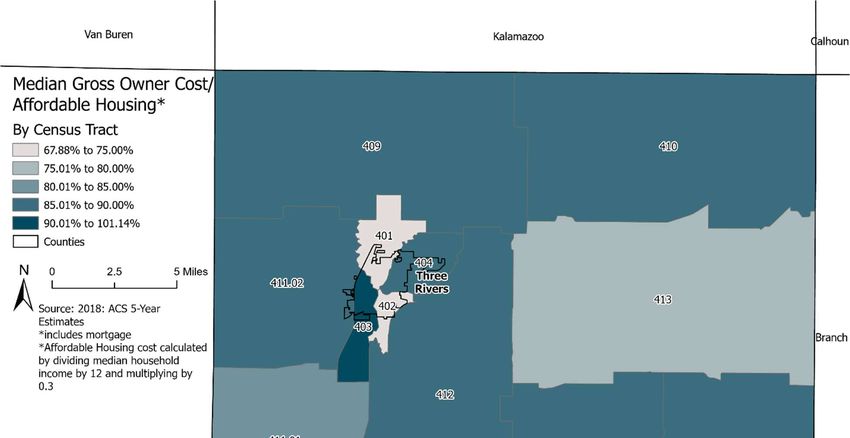
ST. JOSEPH COUNTY 2021 HOUSING PLAN 22The map below shows the differences in affordability of the county’s mortgaged housing units by Census tract. The map shows the percentage of housing units with a mortgage in each Census tract that are affordable, based on the median household income. Affordable housing prices were calculated by dividing the annual median household income in each Census tract by 12 months, and then multiplying that number by 30%, which is the standard metric of affordability. 13 The map compares these affordable prices to the cost of existing mortgaged housing units in each Census tract. The map shows that most owner-occupied housing in the county is affordable, but especially so in tracts 403, 406 and 407. In contrast, the least affordable options for homeownership are found near Three Rivers and Sturgis, in Census tracts 401, 402, and 405. Development of affordable homeownership options would thus be best suited in and around these tracts. Development near these core cities would also locate housing close to amenities like shops and schools, which would serve to attract both seniors and young professionals with families. Map 4: Percent Affordable Owner-Occupied Units by Census Tract in St. Joseph County, 2018 13 ACS 2018 5YR Est. S1901 ST. JOSEPH COUNTY 2021 HOUSING PLAN 23
The county’s renters are in a slightly more difficult financial situation than owners. 47 percent of
the county’s renters paid less than 25% of their incomes toward rent in 2018, but 31.3 percent of
renters were severely cost burdened, spending 35% or more of their incomes on housing costs.
The folks who rent and earn these low incomes tend to be 15-24 years old, or over 65, and
Hispanic or Latino. Two positive trends show that the number of renter households paying less than
15 percent of their incomes on housing costs has increased since 2013, and that the number of
severely burdened renter households has decreased in that time as well. However, as of 2018 still
more than 30 percent of all renter households are severely burdened. Focus group participants
supported this concern by sharing that the county’s seniors have experienced difficulties finding
affordable rental options nearby in recent years.

            Median Rental Housing Costs in St. Joseph County, 2000, 2010, & 2018
                          Source: Decennial Census; ACS 5 YR Est. DP04
                      Year                            Median Rental Costs
                         2000                                  $460
                         2010                                  $600
                         2018                                  $703

                             Number of Renter Households by
                         Monthly Housing Costs as Percent of Income
                                  St. Joseph County, 2018

                                                                   1056

              Less than 15.0 percent        1780
              15.0 to 19.9 percent
              20.0 to 24.9 percent
              25.0 to 29.9 percent                                          818

              30.0 to 34.9 percent
              35.0 percent or more
                                             503
                                                                     800
                                                       730

 ST. JOSEPH COUNTY 2021 HOUSING PLAN                                                            24
The map below shows the differences in affordability of the county’s rental properties by Census tract. The map shows the percentage of rental units in each Census tract that are affordable based on the median household income. Affordable rent prices were calculated by dividing the annual median household income in each Census tract by 12 months, and then multiplying that number by 30%, the standard metric of affordability. The map shows that the most affordable units are south of Three Rivers, in Census tracts 403 and 412, and around Sturgis, while the least affordable units are found in Census tracts 401, 411.01, and 411.02. Census tracts 401, 413, 414, 415, and 416 currently have the highest concentration of middle- and low-income workers, so affordable housing developments should be targeted in and around these Census tracts. Map 5: Percent Affordable Rental Units by Census Tract in St. Joseph County, 2018 ST. JOSEPH COUNTY 2021 HOUSING PLAN 25
The more income a household must spend on housing, the greater their risk of experiencing
eviction, poverty, and homelessness. Furthermore, the more that an owner or renter spends on their
housing costs, the less that resident will have to spend on keeping up their homes, as well as
transportation, food, healthcare, and other expenditures that support local businesses and
industries. In the last 20 years, the nation’s renters have tended to have both stagnant incomes
and increasing rent prices, which have contributed to their greater housing insecurity. 14 The large
share of renting households spending significant portions of their incomes on housing underscores
the need for continued coordination of affordable residential development across the county.
Another way to consider affordability is to examine different levels of housing security. Levels of
security are determined by the portion of income that residents spend on their housing, including
those who do not have enough income to maintain housing. While residents may experience
multiple levels of housing security over time, the ideal is for them to progress towards becoming
more secure, eventually purchasing their own home. Examining the levels of security can reveal the
interconnectedness of the county’s housing ecosystem and help stakeholders identify where the
greatest housing needs are in the county.
                       Levels of Housing Security in St. Joseph County, 2010 & 2018
                         Households by Housing Access and Incomes Spent on Housing
                             Source: Keystone Place; ACS 5YR Est. B25074, DP04
                                                             2010                      2018
                                                    (Number of households)     (Number of households)
         Literally Homelessness Population                   276                       424

 Severely burdened renters, spending >50%
                                                        Owners and Renters            1,160
            of income on housing
                                                     Spending >35% of income
      Burdened renters, spending 35-49% of               on housing: 4,927             620
                income on housing
      Somewhat burdened renters & owners,
                                                                1,591                 1,214
      spending 30-35% of income on housing
     Comfortable, spending 20-29% of income
                                                                5,419                 5,007
                    on housing
      Very secure, spending less than 20% of
                                                                9,929                 12,786
                income on housing

Although it is good news that the number of households that are very financially secure has been
increasing since 2010, several of the county’s residents are already experiencing the challenges
of housing insecurity. According to the county’s only homeless shelter, the number of individuals
experiencing homelessness in St. Joseph County has increased from 2010 to 2018. The Housing
Task Force currently convenes on a monthly basis to perform the Continuum of Care functions for
the county, to target housing support services to those most in need, and to coordinate efforts

14   Matthew Desmond, 2015, Institute for Research on Poverty
 ST. JOSEPH COUNTY 2021 HOUSING PLAN                                                                26
across many organizations. The work of this task force is vital, but its stakeholders only focus on one portion of the housing security spectrum. To encourage change in the county’s housing ecosystem, a broader platform for collaboration is needed to connect stakeholders and strategies across all levels of housing security. Several promising strategies for systematically addressing homelessness in the county could be implemented with the support of stakeholders beyond the Housing Task Force (HTF). Local jurisdictions should consider modifying their zoning to allow developers to build smaller and more affordable housing units in the county. This would make homeownership more feasible for some middle-income residents who are currently renting, which could free up existing rental properties for others. Small homes could also provide rapid shelter to people experiencing homelessness, or during an emergency situation. In Salinas, California, clusters of small homes coupled with supportive services have been developed on underutilized land to provide shelter to people experiencing homelessness.15 In St. Joseph County, this model could be replicated if churches provide the excess land and nonprofits provide the services, but broader collaboration with community partners and the HTF would also be required to implement and sustain this type of intervention. A few urgent housing security issues will necessitate broader collaboration among housing stakeholders. Around 30 percent of the county’s residents lost their jobs since the onset of COVID- 19, and this could increase their risk of experiencing housing insecurity. To counteract this risk, housing stakeholders will need to collaborate with partners across different sectors to prevent eviction, to help residents find work to maintain their incomes, and to address the racial inequities exacerbated by the coronavirus. Cross-sectoral partnerships will help identify funding streams and strategies that can make supportive housing more secure and resilient in the future, especially for teens experiencing homelessness. Housing stakeholders will also need to build relationships with employers, developers, and property owners to ensure that the county’s rental housing units that currently receive federal subsidies remain affordable once that support expires. 16 These urgent needs highlight not only the need for broader collaboration but also for building capacity around housing. The result of these efforts will be the development of local housing expertise and a wider range of partners engaged in helping the Housing Task Force address the challenges they currently face alone. 15 R3, http://www.r-three.org/prison-partnerships.html 16 National Low-Income Housing Coalition 2020 ST. JOSEPH COUNTY 2021 HOUSING PLAN 27
Regional, State, and National Context
Regional, state, and national data reveal how the county’s housing market is connected to and
affected by broader trends. This knowledge is necessary when determining appropriate
interventions and strategies for the housing ecosystem because local stakeholders must know which
aspects of the housing ecosystem are under their control.
Regional Conditions
While county-level data have already revealed many important aspects of the housing
ecosystem, it is also important to examine how nearby counties’ housing markets function for two
reasons. First, the St. Joseph County housing market does not function in a vacuum, but is constantly
affected by what happens in nearby markets. Second, much of the migration to and from St.
Joseph County happens between neighboring counties. To gain a broader perspective on the
regional housing market, this section will compare St. Joseph County to several counties that
surround it: Berrien, Branch, Calhoun, Cass, Kalamazoo, and Van Buren Counties in Michigan;
and Elkhart, LaGrange, and St. Joseph Counties in Indiana. Several tables with analysis are
presented in this chapter to summarize and highlight key issues.
Almost all the counties in Michigan experienced a decrease in population over time, while all the
counties in Indiana have increased their populations. Both Kalamazoo and St. Joseph County, IN,
are home to colleges and universities, which attract residents as students and employees from
across the nation, and are therefore outliers in this comparison. A mobile workforce links St.
Joseph County to its bordering counties in Indiana, however. Elkhart County, IN, attracted a net
positive number of migrants from southwest Michigan border counties from 2010 through 2013,
but since 2016 the county has actually lost more population to these Michigan counties than it has
gained.17 This recent in-movement presents an opportunity to encourage these residents to
deepen their roots and establish households in the county.
                     Southwest Michigan County Populations. 2000, 2010, & 2018
                              Source: Decennial Census and ACS Est. DP05
     Year    Berrien    Branch      Calhoun        Cass      Kalamazoo St. Joseph         Van Buren
             County     County       County       County       County      County          County
     2000   162,453      45,787     137,985       51,104       238,603       62,422        76,263
     2010   156,813      45,248     136,146       52,293       250,331       61,295        76,258
     2018   154,807      43,584     134,473       51,460       261,573       60,897        75,272

                 Indiana County Populations and St. Joseph Co., MI. 2000, 2010, & 2018
                               Source: Decennial Census and ACS Est. DP05
     Year    Elkhart County    LaGrange County       St. Joseph County, IN    St. Joseph County, MI
     2000      182,791              34,909                 265,559                    62,422
     2010      196,855              36,996                 266,522                    61,295
     2018      203,604              38,942                 269,240                    60,897

17   Census OnTheMap
 ST. JOSEPH COUNTY 2021 HOUSING PLAN                                                                  28
Like St. Joseph County, comparison counties follow the national trend of increasing median ages
and senior populations. Compared to the other counties in Michigan, St. Joseph County’s median
age has not increased as quickly as some others. However, all Michigan counties in this
comparison are trending older than the three Indiana counties considered here. The primary
driver of this difference is a more significant proportion of individuals aged 65-to-74 years old in
the seven Michigan counties than in the Indiana counties. The housing market in southwest Michigan
is likely to be influenced by the needs of this senior population in the future.
Michigan County Median Ages. 2000, 2010, & 2018
Source: Decennial Census and ACS Est. DP05
Year Berrien Branch Calhoun Cass Kalamazoo St. Joseph Van Buren
County County County County County County County
2000 37.4 36.7 36.4 38.5 32.7 35.6 36.6
2010 40.3 39.1 38.4 41.4 33.9 38.0 39.4
2018 41.9 41.3 39.8 45.0 34.2 39.7 41.6
Indiana County and St. Joseph Co., MI, Median Ages. 2000, 2010, & 2018
Source: Decennial Census and ACS Est. DP05
Year Elkhart County LaGrange County St. Joseph County, IN St. Joseph County, MI
2000 33.0 29.5 34.4 35.6
2010 34.4 30.4 35.9 38.0
2018 35.5 31.4 36.5 39.7
Incomes in St. Joseph County are competitive for the region, but also constrain residents’
housing choices. Raising the incomes of county residents would help them afford more market-
rate home prices and allow them to invest more in maintaining their homes over the long term.
Michigan Counties Median Household Incomes. 2010, 2015 & 2018
Source: ACS 5YR Est. S1901
Berrien Branch Calhoun Cass Kalamazoo Van Buren St. Joseph
County County County County County County County, MI
2010 $42,625 $42,133 $42,568 $45,177 $44,794 $44,435 $44,392
2015 $44,993 $44,373 $42,520 $46,570 $47,476 $46,008 $44,449
2018 $49,135 $50,536 $47,426 $53,571 $54,431 $52,351 $50,117
Indiana Counties and St. Joseph County., MI Median Household Incomes. 2010, 2015 & 2018
Source: ACS 5YR Est. S1901
Elkhart County, IN LaGrange County, IN St. Joseph County, IN St. Joseph County, MI
2010 $47,258 $47,792 $44,644 $44,392
2015 $47,913 $49,964 $45,471 $44,449
2018 $55,399 $60,675 $50,938 $50,117
ST. JOSEPH COUNTY 2021 HOUSING PLAN 29St. Joseph County experienced a decline in home values from 2010 through 2016, but the
county’s housing market began to recover value in 2017 and 2018. While all ten counties in this
comparison experienced a drastic decline in new construction since 2009, St. Joseph County has
had one of the lowest numbers of new builds overall. Across the ten counties, however, St.
Joseph County has the competitive advantage of lower costs of home ownership.
Michigan County Median Home Values, Owner-Occupied. 2010 & 2018
Source: ACS 5YR Est. DP04
Year Berrien Branch Calhoun Cass Kalamazoo St. Joseph Van Buren
County County County County County County County
2010 $135,600 $111,800 $110,300 $133,700 $145,900 $116,200 $125,600
2018 $146,300 $104,100 $105,300 $134,700 $153,800 $115,100 $131,400
Indiana County & St. Joseph Co., MI, Median Home Values, Owner-Occupied. 2010 & 2018
Source: ACS 5YR Est. DP04
Year Elkhart County LaGrange County St. Joseph County, IN St. Joseph County, MI
2010 $128,000 $148,200 $116,300 $116,200
2018 $137,900 $179,200 $123,900 $115,100
Considering the total number of housing units in the region, St. Joseph County has a comparable
supply of houses to similarly situated counties like Branch and Cass Counties, but has significantly
fewer units than in other communities. While the supply of housing units in each county is related to
the size of its total population, in the last ten years new construction has been much more common
in urbanized counties. This is not only because urban areas have greater potential demand, but
also higher potential profits for developers. To counter this trend, rural areas like St. Joseph
County must utilize strategies that aim to lower costs for developers, increase residents’ incomes,
and showcase the quality of life and amenities of their communities.
In terms of the costs of owning a home, St. Joseph County has some of the lowest homeowner costs
in the region. Monthly housing costs with a mortgage in St. Joseph County are very
comparable to those in neighboring counties. If nearby counties have similar housing costs but
greater employment opportunities, workers are more likely to relocate. Maintaining a diversity of
housing types and prices in the county can help counteract this out-migration. Homeowner costs
without a mortgage in St. Joseph County are also quite comparable to nearby counties, but this
poses less risk of out-migration since these owners are likely to be retired or seniors and move less
frequently than other types of homeowners.
ST. JOSEPH COUNTY 2021 HOUSING PLAN 30You can also read