SPRINGTIME VENTURES Startup Fundraising Market Analysis - Pig in the Pipe - May 2022

Page created by Edith Hayes
 
CONTINUE READING
SPRINGTIME VENTURES Startup Fundraising Market Analysis - Pig in the Pipe - May 2022
SPRINGTIME VENTURES
       Startup Fundraising Market Analysis
                      Pig in the Pipe
                      – May 2022 –

 Rich Maloy | Managing Partner | rich@springtimeventures.com
SPRINGTIME VENTURES Startup Fundraising Market Analysis - Pig in the Pipe - May 2022
TL;DR
 We anticipate that the public market selloff will impact Early-Stage venture capital (i.e., Series A, B) this
 year making it harder for startups to raise capital at those levels and impacting valuations/valuation
 multiples at all stages. This is because:
 • Exits have fallen off a cliff
 • Late Stage has already taken a hit
 • There’s more startup activity at Seed than ever
 • Early Stage funding is poised to get squeezed between the two (good for VCs, bad for startups)

 Available Venture capital is at record levels, but it may be deceiving at Seed. Position yourself for success
 in the long run:
 • Be mindful of burn
 • Focus on revenue
 • If you plan to raise, raise now
 • Don’t get over your skis1 on valuation

                                                                                                  1 – Coloradans love this phrase
SPRINGTIME VENTURES Startup Fundraising Market Analysis - Pig in the Pipe - May 2022
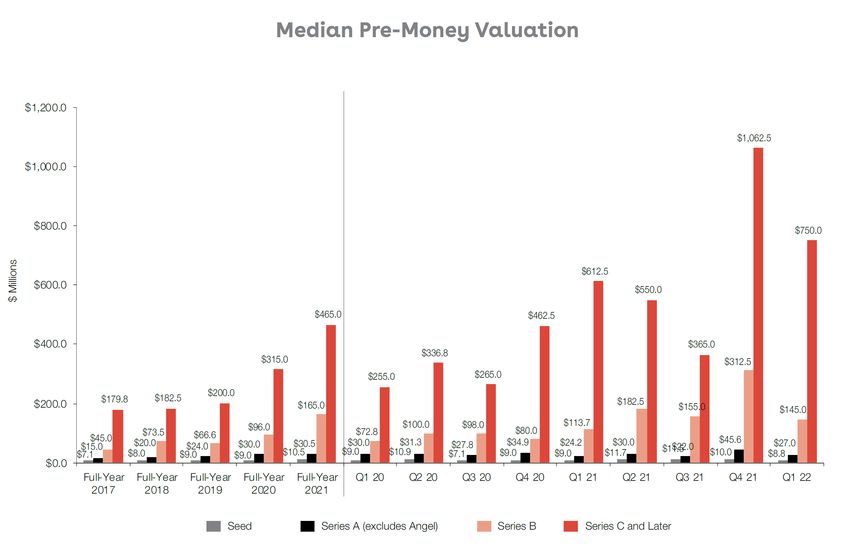
Framework: VC Treadmill
  One of my analogies for venture capital is that it’s a treadmill: one that only gets faster and only gets
  steeper. The expectation is that when you step on the treadmill, you will continually level up.

  Each level of investor expects that you will run hard to hit the next level. The expectation is that you raise
  capital, spend it, grow, raise more capital (at a higher valuation), spend it, grow more, repeat.

  A Seed investor expects that you’ll grow big enough, fast enough to appeal to the Series A investors.
  Series A investors for Series B, and so on.

  When your growth doesn’t meet the expectations of the next level, you have to keep running, look for a
  soft landing, or get bucked off the treadmill.

  Problems arise when the bar for the next level goes up and you haven’t adjusted to it.

  That bar for the next level may have already moved.
SPRINGTIME VENTURES Startup Fundraising Market Analysis - Pig in the Pipe - May 2022
Refresher: VC Economics
  VCs look good on paper when the next level on the treadmill validates their decision. A markup on paper is
  fine, but what looks good on paper isn’t the end goal for a venture capital firm. Venture investors through
  the whole stack only make money when there’s an exit event: M&A or IPO.

  When exit opportunities dry up, it has ripple effects through the market.

  We’re all upstream from the eventual liquidity event. Any blockage between here and there makes it harder
  to raise the next round, whether now or in the future.

  I think it’s important to refresh this because in hard times the alignment between VC firms and startups can
  diverge significantly. A fund may slow down on new investments, raise the bar, or even push existing
  portfolio companies to an early exit.
SPRINGTIME VENTURES Startup Fundraising Market Analysis - Pig in the Pipe - May 2022
Fair Warning
  I thought 2020 was going to be a rough year for fundraising. I got that wrong.

  I’ll address what I thought was coming in 2020 as COVID-19 hit, what I got wrong, and why I think 2022 is
  a different story.

  I may get it wrong again. I hope so.

  But our job is to know the venture market. Your job is to build an awesome business. We’re letting you
  know what’s going on in our world because it may affect your world.

  We      you
SPRINGTIME VENTURES Startup Fundraising Market Analysis - Pig in the Pipe - May 2022
Let’s Begin At The End
SPRINGTIME VENTURES Startup Fundraising Market Analysis - Pig in the Pipe - May 2022
Public Markets
Stocks are down but tech stocks are getting killed

                                                     1 Year Comp:
                                                     NASDAQ 100 Technology Sector Index (-13.66%)
                                                     vs.
                                                     Dow Jones Industrial Average (-7.43%)

                                                     YTD Comp:
                                                     NASDAQ 100 Technology Sector Index (-30.88%)
                                                     vs.
                                                     Dow Jones Industrial Average (-11.50%)

                                                                             Source: Marketwatch as of 5/10/2022
SPRINGTIME VENTURES Startup Fundraising Market Analysis - Pig in the Pipe - May 2022
SPACs Brought Exits
A huge part of the liquidity story in 2021…

                                              Source: CB Insights Venture Report 2021
SPRINGTIME VENTURES Startup Fundraising Market Analysis - Pig in the Pipe - May 2022
But SPACs Have Fared Even Worse
And the bad news for SPACs just keeps coming

                                               Source: PitchBook Q1 2022 SPAC Update and Performance | Bloomberg
SPRINGTIME VENTURES Startup Fundraising Market Analysis - Pig in the Pipe - May 2022
Resulting in Fewer Public Listings

                                296

                                      28

                                           Source: PitchBook
Plus M&A Down Slightly
This looks more like a regression to the mean…

                                                 Source: PitchBook Q1 2022 Global M&A Report
…This Looks Like 2000
Roughly 50% of all M&A this year transacted in stocks only

                                                             This is a negative signal for future M&A activity. With
                                                             rising interest rates cash is precious and capital is more
                                                             expensive, so stock becomes more attractive as a
                                                             means of acquisition. But as stock prices crash, that
                                                             option also becomes expensive. Combine both and
                                                             M&A slows down across the board.

                                                                                          Source: PitchBook Q1 2022 Global M&A Report
Thus… Exit Values Got Crushed
No appetite in the public market plus a worrying M&A trend
          $900                                                                                                                                                                                                                                           2000

          $800                                                                                                                                                                                                              1709                         1800

          $700                                                                                                                                                                                                                                           1600
                                                                                                                                                                                                                                                         1400
          $600
                                                                                                                          1109 1070                                              1146 1194 1131                                                          1200
          $500
                                                                                                             934                                      970 1014
                                                                                               887                                                                                                                                                       1000
          $400                                                                    760
                                                                     739                                                                                                                                                                                 800
                              639
          $300   553
                                           499          484                                                                                                                                                                                              600
          $200                                                                                                                                                                                                                             310           400

                                                                                               2012 $128.2

                                                                                                                           2014 $112.2

                                                                                                                                                                   2017 $100.7

                                                                                                                                                                                  2018 $124.3

                                                                                                                                                                                                2019 $265.8

                                                                                                                                                                                                              2020 $324.8

                                                                                                                                                                                                                             2021 $776.4
          $100
                                           2008 $20.2

                                                                                                                                                                                                                                           2022* $33.6
                 2006 $33.1

                              2007 $56.9

                                                        2009 $15.6

                                                                     2010 $48.4

                                                                                  2011 $67.3

                                                                                                             2013 $72.7

                                                                                                                                         2015 $75.8

                                                                                                                                                      2016 $73.4
                                                                                                                                                                                                                                                         200
            $0                                                                                                                                                                                                                                           0

                                                                        Exit value ($B)                      Exit count                   Estimated exit count

                                                                                                                                                                                                         Source: Q1 2022 PitchBook NVCA Venture Monitor First Look
Back To Startups
2021 Was
It was a record-shattering year for venture investment

                                                         Source: CB Insights Venture Report 2021
VC Fundraising Spiked in 2021
3 of the last 4 years were record-breaking for new fund formation

                                                       Annual VC fundraising ($B) activity
              $160

              $140                                                                                                                   137.73

              $120

              $100
                                                                                                                             88.32
                                                                                                             80.89
               $80                                                                                                   72.82

               $60                                                                           54.57
                                                                                     48.54           48.40
                                                                             41.75
               $40   35.70 37.60 34.74
                                                       27.82 28.76
                                                                     24.34
                                         18.95 18.77
               $20

                $0

                                                                                                                        Source: Q1 2022 PitchBook VC Quantitative Perspectives
Plus Existing Capital Overhang
Means there’s more dry powder than ever

             Capital Overhang is the amount of capital that’s been committed to venture funds (or other private funds) but has not yet been called (i.e., wired).
             Unlike a startup, a venture fund collects commitments but doesn’t take all the capital at once. Typically, a fund calls capital over a period of 2-4
             years—a timeline that has also shortened in the last two years.

             Funds must eventually deploy the full commitment, but it doesn’t mean they need to do it in a 1-2 year time horizon.

             The latest data I could find was from Q1 2020. Given fundraising levels since then, we can assume this has gone up.

                                                                                                                                                                    Source: PitchBook
And More Seed Than Ever
$9B from 2020 & 2021 vintages goes a long way in Seed

             “Over the past decade, seed has grown from a small market to one with nearly 4,000 deals per year. Pre-seed has
             also spawned over the past few years.” — Q2 2022 PitchBook Analyst Note Micro-Funding Opportunity, page 2

                                                                                              Source: Q2 2022 PitchBook Analyst Note Micro-Funding Opportunity
But 2022 Deals Are Down Slightly
Still above historic levels, but who cares… right?

                                                     Source: Q1 2022 PitchBook NVCA Venture Monitor First Look
Late Stage Cares
Deal size is up, up, and up for most, but down for Late stage

$18                                                                                                         $60
                              US VC median deal size ($M) by stage                                                                       US VC average deal size ($M) by stage                       $54.78
$16                                                                                      $15.50
                                                                                                  $14.00    $50
$14
                                                                                                                                                                                                              $41.02
$12                                                                                               $11.00    $40
                                                                                         $10.00
$10
                                                                                                            $30                                                                                               $27.72
$8
                                                                                                                                                                                                     $22.70
$6                                                                                                          $20

$4
                                                                                         $2.65    $2.61     $10
$2                                                                                                                                                                                                   $3.70    $4.86
                                                                                         $0.54    $0.67                                                                                              $1.68    $1.73
$0                                                                                                          $0
                                                  2016

                                                                           2019

                                                                                                                                                              2016
      2010

             2011

                    2012

                           2013

                                  2014

                                          2015

                                                          2017

                                                                   2018

                                                                                  2020

                                                                                           2021

                                                                                                                  2010

                                                                                                                         2011

                                                                                                                                2012

                                                                                                                                       2013

                                                                                                                                              2014

                                                                                                                                                      2015

                                                                                                                                                                      2017

                                                                                                                                                                               2018

                                                                                                                                                                                       2019

                                                                                                                                                                                              2020

                                                                                                                                                                                                       2021
                                                                                                    2022*

                                                                                                                                                                                                                2022*
                                  Angel    Seed     Early VC     Late VC                                                                      Angel    Seed     Early VC     Late VC

                                                                                                                                                         Source: Q1 2022 PitchBook NVCA Venture Monitor First Look
Valuations Are Up Across The Board…
Seed & Early Stage valuations are far outpacing normal levels

    $35.0                                                                                           $180.0
                          Quartile distribution of seed pre-values ($M)                                                  Quartile distribution of early VC pre-values ($M)
                                                                                                    $160.0
    $30.0
                                                                                                    $140.0
    $25.0
                                                                                                    $120.0

    $20.0                                                                                           $100.0

    $15.0                                                                                            $80.0

                                                                                                     $60.0
    $10.0
                                                                                                     $40.0
     $5.0
                                                                                                     $20.0

     $0.0                                                                                             $0.0
            2006 2007 2008 2009 2010 2011 2012 2013 2014 2015 2016 2017 2018 2019 2020 2021 2022*            2006 2007 2008 2009 2010 2011 2012 2013 2014 2015 2016 2017 2018 2019 2020 2021 2022*

                           Average    75th Percentile   Median   25th Percentile                                            Average    75th Percentile    Median    25th Percentile

                                                                                                                                                         Source: Q1 2022 PitchBook NVCA Venture Monitor First Look
…Except at Late Stage
Valuations at the stage closest to the exit took a hit

                             $800.0
                                                        Quartile distribution of Later VC pre-values ($M)
                             $700.0

                             $600.0

                             $500.0

                             $400.0

                             $300.0

                             $200.0

                             $100.0

                               $0.0
                                      2006 2007 2008 2009 2010 2011 2012 2013 2014 2015 2016 2017 2018 2019 2020 2021 2022*

                                                       Average    75th Percentile   Median      25th Percentile

                                                                                                                  Source: Q1 2022 PitchBook NVCA Venture Monitor First Look
Some Data Already Showing Cracks
Valuations down significantly across all stages in this Wilson Sonsini data set

                                                                                  Source: Wilson Sonsini Database- The Entrepreneurs Report Q1 2022
The Velocity of Change Increased
All stages changed fast, but Early Stage spiked the most.

           A larger RVVC means startups in that stage raised more money at higher valuations, faster.

                                                                                                        Source: Q1 2022 PitchBook VC Quantitative Perspectives
Putting It All Together
Pig In The Pipe
  Our concern is that there’s a “pig in the pipe” and the blockage hasn’t hit Seed & Early Stage markets yet.

  Late Stage investors can’t get their returns in the public markets or in M&A, so they’re pulling back on both
  the size and the price of investments. They are likely to focus on fewer, higher quality investments.

  It also means holding times on investments is expected to increase. When this happened in the past, Late
  Stage funds allocated larger reserves to back those smaller portfolios through longer holding periods.

  Valuations at Later stages—multiples on revenue—will come closer to what the public markets will accept.

  Because Early Stage investors accelerated the fastest into the current valuation environment, they will be
  the next to feel the impact. This could lead to a similar flight-to-quality in Early Stage: bigger checks into
  fewer investments with more reserves. Valuations will have to come down to match Late Stage’s pricing.
No Pigs At Seed, Only Bulls
  Valuation and round size may continue to grow unabated at the Seed stage.

  There’s an argument to be made that seed is still the most under-valued asset because it has the farthest
  to go and the most opportunities for markups; investors get the best price at Seed.

  With more Seed investors in the ecosystem than ever, competition for allocation, and an expectation of
  longer time horizons, Seed valuations may continue to rise, or at least normalize at current levels.

  This may feel like business as usual for the Seed community.

  Only to hit the pig in the pipe at Series A.

  Is a $50MM Seed fund ready to lead a Series A? Maybe once or twice. But not the $25MM fund, and
  definitely not the $10MM fund.
Bulls, Pigs                      Back to Quality
  Many more Seed startups will get funded.

  Only the best startups will get through to the next level.

  That may seem obvious but with the proliferation of capital came the proliferation of startups. Are they all
  above average2?

  The market for exits has signaled that it’s full right now. We haven’t seen this in more than a decade. The
  Late Stage is signaling it’s matching the public markets.

  Early Stage may follow next.

  Seed may continue unabated, which will only contribute to the difficulty of leveling up.

                                                                                                 2 – See: Lake Wobegon Effect
Stepping Back: 2020 Analysis
  We shared this post in 2020: Series A Super Crunch

  My conclusions then were similar to these today: Series A would be harder to raise than it had been in a
  long time.

  It turned out to be completely wrong, for a few reasons:

  1.   Record year for venture fundraising
  2.   Massive Capital Overhang
  3.   Zoom investing became the norm
  4.   Federal government reacted swiftly and aggressively to bail out the economy
  5.   Certain sectors flourished
  6.   SPACs boomed
It’s Different This Time
2020 vs. 2022
    2020                                  2022                            Analysis
    Record year for venture fundraising   TBD                             Likely down due to denominator
                                                                          effect.
    Capital Overhang                      Unknown                         Presumably higher given 2021
                                                                          VC funding levels
    Zoom investing became the norm        Continues to be the norm        Will Bay Area funds still look
                                                                          beyond their backyard? TBD
    Fed bail out                          Fed raising interest rates to   As money becomes expensive,
                                          combat inflation                capital spending slows down
    Certain sectors flourishing           Nearly the whole economy        Fear is rampant across the
                                          feeling the pressure            economy
    SPACs booming                         SPACs hurting                   Back to the traditional IPO and
                                                                          public market multiples
What You Can Do
We want to see you succeed in the long run
    Focus on revenue
    • Revenue multiples are a big part of the valuation equation3 beyond Seed
    • Further down the alphabet, revenue matters more
    • Thus, if valuations come down in later rounds, you need to have the revenue to justify the multiple
    Positive Unit Economics
    • This plus revenue growth is a ticket to the next level
    • Taking massive losses to win market share is the exception not the rule, especially at Seed
    Be mindful of burn
    • The next round may be further away than you think and will take longer to raise
    • Did we mention revenue?
    Raise what & when you can
    • If you need to raise capital this year, do it now or allot extra time later
    • Mind the valuation and ensure you can justify a larger valuation at the next stage

                                                                                             3 – Valuation is not an equation at all at Seed
What WorkHound Did
 Early in the COVID-19 pandemic I spoke with Max Farrell, CEO at WorkHound (SpringTime portfolio company), and shared my concerns about the market with him. That conversation
 sparked the post that I wrote in June. I urged him to focus on revenue, manage burn, and position himself for success in the long run. Though that seems like typical advice, it’s counter
 to the norm in a cash-rich environment where funding is plentiful: burn money to grow faster, even if that growth isn’t directly tied to revenue.

 Max took the advice back to his team and they got laser-focused on driving revenue for the rest of the year—resulting in their best year ever. The team at SpringTime has a tremendous
 amount of respect and admiration for what WorkHound accomplished as a team and how Max and his co-founder Andrew led them through it.

 Focus on revenue
 •   They became single-minded in their pursuit of revenue growth
 •   All product development had to serve their current customers and target customers – no more testing in horizontal markets
 •   Customer retention became a key part of this. (Revenue is not just new or expansion revenue, but also retaining customers)

 Be mindful of burn
 •   The entire team took voluntary pay cuts—executives taking the biggest cuts—to extend their runway to 24 months
 •   Restoring salaries was tied to revenue growth, specifically two step-ups based on two MRR goals

 Raise What & When You Can
 •   They were in a strong cash position and didn’t need to raise

 Take Advantage of Upswings
 •   Their truck driver retention platform became even more essential during COVID-19
 •   Because they stayed true to their core customer, they were able to take advantage of the timing

 Results
 •   By December 2020 they hit their first revenue goal, and hit the second by Feb 2021, restored full salaries, and reduced customer churn
 •   Since then, revenue has more than doubled, churn cut in half again, and they recently raised a Series A
Final Thoughts
  “Market corrections drive a rush to quality in the later stages so proving revenue AND scalable unit economics,
  while always important, are even more so in this environment.”
       – Frank Mendicinio, Co-Founder and Managing-Director, Access Venture Partners

  There is still plenty of venture capital in the market. Great venture-scale businesses will be able to raise at any
  stage. What constitutes “great” is different for every fund, but one constant is revenue and scalable unit
  economics.

  No matter what the macroeconomic trends, great companies will always thrive. Great companies are led by
  great people. We believe it comes down to you.

  We      you
About SpringTime Ventures
SpringTime Ventures
  SpringTime Ventures seeds high-growth startups in healthcare, fintech, logistics, and marketplace
  businesses. We look for founders with domain expertise, forging a path with a truly transformative technology.
  We only invest in software-based businesses in the USA. We bring a people-focused approach, work quickly,
  and reach conviction independently. Our initial check size is $400k to $600k. You can learn more about us and
  our approach.

                               VC Minute: Quick advice to help startup founders fundraise better.
                               Venture capitalists navigate pitches and negotiate investments every day, but for founders it’s
                               not their main focus. For many founders, it’s their first time fundraising and though they may
                               have achieved success in other areas of business, fundraising is a practice unlike anything
                               they’ve done before.

                               With short episodes—2 minutes on average—released every workday, founders can get insight
                               and guidance into the dynamics of seed stage venture financing.

                                         Sign up for the VC Minute
THETEAM
                                                             *Full team bios are in the data room

                                                            Matt Blomstedt
 Rick Patch | Partner
                                                            Managing Partner
 SpringTime Ventures Co-Founder. 40+ years                  Founded SpringTime Ventures in 2016
 as an investor, entrepreneur, and operator.                after a move to Boulder led to key
                                                            meetings with entrepreneurs.
                                                            Previously worked 10 years in energy
                                                            M&A.
 Jessie Dixon | Operating Partner
 20+ years ecommerce, supply chain, and
 marketplace experience at Havenly, eBags,
 and WalMart                                                Rich Maloy
                                                            Managing Partner
 Rick Jones | Operating Partner                             20+ years experience in finance, sales
 Former CEO of Lone Star Overnight. 30+                     and startups. Connector and builder of
 years of experience at LSO, UPS, and more.                 local and national startup ecosystems.

 Jeff Gardner | Operating Partner
 Operator with multiple successful exits.
 Expertise in vertical market software, FinTech,            Allyson Plosko
 and marketplaces.                                          Principal
                                                            10+ years of health tech investing
 John Greff | Partner & CFO                                 experience. Based in Atlanta, GA.
 40 years of venture experience. Sequel Venture Partners,
 Founding Partner Allos Therapeutics.
WEBELIEVE
Our Investment Bedrock

We love startups. We love the grit, passion, & innovation that          PEOPLE
entrepreneurs bring to the world.

We believe in a company culture that inspires action,
accountability, and intention. We invest in leaders who have                        GAME
deep domain experience. They are acutely aware of the            GRIT
people, partners, and resources they need to grow.                                CHANGING
We are proactive investment partners and relentless in our
pursuit to find and nurture truly game-changing startups.

                                                                        CULTURE
We are SpringTime Ventures.
It’s time to grow.
SPRINGTIME VENTURES
             Come grow with us.

 Rich Maloy | Managing Partner | rich@springtimeventures.com
You can also read