SOUTH AFRICA: INFORMAL SETTLEMENTS STATUS - RESEARCH REPORTS RESEARCH SERIES PUBLISHED BY THE HOUSING DEVELOPMENT AGENCY - THE HOUSING DEVELOPMENT ...
←
→
Page content transcription
If your browser does not render page correctly, please read the page content below
South Africa: Informal
settlements status

       research reports

research series published by the Housing Development Agency
SOUTH AFRICA   research report

         The Housing Development Agency (HDA)
         Block A, Riviera Office Park,
         6 – 10 Riviera Road,
         Killarney, Johannesburg
         PO Box 3209, Houghton,
         South Africa 2041
         Tel: +27 11 544 1000
         Fax: +27 11 544 1006/7

         Acknowledgements
         • Eighty 20

           Disclaimer
           Reasonable care has been taken in the preparation
           of this report. The information contained herein
           has been derived from sources believed to be
           accurate and reliable. The Housing Development
           Agency does not assume responsibility for any
           error, omission or opinion contained herein,
           including but not limited to any decisions made
           based on the content of this report.

         © The Housing Development Agency 2012
page 1
                                                                  SOUTH AFRICA    research report

Contents
  Part 1: Introduction                                                                   4

  Part 2: Data sources and definitions                                                   6
  2.1 Survey and Census data                                                             6

  2.2 Other Data from Statistics South Africa                                           11

  2.3 National Department of Human Settlements (NDHS)                                   12

  2.4 Land and Property Spatial Information System (LaPsis)                             13

  2.5 Eskom’s Spot Building Count (also known as the Eskom Dwelling Layer)              13

  2.6 Other providers of data: National Geo-spatial Information, GeoTerraImage

     and Community Organisation Resource Centre                                         14

  2.6.1 National Geo-spatial Information                                                14

  2.6.2 GeoTerraImage                                                                   14

  2.6.3 Community Organisation Resource Centre (CORC)                                   16

  2.7 Summary of national data sources                                                  18

  2.8 Provincial and municipal data                                                     21

  2.9 How to read this report                                                           21

  Part 3: The number and size of informal
  settlements in South Africa                                                           22
  3.1 Estimating the number of households who live in informal settlements              22

  3.2 Estimating the number of informal settlements in South Africa                     31
page 2
         SOUTH AFRICA   research report

         Contents
                  Part 4: Profiling informal settlements in South Africa            32
                  4.1 Basic living conditions and access to services                32

                  4.2 Profile of households and families                            35

                  4.3 Income, expenditure and other indicators of wellbeing         36

                  4.3.1 Income                                                      36

                  4.3.2 Expenditure                                                 41

                  4.3.3 Other indicators of well-being                              43

                  4.4 Age of dwellings and permanence                               43

                  4.5 Housing waiting lists and subsidy housing                     47

                  4.6 Health and vulnerability                                      49

                  4.7 Education                                                     51

                  Part 5: Concluding comments                                       53
                  5.1 Definitions and demarcation of informal settlements           53

                  5.2 Household surveys                                             53

                  5.3 Satellite imagery and aerial photography                      54

                  5.4 Data generated by municipalities or other service providers   55

                  5.5 Conclusions                                                   55

                  Part 6: Contacts and references                                   57

                  Part 7: Appendix: Statistics South Africa surveys                 59
                  7.1 Community Survey 2007                                         59

                  7.2 General Household Survey                                      59

                  7.3 Income and Expenditure Survey 2005/6                          60

                  7.4 Census 2001                                                   60

                  7.5 Enumerator Areas                                              60
page 3
SOUTH AFRICA research report
List of abbreviations
CORC Community Organisation Resource Centre
EA Enumeration Area
GHS General Household Survey
GIS Geographical Information Systems
GTI GeoTerraImage
HDA Housing Development Agency
HH Households
IES Income and Expenditure Survey
LaPsis Land and Property Spatial Information System
NDHS National Department of Human Settlements
PSU Primary Sampling Unit
Stats SA Statistics South Africapage 4
SOUTH AFRICA research report
part 1
Introduction
In terms of the HDA Act No. 23, 20081, the Housing Development Agency (HDA), is mandated
to assist organs of State with the upgrading of informal settlements. The HDA therefore
commissioned this study to investigate the availability of data and to analyse the data relating to
the profile, status and trends in informal settlements in South Africa, nationally and provincially
as well as for some of the larger municipalities.
As per the project Terms of Reference, the scope of the analysis includes:
• Establishing the national, provincial and local databases and information sources where the
necessary information can be obtained
• Highlighting the limitations of each of the data sources and the extent of validity and reliability
of the data sources as well as possible refinement and further work that would be required to
improve the data quality on an ongoing basis, specifically for informal settlements
• Providing a national profile and status quo indication of the informal settlements and, depending
on the data, providing inter alia:
–N umber of informal settlements
–G rowth, and development of the settlements
– L and and land holding information relating to informal settlements
– P hysical conditions of the settlements
– S ervices, facilities, infrastructure and access in the settlement (both government and other)
– P rofile of residents/households/families residing in the settlements
– Income groups residing in informal settlements
– E mployment status and potential
–V ulnerability in the settlements
–D isability
–M igration, mobility of the residents
– L ength of stay and reason for stay
–A spirations of residents
– E ducation status of residents
• Providing a provincial profile and status quo of informal settlements
• Providing municipal profiles per province of the informal settlement in larger municipalities
linked to the provincial and national data
• Provide insight into the overall and specific trends evident in informal settlements in South
Africa as well as in specific provinces and well as potential implications of the trends for different
sectors
• Provide insight into informal settlement trends as they relate to other housing options, initiatives
and developments.
1
The HDA Act No.23, 2008, Section 7 (1) k.page 5
SOUTH AFRICA research report
Population estimates and other indicators for households that live in informal settlements are
generated by Statistics South Africa. Eighty20 conducted a thorough review of all available survey
data as well as the 2001 Census data. Findings of this analysis were presented to two working
groups for comment and input. The analysis together with that input are summarised in the body
of this report. In addition, Statistics South Africa‟s latest dwelling frame data2 was obtained to
identify the location and size of informal settlements in the country.
Data was also obtained from the National Department of Human Settlements as well as the HDA
both of which rely principally on data collected by other entities such as provincial departments,
municipalities and private companies. Provinces and municipalities collect data on informal
settlements using survey and non-survey methodologies most typically through aerial photography.
While this methodology cannot provide a detailed profile of the households in the settlement it
can provide a basis to estimate the number of structures, households and individuals that are in
each settlement. In some cases municipalities augment this data with internally generated data
on municipal service provision as well as the location of points of service (such as education,
health care and transport). Eighty20 engaged with each province and the larger municipalities
(where possible) via email and telephonic communications in order to obtain and understand
these estimates and methodologies.
Eighty20 also obtained data from other entities that collect data either nationally or at a
settlement level. This includes Eskom which maintains a dwelling count database derived from
aerial photography as well as community-based organisations such as CORC which enumerate
settlements as part of their work.
The aim of this report is to understand and contrast these various data sources, review
methodologies, compare estimates and highlight any inconsistencies that may arise. The report
will also identify key gaps and weaknesses within the body of data relating to informal settlements
and where appropriate make some recommendations relating to data collection going forward.
2
This data has been used to demarcate enumeration areas for the 2011 Census.page 6
SOUTH AFRICA research report
part 2
Data sources
A number of data sources have been used for this study. These include household level data from
the 2001 Census and various nationally representative surveys conducted by Statistics South
Africa (Stats SA). Settlement level data was also reviewed, including municipal data, data from
the National Department of Human Settlements, the Housing Development Agency and Eskom.
It is critical when using data to be aware of its derivation and any potential biases or weaknesses
within the data. Each data source is therefore discussed in turn and any issues pertaining to the
data are highlighted.
2.1 Survey and Census data
Household-level data for this report was drawn from various nationally representative surveys
conducted by Statistics South Africa including the 2007 Community Survey (CS)3, the General
Household Survey (GHS) from 2002 to 2009 and the 2005/6 Income and Expenditure Survey
(IES)4. In addition, the study reviewed data from the 2001 Census5. It is important to note that
none of these surveys focus specifically on households in informal settlements; questionnaires
cover housing and household conditions more generally. While these data sources are all based
on interviews with households, estimates are expected to differ given that different research
periods and sampling frames are used. In some cases these differences can be quite significant.
Data sources are therefore clearly noted.
The census defines an informal settlement as: ‘An unplanned settlement on land which has not
been surveyed or proclaimed as residential, consisting mainly of informal dwellings (shacks)’.
In turn, the census defines an ‘informal dwelling’ as: ‘A makeshift structure not erected according
to approved architectural plans’.
The 2001 Census characterises both the settlement type as well as the dwelling type. With regard
to settlements, 2001 Census EAs6 are categorised as one of the following in line with the status
of the majority of households in that specific EA:
• Sparse (10 or fewer households)
• Tribal Settlement
• Farm
• Smallholding
3
T he Community Survey is a nationally representative, large-scale household survey. It provides demographic and socio-economic information such as
the extent of poor households, access to facilities and services, levels of employment/unemployment at national, provincial and municipal level.
4
The Income and Expenditure Survey was conducted by Statistics South Africa (Stats SA) between September 2005 and August 2006 (IES 2005/2006).
It is based on the diary method of capture and was the first of its kind to be conducted by Stats SA.
5
The Census data is available for all SA households; where more detail is required the 10% sample of this data set is used. Choice of data set is
highlighted where applicable.
6
An Enumeration Area (EA) is the smallest piece of land into which the country is divided for enumeration, of a size suitable for one fieldworker in
an allocated period of time. EAs typically contain between 100 and 250 households.page 7
SOUTH AFRICA research report
• Urban Settlement
• Informal Settlement
• Recreational
• Industrial Area
• Institution
• Hostel
The main categories of dwelling types used in the census are listed below:
• House or brick structure on a separate stand or yard
• Traditional dwelling/hut/structure made of traditional materials
• Flat in a block of flats
• Town/cluster/semi-detached house (simplex, duplex or triplex)
• House/flat/room, in backyard
• Informal dwelling/shack, in backyard
• Informal dwelling/shack, NOT in backyard, e.g. in an informal/squatter settlement
There are thus two indicators in the 2001 Census that could be used to identify households living
in informal settlements.
Unlike census data, survey data does not provide an EA descriptor. However, surveys do provide
an indication of dwelling types. In the absence of an EA descriptor for informal settlements, the
analysis of survey data relies on a proxy indicator based dwelling type, namely those who live in
an ‘Informal dwelling/shack, not in backyard e.g. in an informal/squatter settlement’.
An analysis of Census data which contains both variables can be used to assess the robustness of
this proxy. According to the 2001 Census, 1.38 million households lived in an informal dwelling
or shack not in a backyard in 2001 while 1.11 million households lived in enumeration areas that
are characterised as Informal Settlements. Just over 700,000 households lived in both.
ch art 1
Cross-over of Type of Dwelling and Enumeration Area: south africa
Total households who live in an informal settlement
OR in a shack not in a backyard: 1 779 426
Main
dwelling:
EA: Informal 709 355 Informal
Settlement dwelling/
1 112 923 (6% of all shack not in
households) backyard
(9% of all 1 375 858
households)
(12% of all
households)
64% of households who live in EAs classified as Informal
Settlements, live in shacks not in backyards.
52% of households who live in shacks not in backyards,
live in EAs classified as Informal Settlements.
Source: Census 2001.page 8
SOUTH AFRICA research report
According to the Census, of those households who live in EAs categorised as Informal Settlements,
64% live in shacks not in backyards. A further 18% of households in these EAs live in houses or
brick structures, 7% live in shacks in backyards (it is not clear whether the primary dwelling on
the property is itself a shack) and 7% live in traditional dwellings. Note that this differs somewhat
by province as summarised in the table below.
tab le 1
Main Dwelling type of households living in Informal Settlement
Enumeration Areas
Shack not in Shack in Traditional Formal Other
backyard backyard dwelling dwelling
Eastern Cape 63% 6% 8% 22% 1%
Free State 68% 7% 3% 22% 1%
Gauteng 76% 9% 2% 12% 1%
KwaZulu-Natal 43% 7% 14% 34% 1%
Limpopo 66% 11% 10% 12% 2%
Mpumalanga 62% 5% 13% 18% 2%
North West 50% 3% 3% 44% 1%
Northern Cape 64% 8% 3% 16% 10%
Western Cape 79% 6% 4% 10% 2%
South Africa 64% 7% 7% 21% 1%
Source: Census 2001.
Note: Formal dwelling includes flat in a block of flats, dwelling on a separate stand, backyard dwelling, room/flatlet, and town/cluster/
semi-detached house.
Conversely the data indicates that just under half of all households in South Africa who live
in shacks not in a backyard do not, in fact, live in EAs categorised as Informal Settlements.
32% live in EAs categorised as Urban Settlements and 10% live in Tribal Settlement EAs. There
is significant provincial variation in the location of shacks not in backyards in terms of EA
classification as illustrated in the table below. For instance in Limpopo and the North West almost
40% of shacks not in backyards are located in Tribal Settlements while in the Free State and the
Northern Cape upwards of 45% of all shacks not in backyards are located in EAs designated as
Urban Settlements.
tab le 2
Enumeration Area of those households living in shacks not in
backyards
Informal Urban Tribal Farm Other
settlement settlement settlement
Eastern Cape 63% 22% 10% 3% 2%
Free State 47% 46% 3% 2% 2%
Gauteng 58% 37% 0% 3% 2%
KwaZulu-Natal 65% 17% 10% 3% 4%
Limpopo 28% 16% 39% 15% 2%
Mpumalanga 40% 28% 19% 7% 6%
North West 19% 32% 38% 7% 4%
Northern Cape 29% 50% 3% 9% 9%
Western Cape 65% 32% 0% 1% 2%
South Africa 52% 32% 10% 4% 3%
Source: Census 2001.page 9
SOUTH AFRICA research report
Of course it is by no means the case that EA classifications align with official municipal or
provincial definitions of informal settlements. It is entirely possible that some households living in
shacks within an EA defined by Stats SA as an Urban Settlement or a Tribal Settlement would be
regarded as living in an informal settlement by municipal officials.
For the sake of harmonisation and alignment with other national settlement-based estimates,
an EA-based definition from the Census should be used. However, given that census data is
ten years old it would be undesirable to draw conclusions from that data about conditions of
households in informal settlements today. The analysis summarised in the body of this report
therefore relies on the dwelling type categorisation (shack not in a backyard). EA level data from
the Census is summarised throughout to enable a comparison with other studies drawing on this
data source. It is noted that the analysis based on surveys using the dwelling type indicator ‘shack
not in backyard’ to identify households who live in informal settlements should be regarded as
indicative as there is insufficient data in the surveys to determine whether these households do,
in fact, live in informal settlements as defined by local or provincial authorities.
A further challenge with regard to survey data relates to the sampling frame. In cases where
survey sample EAs are selected at random from the Census 2001 frame, newly created or rapidly
growing settlements will be under-represented. Informal settlements are arguably the most likely
settlement type to be under-sampled, resulting in an under-count of the number of households
who live in an informal settlement. Further, if there is a relationship between the socio economic
conditions of households who live in informal settlements and the age of the settlement (as it
seems plausible there will be) a reliance on survey data where there is a natural bias towards older
settlements will result in an inaccurate representation of the general conditions of households who
live in informal settlements. This limitation is particularly important when exploring issues relating
to length of stay, forms of tenure and access to services. A second word of caution is therefore in
order: survey data that is presented may under-count households in informal settlements and is
likely to have a bias towards older, more established settlements.
With regard to trend data, comparisons are made between the 2001 Census and the 2007
Community Survey. In addition, trend data from the GHS, an annual survey conducted since
2002, has been used. While the questionnaire for that survey has remained relatively stable
over time, there have been a number of changes across Primary Sampling Units7. Three different
sample designs were used over the years, over the periods 2002 to 2004, 2005 to 2007 and
2008 to 2009. These changes make it difficult to assess to what extent trends reflect real shifts in
settlement patterns as opposed to improved sampling processes.
Geographic dimensions also differ across these data sources. More recent survey data from the
GHS is available at a provincial level only with data from 2002 to 2007 available at Main Place
level. 2007 Community Survey data and 2001 Census data is available at a Main Place and
Sub-Place level8.
7
Statistics South Africa uses a master sample to draw samples for its regular household surveys. This master sample is drawn from the database
of enumeration areas established during the demarcation phase of the 2001 Census. As part of this master sample, small enumeration areas
consisting of fewer than 100 households are combined with adjacent enumeration areas in order to form primary sampling units consisting of at
least 100 households. This is done in order to allow for repeated sampling of dwelling units within each primary sampling unit.
8
Statistics South Africa does record data at an EA level (although this is not released).page 10
SOUTH AFRICA research report
An additional consideration relates to sample sizes. While the surveys have relatively large sample
sizes, the analysis is by and large restricted to households who live in shacks not in backyards,
reducing the applicable sample size significantly. Analysis of the data by province or other
demographic indicator further reduces the sample size. In some cases the resulting sample is
simply too small for detailed analysis as summarised below.
tabl e 3
Sample sizes in the different surveys
Census 2001 Community Income and General
Survey 2007 Expenditure Household
Survey 2005/6 Survey 2009
Total Total Households Total Sample Total Sample Total Sample
number of number of living in survey size for survey size for survey size for
households households informal sample households sample households sample households
living in settlement size living in size living in size living in
shacks EAs shacks shacks shacks
not in a not in a not in a not in a
backyard backyard backyard backyard
Eastern Cape 1 537 408 134 824 133 384 35 712 2 074 2 825 146 2 930 145
Free State 757 908 147 780 103 071 15 302 2 058 1 754 228 2 371 168
Gauteng 2 839 067 448 383 339 497 53 776 8 175 2 496 352 4 135 532
KwaZulu- 2 203 350 177 989 268 800 44 160 2 654 4 732 153 4 168 272
Natal
Limpopo 1 251 308 56 489 23 666 23 569 955 1 951 57 2 942 56
Mpum- 783 517 92 496 60 541 16 896 1 652 1 687 203 2 430 155
alanga
North West 979 217 154 693 57 765 18 369 2 977 1 569 213 2 294 220
Northern 220 537 20 496 9 254 12 409 1 143 1 726 122 1 503 84
Cape
Western 1 211 485 142 709 116 944 26 425 2 106 2 404 186 2 530 243
Cape
South Africa 11 783 798 1 375 858 1 112 923 246 618 23 794 21 144 1 660 25 303 1 875
Source: Census 2001 (10% sample), Community Survey 2007, IES 2005/6, GHS 2009; Household databases.
A final consideration relates to the underlying unit of analysis. Survey and census data sources
characterise individuals or households rather than individual settlements. These data sources
provide estimates of the population who live in informal settlements as well as indications of
their living conditions. The data as it is released cannot provide an overview of the size, growth
or conditions at a settlement level9 although it is possible to explore household-level data at
provincial and municipal level depending on the data source and sample size.
It may be possible for Statistics South Africa to match EA level data from the 2001 Census to settlements to provide an overview of specific
9
settlements. Given that the Census data is ten years old, and that conditions in informal settlements are likely to have changed significantly since
then, the feasibility of this analysis was not established.page 11
SOUTH AFRICA research report
The definition of a household is critical in understanding household level data. By and large
household surveys define a household as a group of people who share a dwelling and financial
resources. According to Statistics SA ‘A household consists of a single person or a group of people
who live together for at least four nights a week, who eat from the same pot and who share
resources’. Using this definition, it is clear that a household count may not necessarily correspond
to a dwelling count; there may be more than one household living in a dwelling. Likewise a
household may occupy more than one dwelling structure.
From the perspective of household members themselves the dwelling-based household unit may
be incomplete. Household members who share financial resources and who regard the dwelling
unit as ‘home’ may reside elsewhere. In addition, those who live in a dwelling and share resources
may not do so out of choice. Household formation is shaped by many factors, including housing
availability. If alternative housing was available the household might reconstitute itself into more
than one household. Thus, while the survey definition of a household may accurately describe
the interactions between people who share a dwelling and share financial resources for some
or even most households, in other cases it may not. The surveys themselves do not enable an
interrogation of this directly.
2.2 Other data from Statistics South Africa
A dwelling frame count was provided by Stats SA for the upcoming 2011 Census. The Dwelling
Frame is a register of the spatial location (physical address, geographic coordinates, and place
name) of dwelling units and other structures in the country10. It has been collated since 2005 and
is approximately 70% complete. The Dwelling Frame is used to demarcate Enumeration Areas
for the 2011 Census11.
There are 1,184 sub-places with at least one EA classified as ‘Informal Residential’12, totalling
5,348 Enumeration Areas (covering a total area of 816 square kilometres). EAs typically
contain between 100 and 250 households. The acceptable range in dwelling unit count per
Informal Residential EA is 151-185 (Ideal: 168) with no geographic size constraint. There are
Dwelling Frame estimates for 870 (73%) of these ‘Informal Residential’ EAs, totalling 398,169
Dwelling Frames.
Since the Dwelling Frame is only approximately 70% complete, and not all units are counted
within certain dwelling types (for example, block of flats or collective living quarters), the count
should not be seen as the official count of dwellings or households within the EA Type.
Bhekani Khumalo (2009), ‘The Dwelling Frame project as a tool of achieving socially-friendly Enumeration Areas’ boundaries for Census 2011,
10
South Africa’, Statistics South Africa.
An EA is the smallest piece of land into which the country is divided for enumeration, of a size suitable for one fieldworker in an allocated period
11
of time. EA type is then the classification of EAs according to specific criteria which profiles land use and human settlement in an area.
12
The EA descriptor for informal settlements in the 2011 Census is ‘Informal Residential’; in 2001 the EA type was ‘Informal Settlement’.page 12
SOUTH AFRICA research report
2.3 National Department of Human Settlements
(NDHS)
The 2009 National Housing Code’s Informal Settlement Upgrading Programme13 identifies
informal settlements on the basis of the following characteristics:
• Illegality and informality;
• Inappropriate locations;
• Restricted public and private sector investment;
• Poverty and vulnerability; and
• Social stress
The Upgrading of Informal Settlements Programme applies to all settlements that demonstrate
one or more of the above characteristics, subject to certain household and individual qualifiers.
The Department has commissioned the development of two atlases; namely, the Human
Settlements Investment Potential Atlas (compiled by the CSIR) and the Informal Settlements Atlas
(compiled by AfriGIS). The 2008/2009 Informal Settlements Atlas featured 45 municipalities.
In 2010 the Department extended the atlas to incorporate a total of 70 municipalities.
The 2009/2010 Informal Settlement Atlas indicates there are 2,628 informal settlement polygons
in the country across the 70 municipalities. No household estimates are provided.
Data gathering methods used to create the Atlas differed by area depending on the data available
within the municipalities included in the study. In some cases relatively complete data was obtained
directly from the municipality (spatial, alphanumeric, imagery, or a combination of these) and was
used to develop the spatial layers for mapping. In cases where spatial data did not exist, the
informal settlement boundaries were identified and digitised from available aerial and satellite
photography. Maps with the informal settlement boundaries were then taken to municipalities
where the relevant officers were asked to verify the locations of these boundaries. In this way,
additional informal settlements not found from the aerial photography and other attribute data
could also be included in the study.
The Department was assisted by AfriGIS, a provider of Geographical Information Systems (GIS)
solutions, in putting together the Atlas. AfriGIS was given informal settlements data by the
provincial departments of housing to create the map layers14.
A critical requirement of the Atlas project is that settlement level data is regularly maintained
and updated. Latest data must be acquired and incorporated into the project and additional data
obtained to augment existing layers so that trends can be identified, both with respect to the size
of settlements as well as access to basic services and amenities in these settlements.
13
2009 National Housing Code, Incremental Interventions: Upgrading Informal Settlements (Part 3).
14
AfriGIS has comprehensive data including town and suburb boundaries, postal code regions, street name directory, national address database,
sectional schemes, points of interest (including schools, commercial buildings and places of worship), proclaimed towns, built-up areas, gated
communities and deeds data.page 13
SOUTH AFRICA research report
2.4 Land and Property Spatial Information System
(LaPsis)
LaPsis is an interactive online system created by the Housing Development Agency that enables
the analysis of land and property data. It incorporates various data sources including cadastre,
ownership, title documents and deeds (from the Deeds Office), administrative boundaries (from
the Demarcation Board) and points of interest from service providers such as AfriGIS. It also
comprises specific spatial layers such as the Investment Potential layer from the Human Settlements
Investment Potential Atlas15, the location of various housing projects, and the location of 2,754
informal settlements covering 70 municipalities. Ultimately, settlement level data in LaPsis will
include counts of the population, households and shacks for each settlement. In addition, land
ownership details are being collated as is provision of toilets, taps and electricity, along with
access to schools, clinics and transport facilities. LaPsis is very much work in progress: in many
cases data fields are unpopulated. Only 3% of the informal settlements have a household or
shack count, the majority of which are in Gauteng and the Western Cape.
The HDA is conducting further work on the informal settlements layer this year (2011), and LaPsis
will be updated accordingly.
2.5 Eskom’s Spot Building Count (also known as
the Eskom Dwelling Layer)
Eskom has mapped and classified structures in South Africa using image interpretation and
manual digitisation of high resolution satellite imagery. The Spot Building Count (SBC) categorises
identifiable structures as dwellings, schools, hostels/townhouses, mines, resorts and Industrial and
commercial structures16. Where settlements are too dense to determine the number of structures
these area are categorised as dense informal settlements. Identifiable dwellings and building
structures are mapped by points while dense informal settlements are mapped by polygons.
Shape files provided by Eskom revealed 1,016 polygons categorised as Dense Informal Settlements,
covering a total area of 83.87 square kilometres. The dataset does not characterise the areas, nor
does it match areas to known settlements. Latest available data is based on 2008 imagery. Eskom
is currently in the process of mapping 2009 imagery and plans to have mapped 2010 imagery by
the end of the year.
Eskom uses the data for planning purposes. It has made the data available to all government
departments and academic institutions.
15
hile the Atlas identifies informal settlement polygons, the HDA uses the centroids of each polygon and converted the polygon to a point which
W
is mapped; the source data remains the same.
16
SPOT Building Count supports informed decisions by Nale Mudau, ESI-GIS, telephonic discussions with Nale Madau, 2011.page 14
SOUTH AFRICA research report
2.6 Other providers of data: National Geo-spatial
Information, GeoTerraImage and Community
Organisation Resource Centre
Various other entities provide the photographic and household data that is used to profile, identify
and monitor the growth of informal settlements. Three organisations, a public entity, a private for
profit company and a Non-Governmental Organisation, are briefly described.
2.6.1 National Geo-spatial Information
National Geo-spatial Information (NGI), a division of the Rural Development and Land Reform
(DRDLR) Department17, has an extensive archive of aerial photographs captured since the early
1930s. Since 2008 all images have been captured with a digital camera. NGI aims to capture 40%
of the country every three years and the remaining areas every five years.
2.6.2 GeoTerraImage
GeoTerraImage (GTI) is a private company specialising in geospatial mapping and remote sensing18.
In order to classify various uses associated with an area or structure, GTI uses a combination of
field work, complimentary data and image interpretation. This methodology enables consistent
and complete coverage of a municipality at a point in time. Photography is time stamped and
data gathered annually. The earliest data set is from 2001 and the most current from 2009.
This allows for quantification of growth and densification of a given area or settlement over
time.
In the case of informal settlements, individual structures are mapped using high resolution aerial
photography based on spatial patterns or densities and proximity to formalised cadastre19 and
road networks. Structures (formal, informal and backyard structures) are classified manually
by putting a point on each dwelling20. An informal settlement is then defined as a group of
non-permanent structures not on a formally registered residential property21.
17
ccording to its website, the functions of NGI are mandated by two Acts; namely the Land Survey Act 8 of 1997 (which mandates the NGI to
A
regulate the survey of land in the Republic; and to provide for matters connected to that process) and the Spatial Data Infrastructure Act of 2003
which mandates the NGI to ‘facilitate the capture, management, maintenance, integration, distribution and use of spatial information’.
18
Remote sensing is the acquisition of data without physical contact, in this case aerial photography and satellite imagery.
19
A cadastre is an official register of the ownership, extent and value of property in an area.
20
Around 20,000 to 25,000 points can be identified in one day by one person.
21
Where formality is defined by ownership of land/deeds.page 15
SOUTH AFRICA research report
Detailed analysis is done on a project-by-project basis for many of the large municipalities. GTI has
mapped the informal areas for the following places:
tabl e 4
Mapping of informal settlements: GTI
Eastern Cape • Nelson Mandela Bay*
• East London
• Queenstown – Ezibeleni
• Umtata
Free State • Bloemfontein
• Welkom – Virginia – Odendaalsrus
• Newcastle – Madadeni – Osizweni
• Denysville – Oranjeville – Vaaldam
Gauteng • City of Tshwane *
• City of Johannesburg *
• Ekurhuleni Metropolitan Municipality *
• Sedibeng District Municipality *
• West Rand District Municipality *
KwaZulu-Natal • eThekwini *
• Pietmaritzburg *
• Richards Bay – Empangeni – Eskhawini
• Ladysmith – Ezakheni
• Qwaqwa (Phuthaditjhaba) – Witsieshoek
Limpopo • Polokwane
Mpumalanga • Witbank
• Middelburg
• Nelspruit
• Ermelo
North West • Potchefstroom
• Klerksdorp
• Rustenburg
• Mmabatho – Mafikeng
• Sun City
Northern Cape • Kimberley
Western Cape • Cape Town*
• George – Mosselbay
• Paarl – Wellington
• Plettenburg Bay
• Knysna
• Saldanha – Vredenburg
• Hermanuspage 16
SOUTH AFRICA research report
For most of the areas, GTI has mapped only the informal settlement boundaries; in the areas
indicated by the asterisk, GTI has also mapped the physical building structures.
Several municipalities use aerial photography from GTI and not NGI because of quality and
frequency. The pixel size of the aerial photographs provided by NGI is reportedly of a lower
resolution and municipalities such as the City of Cape Town are able to commission aerial
photograph annually, providing a more updated and complete coverage of the municipality.
2.6.3 Community Organisation Resource Centre (CORC)
The Community Organisation Resource Centre (CORC) is an NGO that operates in all provinces
across the country with the aim of providing support to ‘networks of communities to mobilise
themselves around their own resources and capacities’22. CORC supports the social processes of
community-based organisations that want to work for themselves, by facilitating engagements
with formal actors like the State. It also supports the development of ‘social technologies,’
especially the SDI rituals of savings, enumeration, and community-led development strategies.
CORC supports communities linked through the networks of ISN and FEDUP to collect information
as a base to enable communities to develop a strategy and negotiate with the State with regard
to service provision and upgrading. Communities profile their informal settlements and undertake
household surveys. Other community leaders in the networks of ISN and FEDUP train community
members to undertake this practice. Community enumerators are provided with a basic stipend
to enable them to do their work. Improvements are made to questionnaires using community
consultation and professional verification. This ensures that comprehensive and relevant data is
collected. During such activities, communities also gather other settlement level data on service
provision including the number and type of toilets and taps. A list of settlements that have been
enumerated recently is summarised below, together with household and population estimates.
22
See http://www.sasdialliance.org.za/about-corc/page 17
SOUTH AFRICA research report
tabl e 5
Enumeration of informal settlements by CORC
Name of Region Date Number of Population
settlement households
Joe Slovo Western Cape May 2009 2 748 7 946
Harolds Farm Gauteng July 2009 93 261
Doornbach Western Cape September 2009 1 855 4 555
Kliprand Eastern Cape October 2009 400 1 209
Alberton Gauteng November 2009 265 1 024
Manenberg Western Cape December 2009 3 139 1 322
Sheffield Road Western Cape December 2009 149 504
Ntuzuma G KZN December 2009 1 052 4 039
TT Section Western Cape February 2010 272 995
Barcelona Western Cape March 2010 2 230 6 600
Umlazi KZN July 2010 1 908 1 098
Dunbar KZN July 2010 551 1 817
Riemvasmaak Eastern Cape July 2010 314 932
Extension 32 Eastern Cape July 2010 270 1 009
Thulasizwe Gauteng July 2010 65 243
Montic Gauteng July 2010 50 186
Europe Western Cape October 2010 1 832 5 125
Los Angeles Western Cape November 2010 325 876
Shukushukuma Western Cape February 2011 306 718
Garden City Western Cape February 2011 317 753
lungrug Stellenbosch February 2011 1 876 4 088
Quarry Road KZN February 2011 189 358
Makause Gauteng February 2011 In progress In progress
la Rochelle Western Cape February 2011 25 100
Schoopiehoegte Western Cape February 2011 19 79
Devon valley Western Cape February 2011 10 15
Gif Western Cape February 2011 17 41
Kylmore Western Cape February 2011 9 26
Meerlust Western Cape February 2011 10 25page 18
SOUTH AFRICA research report
2.7 Summary of national data sources
A summary of key data sources together with definitions used to identify and profile informal
settlements is provided in the table below.
tab le 6
Summary of national data sources
Stats SA: Survey and Census data
Definition • Informal settlement: An unplanned settlement on land which has
of informal not been surveyed or proclaimed as residential, consisting mainly of
settlement informal dwellings (shacks)
• Informal dwelling: A makeshift structure not erected according to
approved architectural plans
Data coverage Informal Settlements Dwellings Households
• No count provided •N
o dwelling count •D
ata available:
provided Demographics,
services, income,
expenditure, assets,
dwelling, tenure, etc.
Data collection • S ee Appendix for detailed methodologies
methods
Comments • Data spans all of South Africa
• Data sources include Census 2001 and surveys (Community Survey
2007, IES 2005/6, 2002-2009 GHS and Labour Force Survey)
• Analysis relies on the dwelling type categorisation ‘Shack not
in backyard’. Data from the Census 2001 based on the EA type
classification ‘Informal Settlement’ is summarised at the start of each
chapter
• In some cases small sample sizes prevent comprehensive analysis at a
detailed geographic levelpage 19
SOUTH AFRICA research report
Stats SA: Dwelling Frame data
Overview • The Dwelling Frame is a register of the spatial location of dwelling
units and other structures. It is used to demarcate Enumeration
Areas (EAs) for the 2011 Census
• The Dwelling Frame count for 2011 Census has been collated since
2005 and is around 70% complete
• An EA is the smallest piece of land into which the country is
divided for enumeration, of a size suitable for one fieldworker in an
allocated period of time
• EAs typically contain between 100 and 250 households. The
acceptable range in dwelling unit count per Informal Residential EA
is 151-185 (Ideal: 168) with no geographic size constraint
Data coverage Informal Settlements Dwellings Households
• There are 1,184 • There are Dwelling •N
o household
sub-places with Frame estimates count has been
at least one for 870 (73%) of provided
EA classified these ‘Informal
as ‘Informal Residential’ EAs,
Residential’, totalling 398,169
totalling 5,348 EAs DFs
and covering a total
area of 816 square
kilometres
Comments • The Dwelling Frame is only approx. 70% complete and not all units
are counted in some dwelling types (e.g. collective living quarters
and block of flats) therefore the count should not be seen as the
official count of dwellings or households within the EA Type
Eskom Spot Building Count
Definition •W
here settlements are too dense to determine the number of
of informal structures given the resolution of the satellite imagery the area
settlement is categorised as a ‘Dense Informal’ area. These areas are often
informal settlements although Eskom does not have a specific
definition in that regard
Data coverage Informal Settlements Dwellings Households
• 1,016 Dense •N
o dwelling count • No household
Informal polygons, has been provided count has been
covering a total provided
area of 83.87
square kilometres
Data collection •A
nnual dwelling count using satellite imagery
Methodspage 20
SOUTH AFRICA research report
NDHS Informal Settlements Atlas
Definition • The 2009 National Housing Code’s Informal Settlement Upgrading
of informal Programme identifies informal settlements on the basis of the
settlement following characteristics:
– Illegality and informality;
– Inappropriate locations;
– Restricted public and private sector investment;
– Poverty and vulnerability; and
• Social stress
Data coverage Informal Settlements Dwellings Households
• Count of 2,628 •N
o dwelling count •N
o household count
informal settlement has been provided has been provided
polygons in 70
municipalities in all
provinces
• Using other layers
one can interpret
this with other data
(e.g. key services)
Data collection •D ata gathering methods vary depending on area (complete data
methods from municipality, and/or identification from imagery and manual
verification)
•W here municipal data is incomplete, aerial photography, satellite
imagery and verification techniques were used to identify informal
settlement polygons
• Images are from different years up to 2006
•A ssisted by AfriGIS
LaPsis
Overview • A flexible, online system created by the HDA on land and property
data including cadastre, ownership, title documents and deeds,
administrative boundaries, access to services (toilets, water,
electricity) and points of interest (schools, transport)
• LaPsis will be updated after further work on the informal settlements
layer by the HDA in 2011
Definition • Same as NDHS Informal Settlements Atlas above
of informal
settlement
Data coverage Informal Settlements Dwellings Households
• Data on 2,754 • 3% of the informal •3
% of the informal
informal settlements settlements provide settlements provide
in 70 municipalities a shack count a household count
Data collection • Based on the NDHS Informal Settlements Atlas
Methods • Informal settlements are identified by the provinces, who forward
the data on to the HDA
• The data was collected in 2009page 21
SOUTH AFRICA research report
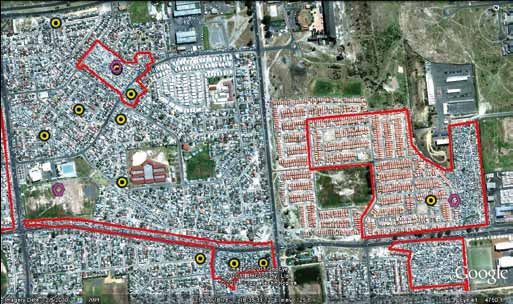
Settlement level data generated by LaPsis, Stats SA’s dwelling frame and Eskom can be compared
by overlaying spatial data. While a detailed national comparison is beyond the scope of this study
the data was compared using Google Earth for a number of areas. The map below for Gugulethu
highlights that while there are some areas of overlap, this is not exact.
ch art 2
Comparison of settlement level data: Gugulethu
LaPsis
Stats SA
Eskom
A
A number of other observations are worth noting. Aside from variation in the definition of an
informal settlement, the basis of settlement demarcation (i.e. determining the boundaries of
each settlement) also varies. In the case of LaPsis, demarcations presumably follow municipal
conventions, although it is not clear on what basis these are determined. With regard to currency,
the year in which the data is gathered is clearly material. For instance, in the Google Earth map
above a significant proportion of the area identified as an informal settlement adjacent to the
letter ‘A’ appears to comprise formal housing. While it is not clear why this is the case it is possible
that this housing was developed after the settlement imagery was captured (2008 in the case of
available Eskom data, 2006 in the case of LaPsis).
2.8 Provincial and municipal data
Provinces and municipalities collect data on informal settlements within their jurisdiction. Data sources
include aerial photography, household enumeration, municipal services data and geo spatial data.
All provinces and large metros were contacted as part of this research and asked to provide access
to available data. Three provinces (KZN, North West and Western Cape) and five municipalities (City
of Cape Town, City of Johannesburg, Ekurhuleni, eThekwini and Nelson Mandela Bay) provided
data to the project team. A summary of that data is provided in the provincial reports.
2.9 How to read this report
As noted various data sources have been used for this report. Estimates generated by these data
sources differ, sometimes significantly. Data sources have therefore been clearly noted throughout
the document. In most cases chapters begin with an overview of Census 2001 data. This data is
presented for informal settlement EAs and is highlighted in grey to enable readers to compare the
data with other references to Census data. The balance of the chapter refers to other data sources.
In the case of survey data, this is based on the dwelling type indicator ‘Shack not in a backyard’.page 22
SOUTH AFRICA research report
Part 3
The number and size
of informal settlements
in South Africa
3.1 Estimating the number of households who
live in informal settlements
According to the 2001 Census 1.11 million households in South Africa (9% of all households)
live in informal settlement EAs. Of all provinces Gauteng has the highest number of households
who live in informal settlement EAs. That province accounts for 31% of all households in
informal settlement EAs in the country (it accounts for 24% of all households overall). In terms
of penetration, the Free State has the highest proportion of households who live in informal
settlement EAs (14% of households in that province live in informal settlement EAs).
cha rt 3
Type of Enumeration Area by province: south africa
% of
households
per province
100 – 4% 3% 3% 4% 5% 3%
5% 9% 6%
4%
8% 2% 9% 9%
11% 16% 10%
22%
80 – 8%
38% 51%
36% 44%
60 –
77% 78% 75%
62%
40 – 68%
38%
34% 36%
20 – 35%
14% 12% 12% 11%
10% 9% 8%
0– 6% 4% 2%
Free KwaZulu- Gauteng Western Eastern Mpumalanga North Northern Limpopo
State Natal Cape Cape West Cape
Informal Settlement Urban Settlement Tribal Settlement Farm Other
Source: Census 2001.
Note: Other includes hostel, institution, industrial area, recreational, smallholding and sparse (10 or fewer households).page 23
SOUTH AFRICA research report
Census data at a municipal level is summarised below for those districts with the highest number
of households in informal settlement EAs.
tab le 7
Top ten municipalities with households living in Informal
Settlement EAs
Municipality Number of HH in Informal % of HH in municipality that
Settlement EA live in Informal Settlement EAs
eThekwini (KZN) 204 812 25%
Ekurhuleni (GA) 144 733 19%
City of Cape Town (WC) 89 126 11%
City of Tshwane (GA) 87 569 15%
City of Johannesburg (GA) 75 255 7%
Amatole (EC) 55 172 13%
Nelson Mandela Bay (EC) 40 447 15%
Lejweleputswa (FS) 40 379 21%
UMgungundlovu (KZN) 36 973 16%
Sedibeng (GA) 34 474 15%
Source: Census 2001.
The estimate of the number of households living in shacks not in backyards differs depending on
the data source. According to the 2007 Community Survey, approximately 1.2 million households
corresponding to 10% of households in South Africa live in shacks not in backyards, down from
1.38 million in 2001 (12% of households) as reported by the 2001 Census. In terms of absolute
numbers these data sources indicate a decline of around 162,000 households living in shacks
not in backyards across the country. The potential impact of sampling bias should be noted; it is
entirely possible that newly formed informal settlements were not included in the sampling fame
for the 2007 Community Survey. The trend may therefore reflect changes in well-established
settlements, some of which may have been upgraded between 2001 and 2007.page 24
SOUTH AFRICA research report
Estimates based on the GHS from 2002 to 2009 indicate that the number of households who
live in shacks not in backyards has grown, although this may well reflect changes to the sampling
frame rather than underlying dynamics. A comparison of census and survey data based on a
number of sources is summarised below.
ch art 4
Households by dwelling type: south africa
Number of
households
(000s)
14 000 – 13 812 – 14 000
13 351
12 501 12 901
12 075 12 476 12 458
12 000 – 11 784 11 784 11 712 – 12 000
11 013 11 362
10 000 – – 10 000
2 000 – – 2 000
1 000 – – 1 000
1 113 1 376 1 214 1 030 1 134 934 1 381 1 085 1 191 1 129 1 197 1 340
9% 12% 10% 9% 10% 8% 11% 9% 9% 8% 9% 11%
0– –0
Census Census CS GHS GHS GHS GHS GHS GHS GHS GHS IES
2001 2001 2007 2002 2003 2004 2005 2006 2007 2008 2009 2005/6
Total households
HH lives in informal settlement EA
HH lives in shack not in backyard
Source: Census 2001 (full database), Community Survey 2007, IES 2005/6, GHS 2002-2009 (reweighted).
Note: Dashed line indicates new sample designs for GHS (2002-2004, 2005-2007, 2008-2009).page 25
SOUTH AFRICA research report
As with national estimates, survey-based provincial estimates of the number of households
who live in shacks not in backyards vary, sometimes quite significantly. For instance, the 2007
Community Survey estimates around 110,000 households living in shacks not in backyards in the
Western Cape while the 2007 GHS estimates around 143,000 such households.
cha rt 5
Households living in shacks not in backyards, by province: south africa
Number of
households
(000s)
500 –
453
450 –
405
400 –
350 –
300 –
250 –
200 –
172
146 141 143
150 – 129
110 120
109 105 102
100 – 86
72
50 – 44
29 24 17
0–
Gauteng North KwaZulu- Western Free Eastern Mpumalanga Limpopo Northern
West Natal Cape State Cape Cape
Community Survey 2007 General Household Survey 2007
Total HH living in
1 214 236 1 190 522
shacks not in backyards
Source: Community Survey 2007, General Household Survey 2007.page 26
SOUTH AFRICA research report
While all provinces were contacted as part of this research, only three provinces provided relatively
recent estimates of the number of households or dwellings in informal settlements. Note that
estimates from the Western Cape are provisional. A comparison of this data and survey data is
summarised below.
tab le 8
Estimates of households and dwellings in informal settlements
(by province)
Number of households in informal settlements Number of
dwelling units
in informal
settlements
Census Census Community Provincial Provincial
2001: HH 2001: HH Survey estimates estimates
in informal in shacks 2007: HH
settlement not in in shacks
EA backyards not in
backyards
KwaZulu-Natal 268 800 177 989 140 961 306 076
North West 57 765 154 693 146 143 66 031
Western Cape 27 818 32 561 25 762 51 224
(excl. City of
Cape Town)
Note: ‘Dwelling units’ in the Western Cape estimates are shacks.
Census and survey data indicate that the provincial distribution of households living in shacks
not in backyards is heavily skewed towards Gauteng. According to the Census and Community
Survey roughly a third of households in shacks not in backyards live in this province (roughly one
quarter of all households in the country live in this province).page 27
SOUTH AFRICA research report
With regard to the penetration of shacks not in backyards, according to the Community Survey,
at 16% the North West Province has the highest proportion of households living in shacks not in
backyards. Data on the provincial profile of dwelling types is summarised below. In areas such as
KwaZulu-Natal and the Eastern Cape, traditional dwellings are prominent while backyard shacks
are noticeable in the North West, Gauteng and the Western Cape. Given that dwelling types in
informal settlements are not necessarily shacks not in backyards, there may be some justification
for the inclusion of other dwelling types in the analysis. However given the limitations of survey
data, there is no basis to assess what proportion of other dwelling types should be included.
ch art 6
Type of main dwelling by province: south africa
% of
households
per province
100 – 0% 0% 0% 1% 1% 1% 0% 0% 0%
80 –
55%
64%
73% 77% 77%
60 – 80% 84% 84% 85%
40 –
2% 37%
20 – 5% 27%
8% 8%
5% 7% 1%
4% 6%
3% 2% 9%
16% 14% 14% 2% 2%
9% 9% 8% 6% 6% 2%
0– 4%
North Gauteng Free Mpumalanga Northern Western Eastern KwaZulu- Limpopo
West State Cape Cape Cape Natal
Informal dwelling dwelling/shack not in backyard Formal dwelling
Informal dwelling/shack in backyard Other*
Traditional dwelling
Source: Community Survey 2007 HH.
Note: Other* includes caravan or tent, private ship/boat, and other.page 28
SOUTH AFRICA research report
Municipal level data is available in the Census and Community Survey23. According to the
Community Survey, of all the major metropolitan areas, Ekurhuleni has the highest number of
households living in shacks not in backyards at over 143,000. Between them, the five metropolitan
municipalities with the highest number of households who live in shacks not in backyards account
for 48% of all such households in the country. The chart below summarises this data together with
data on the penetration of this dwelling type by municipality. Together with Tshwane, Bojanala
(a municipality in which 23% of the employed population works in the mining industry24) has the
highest proportion of households who live in shacks not in backyards.
ch art 7
Households living in shacks not in backyard (by municipality): south africa
Number of
households % of HH living in shacks not in backyards
(000s) 17% 20% 10% 13% 9% 20% 12% 17% 17% 18% 15% 11% 16% 10%
160 –
143
140 – 135
121
120 –
105
100 –
84
80 – 72
60 – 53 51 47
40 – 36 34 31 30
25
20 –
0–
Ekurhuleni City of City of Amatole Southern Motheo West Rand
GT Johannesburg Cape Town EC NW FS GT
GT WC
City of eThekwini Bojanala Nkangala Lejweleputswa Nelson Gert Sibande
Tshwane KZN NW MP FS Mandela MP
GT EC
Source: Community Survey 2007 HH.
23
District level data is also available in the GHS up to 2007 although sample sizes are small.
24
Labour Force Survey 2007 September.page 29
SOUTH AFRICA research report
Data from the 2001 Census and the 2007 Community Survey can be used to identify areas where
growth in the number of households living in shacks not in backyards has been particularly rapid.
This data is summarised in the bubble chart below. The size of the bubble indicates the size of
the segment in 2007 while its location along the x-axis indicates the annual rate of growth. Of
course in some of these areas (such as Kgalagadi) high growth has occurred off a very low base.
For those areas with significant scale, the City of Tshwane has the highest rate of growth at
4% per annum. At the other end of the spectrum, in the Nelson Mandela Bay Municipality the
number of households living in shacks not in backyards has declined noticeably. Once again,
the impact of possible sampling bias should be noted.
c ha rt 8
Households living in shacks not in backyards
(by municipality) – CAGR: South Africa
Municipalities with positive compound annual growth (2001-2007)
KZN
Umzinyathi
MP 2 264
GA Nkangala 7%
Tshwane 50 681
135 352 6% NC
NC NW
Siyanda 4% LP Kgalagadi
Southern
6 107 NW Sekhunene 3 193
46 986 Central
3% 10 701 9%
5% 20 565
6% 7%
0% 5% 10%
Municipalities with negative compound annual growth (2001 -2007)
EC
Chris Hani FS
3 670 Thabo
-8% Mofutsanyane
WC
18 825
Overberg LP
-7%
3 259 Capricorn
KZN -9% 12 104
Umgungundlovu -8%
6 840 FS
EC EC Fezile Dabi
-14% Cacadu Nelson
Mandela 14 617
5 033 -7%
30 750
-9% -8%
-15% -10% -5%
Source: Census 2001 and Community Survey 2007.
Note: Only municipalities with 70 or more observations were included. The top 8 municipalities for positive
growth and negative growth were used.You can also read