SOLVING FLORIDA'S BLUE-GREEN ALGAE CRISIS: A CONCERTED APPROACH - by Vittorio Nastasi July 2020 - Reason Foundation
←
→
Page content transcription
If your browser does not render page correctly, please read the page content below
SOLVING FLORIDA’S
BLUE-GREEN ALGAE CRISIS:
A CONCERTED APPROACH
by Vittorio Nastasi

July 2020
Reason Foundation’s mission is to advance a free society by developing,
applying and promoting libertarian principles, including individual
liberty, free markets and the rule of law. We use journalism and public
policy research to influence the frameworks and actions of policymakers,
journalists and opinion leaders.

Reason Foundation’s nonpartisan public policy research promotes
choice, competition and a dynamic market economy as the foundation
for human dignity and progress. Reason produces rigorous, peer-
reviewed research and directly engages the policy process, seeking
strategies that emphasize cooperation, flexibility, local knowledge
and results. Through practical and innovative approaches to complex
problems, Reason seeks to change the way people think about issues,
and promote policies that allow and encourage individuals and
voluntary institutions to flourish.

Reason Foundation is a tax-exempt research and education organization
as defined under IRS code 501(c)(3). Reason Foundation is supported by
voluntary contributions from individuals, foundations and corporations.
The views are those of the author, not necessarily those of Reason
Foundation or its trustees.
SOLVING FLORIDA’S BLUE-GREEN ALGAE CRISIS: A CONCERTED APPROACH                                                                                                                    i

TABLE OF CONTENTS

PART 1                 INTRODUCTION ................................................................................................................... 1
PART 2                 HISTORY OF DEVELOPMENT IN THE EVERGLADES REGION .......................................... 5
PART 3                 OVERVIEW OF WATER ISSUES IN FLORIDA...................................................................... 9
PART 4                 SOURCES OF NUTRIENT POLLUTION .............................................................................. 13
                       4.1 RESIDENTIAL AND AGRICULTURAL FERTILIZER RUNOFF .......................................... 17
                       4.2 MUNICIPAL WASTEWATER MANAGEMENT ....................................................................... 20

PART 5                 SOUTH FLORIDA ECOSYSTEM RESTORATION (SFER) .................................................. 27
                       5.1 KEY TERMS AND TOOLS FOR WATER MANAGEMENT .................................................. 31
                       5.2 STATE-MANAGED RESTORATION STRATEGIES ............................................................... 34
                       5.3 ADDRESSING NORTHERN RUNOFF ...................................................................................... 35
                       5.4 LAKE OKEECHOBEE ................................................................................................................... 37
                       5.5 RIVERS AND ESTUARIES........................................................................................................... 40
                       5.6 SENDING WATER SOUTH ......................................................................................................... 43
                       5.7 MODIFIED DELIVERIES TO EVERGLADES NATIONAL PARK
                       (FOUNDATION PROJECT) ................................................................................................................. 44
                       5.8 CANAL 111 (C-111) SOUTH DADE PROJECT (FOUNDATION PROJECT)................... 46
                       5.9 NORTHERN EVERGLADES AND ESTUARIES PROTECTION PROGRAM .................... 46
                       5.10 CALOOSAHATCHEE ESTUARY BASIN MANAGEMENT ACTION PLAN .................... 47
                       5.11 ST. LUCIE BASIN MANAGEMENT ACTION PLAN ........................................................... 49
                       5.12 LAKE OKEECHOBEE BASIN MANAGEMENT ACTION PLAN.............................................. 51
PART 6                 POLICY RECOMMENDATIONS .......................................................................................... 57
                       6.1 PRIVATE .......................................................................................................................................... 57
                       6.2 MUNICIPAL .................................................................................................................................... 58
                       6.3 STATE AND FEDERAL ................................................................................................................ 60
ABOUT THE AUTHOR ................................................................................................................................... 63

                                                                                                                                                        Vittorio Nastasi
SOLVING FLORIDA’S BLUE-GREEN ALGAE CRISIS: A CONCERTED APPROACH                      ii

LIST OF ABBREVIATIONS
ASR               Aquifer Storage and Recovery Well
BMAP              Basin Management Action Plan
BMP               Best Management Practices
C-111             C-111 South Dade Project
C-43              C-43 Storage Reservoir
C-44              C-44 Storage Reservoir
C&SF              Central and Southern Florida Project
CERP              Comprehensive Everglades Restoration Project
COP               Combined Operational Plan
EPA               U.S. Environmental Protection Agency
FDEP              Florida Department of Environmental Protection
FDOH              Florida Department of Health
EAA               Everglades Agricultural Area
EFA               Everglades Forever Act
ENP               Everglades National Park
FDACS             Florida Department of Agriculture and Consumer Services
FEB               Flow Equalization Basin
FWC               Florida Fish and Wildlife Conservation Commission
HABOS             Harmful Algal Bloom Operational Strategy
HHD               Herbert Hoover Dike
IDS               Integrated Delivery Schedule
IRL-S             Indian River Lagoon South Project
LOWCP             Lake Okeechobee Watershed Construction Project
LOPPU             Lake Okeechobee Protection Plan Update
LORS              Lake Okeechobee Regulation Schedule
LOSOM             Lake Okeechobee System Operation Manual
LOWRP             Lake Okeechobee Watershed Restoration Project
MWD               Modified Water Deliveries to Everglades National Park
NEEPP             Northern Everglades and Estuaries Protection Program
Ppb               Parts Per Billion
PPP               Public-Private Partnership
SFWMD             South Florida Water Management District
SMA               8.5 Square Mile Area
STA               Stormwater Treatment Area
TMDL              Total Maximum Daily Load
TN                Total Nitrogen
TP                Total Phosphorus
TSP               Tentatively Selected Plan
USACE             United States Army Corps of Engineers
WCA               Water Conservation Area
WY                Water Year

Vittorio Nastasi | Solving Florida’s Blue-Green Algae Crisis: A Concerted Approach

SOLVING FLORIDA’S BLUE-GREEN ALGAE CRISIS: A CONCERTED APPROACH                                 1

PART 1

 INTRODUCTION
 Florida is one of the fastest growing states in the nation with over 300,000 new residents
 arriving each year, but the environmental costs of rapid development could jeopardize
 future growth. Decades of water mismanagement have exacerbated naturally occurring
 algal blooms that are now plaguing the Sunshine State. Toxic cyanobacteria, or blue-green
 algae, thrive in freshwater and brackish habitats like the lakes, rivers, and estuaries found
 throughout Florida. Algal blooms occur when large amounts of nutrients—nitrogen and
 phosphorus—enter a body of water causing a slimy green layer to form on the water’s
 surface in a process known as eutrophication.

 Increased nutrient levels, combined with sunlight and slow-moving water, provide the
 necessary conditions for algal blooms to form. Non-toxic algae can kill fish by clogging
 their gills and kill plant-life by blocking sunlight from reaching below the surface. As the
 algae die, their decomposition consumes large amounts of oxygen in the water which
 suffocates fish and other marine animals. This oxygen depletion is known as hypoxia and
 leads to “dead zones” in oceans, lakes, and rivers.1 Large algal blooms can result in
 thousands of dead fish whose decomposition further pollute water systems and contribute
 to further algal growth. In addition to the effects of non-toxic algal blooms, toxic blue-

 1
     “Nutrient Pollution.” EPA.gov, U.S. Environmental Protection Agency. Web.
     www.epa.gov/nutrientpollution/effects-environment Accessed 19 Feb. 2020.

                                                                                  Vittorio Nastasi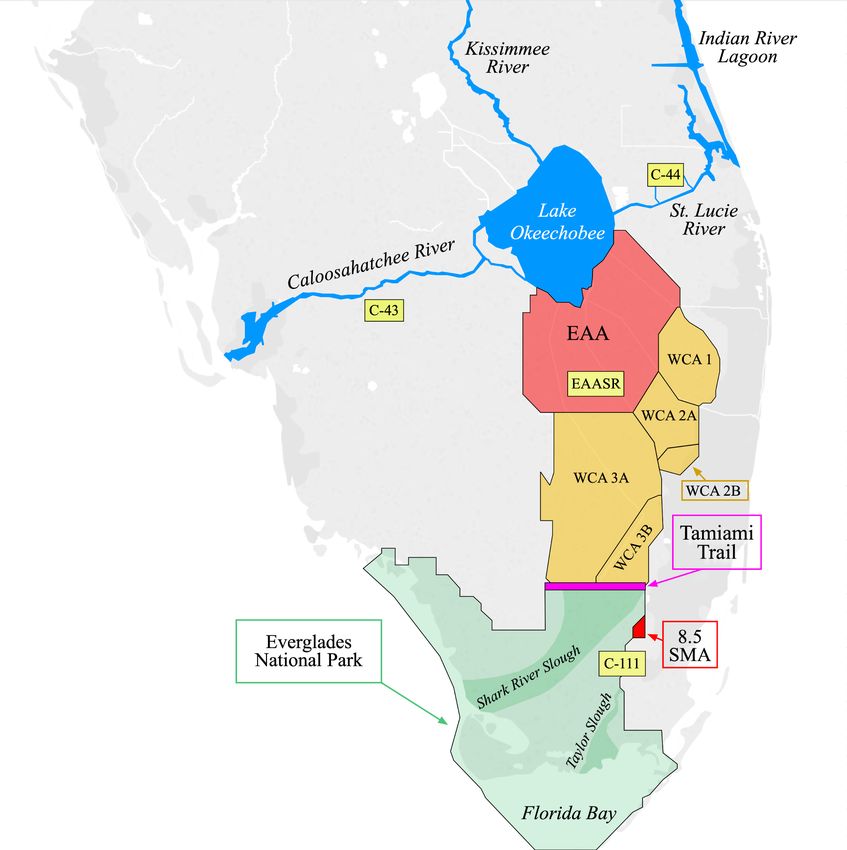
SOLVING FLORIDA’S BLUE-GREEN ALGAE CRISIS: A CONCERTED APPROACH                                                 2

green algae can accumulate through the food chain as smaller organisms consume algae
and are then consumed by larger organisms. Severe blooms can kill wildlife and have
serious health consequences for humans. According to state officials, contact with or
accidental ingestion of the algae can cause irritation of the gastrointestinal tract, liver,
nervous system, and skin.2 Research also suggests that long-term exposure to blue-green
algae through the consumption of aquatic organisms may be linked to the development of
neurodegenerative disorders like ALS and Alzheimer’s.3

 Algal blooms and their associated health risks could hurt tourism along with large
segments of Florida’s economy. Tourists list Florida’s beaches as their primary reason for
visiting—more often than theme parks, retail, dining, and nightlife.4 When tourists visit
Florida, they stay in hotels, eat at restaurants, and shop—contributing to the state’s overall
economic activity. If algal blooms deter tourists, it could have rippling effects throughout
the economy. Florida is also known as the sportfishing capital of the world. In the year
2011 alone, over 1.9 million residents and 1.2 million visitors fished in Florida waters, but
algal blooms are threatening Florida’s sportfishing industry and the economies of many
coastal communities. 5 Marinas, boat charters, and bait shops have struggled as
deteriorating water quality continues to reduce fish populations and drive away visiting
anglers.6

Blue-green algal blooms occur in water bodies all around the state, including the St. Johns
and Loxahatchee rivers, but Lake Okeechobee and the wider Everglades region are by far
the largest and most complex components of Florida’s water quality issues. Blooms are
largely caused by nutrient runoff into the lake from Orlando and Kissimmee that then flows

2
    “Cyanobacteria (Blue-Green Algae).” myfwc.com, Florida Fish and Wildlife Conservation Commission. Web.
    myfwc.com/research/wildlife/health/other-wildlife/cyanobacteria/ Accessed 19 Feb. 2020.
3
    Kiniry, Mike and Julie Glenn. “Researchers Explore Possible Connections Between BMAA and
    Neurodegenerative Disorders.” WGCU Public Media. 19 July 2019. Web. news.wgcu.org/post/researchers-
    explore-possible-connections-between-bmaa-and-neurodegenerative-disorders
4
    “Economic Evaluation of Florida’s Investment in Beaches.” Florida Office of Economic and Demographic
    Research. EDR.state.fl.us. January 2015. Web. edr.state.fl.us/Content/returnoninvestment/BeachReport.pdf
    19 February 2020.
5
    “2011 National Survey of Fishing, Hunting, and Wildlife-Associated Recreation.” U.S. Department of the
    Interior, U.S. Fish and Wildlife Service, and U.S. Department of Commerce, U.S. Census Bureau. Census.gov.
    October 2018. Web. www2.census.gov/programs-surveys/fhwar/publications/2011/fhw11-fl.pdf 19 Feb.
    2020.
6
    McKean, Andrew. “Florida's Water Crisis Has Sport Fishing on the Brink of Collapse.” Outdoor Life. Web. 2
    July 2019. www.outdoorlife.com/floridas-water-crisis-has-sport-fishing-on-brink-collapse/ 19 Feb. 2020

Vittorio Nastasi | Solving Florida’s Blue-Green Algae Crisis: A Concerted Approach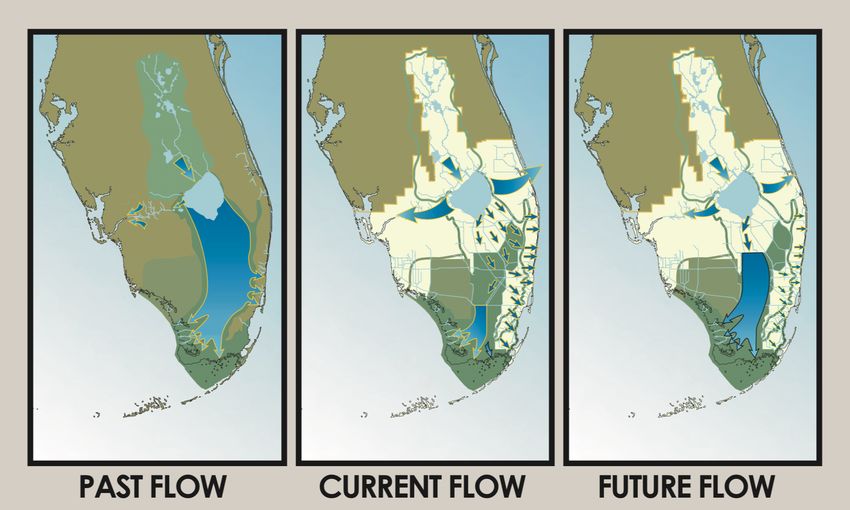
SOLVING FLORIDA’S BLUE-GREEN ALGAE CRISIS: A CONCERTED APPROACH                                             3

to the coasts through the Caloosahatchee and St. Lucie Rivers (Figure 1). Severe algal
blooms have become more frequent over recent years causing state of emergency
declarations in 2016 and 2018. These episodes were largely triggered by major storm
events and higher-than-average rainfall in those years.7 In July 2018, the National Oceanic
and Atmospheric Administration reported that up to 90% of Lake Okeechobee contained
the toxic blue-green algae.8 Later that summer, areas along the Caloosahatchee and St.
Lucie rivers also experienced algal blooms, which led to environmental and economic
damages in the surrounding communities.

    FIGURE 1: OVERVIEW OF MAJOR WATER BODIES

7
      “2019 South Florida Environmental Report: Highlights.” South Florida Water Management District.
      SFWMD.gov. Web. apps.sfwmd.gov/sfwmd/SFER/2019_sfer_final/2019_sfer_highlights_hr.pdf 19 Feb. 2020
8
      Elsken, Katrina. “NOAA: Blue-Green Algae in 90 Percent of Lake Okeechobee.” Lake Okeechobee News. 3
      July 2019. Web. lakeokeechobeenews.com/lake-okeechobee/noaa-blue-green-algae-covers-90-percent-
      of-lake-okeechobee/ 19 Feb. 2020

                                                                                             Vittorio Nastasi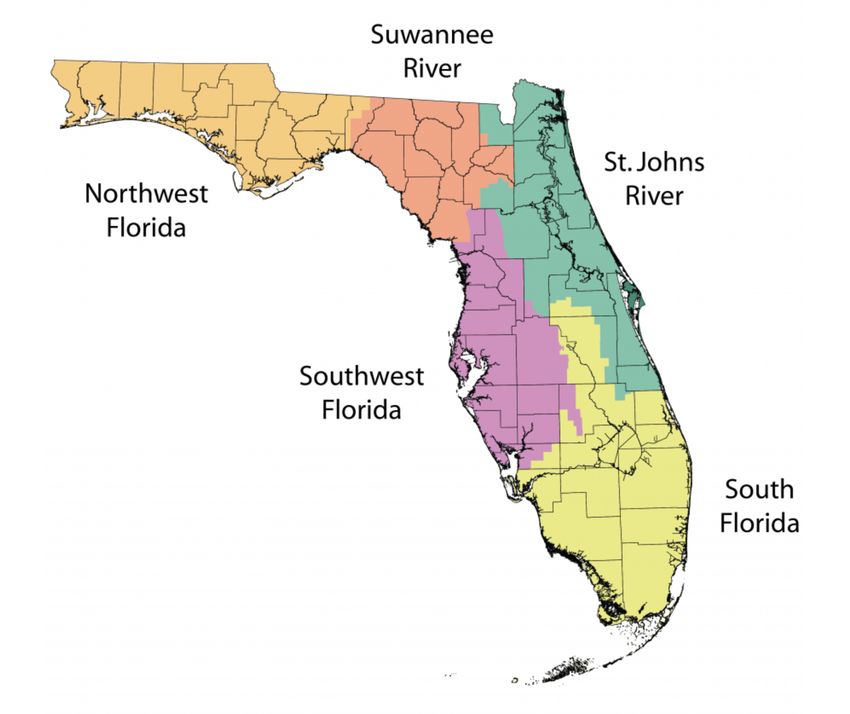
SOLVING FLORIDA’S BLUE-GREEN ALGAE CRISIS: A CONCERTED APPROACH                                           4

Florida lawmakers passed the sweeping Clean Waterways Act in 2020 which addressed
many of the underlying causes of algal blooms. However, there is broad consensus that
additional action is necessary. Disagreement over who is responsible and the best approach
to mitigation will likely stall further management efforts. Environmental groups point to
agricultural producers and the disruption of natural water flows through the Everglades.
Others cite urban and suburban runoff including fertilizers and untreated wastewater. The
truth is most likely a combination of all these factors. This report aims to identify the
causes of water degradation, mechanisms for mitigation, and how to fund the necessary
interventions. The findings and recommendations of the report closely align with the first
round of recommendations from Florida’s recently appointed Blue Green Algae Task Force.9

9
    “Blue-Green Algae Taskforce Consensus Document #1.” Florida Department of Environmental Protection.
    FloridaDEP.gov. 11 Oct. 2019. Web.
    https://floridadep.gov/sites/default/files/Final%20Consensus%20%231_0.pdf

Vittorio Nastasi | Solving Florida’s Blue-Green Algae Crisis: A Concerted Approach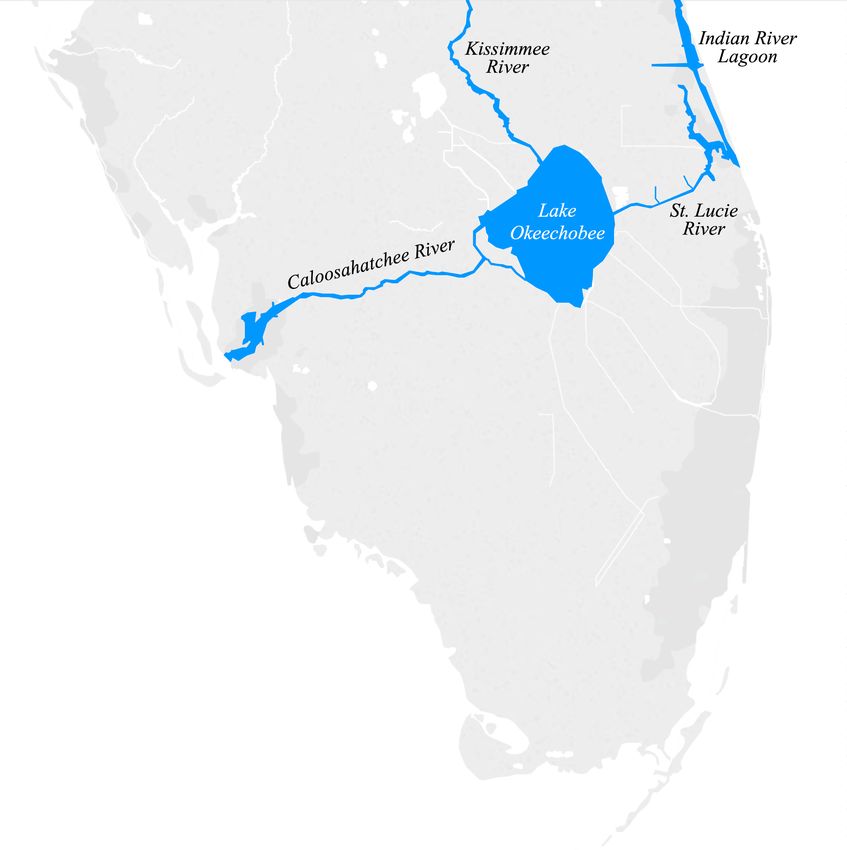
SOLVING FLORIDA’S BLUE-GREEN ALGAE CRISIS: A CONCERTED APPROACH                                  5

PART 2

 HISTORY OF
 DEVELOPMENT IN THE
 EVERGLADES REGION
 Prior to human settlement, the Everglades region was nearly twice the size it is today.
 Water flowed freely through the Everglades starting in Kissimmee, down through Lake
 Okeechobee, and into the Gulf from the southern end of the Florida peninsula (Figure 2).
 Nutrients including nitrogen and phosphorous originating upstream were taken up by a
 vast “river of grass” to the south. This flow of water and nutrients gave rise to a wide range
 of wildlife in one of the most unique and diverse ecosystems on the planet.

 Prior to human settlement, the Everglades region was nearly twice the
 size it is today.

                                                                                   Vittorio Nastasi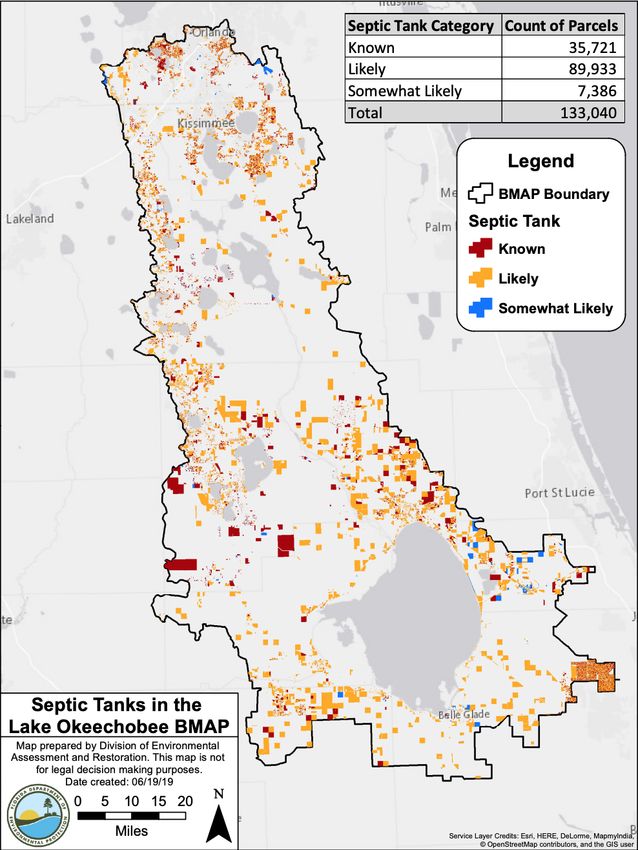
SOLVING FLORIDA’S BLUE-GREEN ALGAE CRISIS: A CONCERTED APPROACH                                                       6

 FIGURE 2: PAST AND CURRENT WATER FLOW THROUGH THE EVERGLADES

                       Past Flow                                              Current Flow

Source: U.S. Army Corps of Engineers https://usace.contentdm.oclc.org/utils/getfile/collection/p16021coll11/id/4195

Beginning in the 1850s with the passage of the Swamplands Act, lands in central and south
Florida were cleared for agricultural development. The Act transferred 20 million acres of
land from the federal government to the state of Florida, which was drained to make way
for food crops and cattle farms. Drainage efforts continued through the middle of the 20th
century as part of a national movement to settle undeveloped wetlands. In the early 1900s,
Florida Governor Napoleon Bonaparte Broward initiated large-scale projects that were
highly successful at draining land for agricultural use. These drainage projects created new
opportunities for migrants looking to settle in central and south Florida, resulting in
increased land values and massive population growth.

Vittorio Nastasi | Solving Florida’s Blue-Green Algae Crisis: A Concerted Approach
SOLVING FLORIDA’S BLUE-GREEN ALGAE CRISIS: A CONCERTED APPROACH 7
By the 1920s, an estimated 2,000 residents lived in the area surrounding Lake
Okeechobee.10 Canals were constructed and a modest levee was built out of muck and sand
to prevent flooding south of the lake. However, two hurricanes in the 1920s caused waters
to spill out of the lake, destroying homes and claiming thousands of lives. In response to
these tragedies, President Herbert Hoover instructed the U.S. Army Corps of Engineers
(USACE) to intervene. A plan was devised to surround the lake with a dike and construct
additional canals to the east and west to direct excess water through the Caloosahatchee
and St. Lucie rivers. The Herbert Hoover Dike (HHD)—a 143-mile-long earthen dam
surrounding Lake Okeechobee—was completed in the 1930s and further development soon
followed. Then, in 1947, another hurricane caused severe flooding and damages to life and
property. To prevent future catastrophe, Congress authorized the Central and Southern
Florida Project (C&SF) in 1948.
The C&SF is composed of a vast network of canals and levees that direct the flow of water
in south Florida. The authorizing legislation also designated over 1,000 square miles of
fertile land south of Lake Okeechobee as the Everglades Agricultural Area (EAA). In 1949,
the Florida Legislature established the Central and Southern Florida Control District, the
precursor to the South Florida Water Management District (SFWMD), to manage the project
(Figure 3). The C&SF was very successful at preventing floods and protecting agricultural
interests in the EAA, but significantly altered the natural flow of water and nutrients
through the region.
In short, the development of the Everglades region has resulted in
tremendous growth and agricultural productivity. These benefits,
however, have come at great cost to Florida’s environment…
In short, the development of the Everglades region has resulted in tremendous growth and
agricultural productivity. These benefits, however, have come at great cost to Florida’s
environment and required significant interventions by state and federal government. For
10
Clement, Gail. “Everglades Timeline.” Everglades.FIU.edu, Publication of Archival Library and Museum
Materials. Web. everglades.fiu.edu/reclaim/timeline/timeline7.htm Accessed 19 Feb. 2020.
Vittorio NastasiSOLVING FLORIDA’S BLUE-GREEN ALGAE CRISIS: A CONCERTED APPROACH 8 over a century, drainage projects were pursued without a clear understanding of the Everglades ecosystem and the adverse effects of altering the flow of water through it. Consequently, millions of Floridians work and live on former wetlands that can never be fully restored. Overcoming the cumulative effects of more than a century of misguided interventions is no small task. Rather than simply curbing development, the state must fundamentally rethink the way it manages water resources in order to achieve long-term sustainability. FIGURE 3: FLORIDA WATER MANAGEMENT DISTRICTS Source: Florida Department of Environmental Protection. Water Management Districts. https://floridadep.gov/water- policy/water-policy/content/water-management-districts#SF Vittorio Nastasi | Solving Florida’s Blue-Green Algae Crisis: A Concerted Approach
SOLVING FLORIDA’S BLUE-GREEN ALGAE CRISIS: A CONCERTED APPROACH                                          9

PART 3

 OVERVIEW OF WATER
 ISSUES IN FLORIDA
 Florida’s water issues can be boiled down to the quality, quantity, timing, and distribution
 of water. The South Florida Water Management District is a regional agency that manages
 water resources in south Florida, including the historic Everglades region. The District
 serves over 8.7 million Floridians (40% of the state’s population),11 providing flood control
 and water supply through an expansive water control system including:
      •   Approximately 2,200 miles of canals and 2,100 miles of levees
      •   More than 778 water control structures and 621 project culverts
      •   84 pump stations
      •   About 3,500 hydrological monitoring stations12

 The U.S. Army Corps of Engineers operates the Herbert Hoover Dike and other water
 management projects throughout the Everglades region. Funding for many of these
 projects, including the Dike, is split evenly between the federal government and the state

 11
      “Who We Are.” SFWMD.gov, South Florida Water Management District. Web. www.sfwmd.gov/who-we-are
      Accessed 19 Feb. 2020
 12
      “Quick Facts and Figures.” SFWMD.gov, South Florida Water Management District. Web.
      www.sfwmd.gov/who-we-are/facts-and-figures Accessed 19 Feb. 2020

                                                                                            Vittorio Nastasi
SOLVING FLORIDA’S BLUE-GREEN ALGAE CRISIS: A CONCERTED APPROACH 10
of Florida. The operation of these structures determines the quality, quantity, timing, and
distribution of water in the region.
At the heart of Florida’s water problems is the state’s largest water storage mechanism,
Lake Okeechobee. It is the largest lake in the southeastern United States with a surface
area of 730 square miles. The volumes of water in question are so large they must be
expressed in acre-feet rather than gallons. One acre-foot is equivalent to the volume of
water needed to cover one acre of land with one foot of water (about 325,851 gallons). At
an average depth of approximately nine feet, Lake Okeechobee has a carrying capacity of
over four million acre-feet of water.
Much of the historical water-flow to the north of Lake Okeechobee remains intact, but the
Herbert Hoover Dike and other flood control measures prevent water from flowing south of
the lake (Figure 2). Reduced water flow combined with contamination and water-quality
degradation has adversely affected Florida ecosystems.13 Large volumes of nutrients
including nitrogen and phosphorus enter Lake Okeechobee originating from residential
fertilizers, sewer systems, and cattle ranches to the north. Water containing nutrients from
agricultural fertilizers in the EAA is also pumped into the lake. These nutrients, combined
with the Florida sun, create the perfect conditions for algae to form and grow. As a result,
algal blooms in Lake Okeechobee are common.
In its annual South Florida Environmental Reports, the South Florida Water Management
District reports water flows in and out of Lake Okeechobee. The reports measure water
flows over the course of each “water year” beginning in May and ending in April. The
reports use “water years” instead of calendar years to align more closely with the
hydrological cycle of the region. Over three million acre-feet of water flowed into Lake
Okeechobee in water year 2018 (May 2017–April 2018). Historically, water levels were
allowed to rise with the inflow of water, but the Herbert Hoover Dike—at nearly 60 years
old—has been weakened by age and seepage. The degradation of the Dike has led to
concerns that high water levels in Lake Okeechobee could result in catastrophic failure. To
prevent further seepage and reduce the risk of failure, water levels are discharged ahead of
wet seasons and major storm events before increasing naturally due to rainfall. There are
ongoing efforts to repair the Herbert Hoover Dike, which could increase the lake’s storage
13
National Academies of Sciences, Engineering, and Medicine. “Progress Toward Restoring the Everglades:
The Seventh Biennial Review - 2018.” Washington, DC: The National Academies Press, 2018.
doi.org/10.17226/25198.
Vittorio Nastasi | Solving Florida’s Blue-Green Algae Crisis: A Concerted ApproachSOLVING FLORIDA’S BLUE-GREEN ALGAE CRISIS: A CONCERTED APPROACH 11
capacity by up to 364,000 acre-feet of water.14 However, the additional capacity provided
by repairs would not be sufficient to stem the mandated discharges from the lake and do
not provide a long-term solution to the mandatory discharges.
Regulatory schedules mandate releases aiming to establish safe water levels. The current
schedule, established in 2007, reduced the storage capacity of Lake Okeechobee by
hundreds of thousands of acre-feet. The discharges flow through two canals to the east and
west of the lake, spreading to Florida’s interconnected system of lakes, rivers, and estuaries.
Massive amounts of nutrient-laden water are discharged through the Caloosahatchee and
St. Lucie rivers and into downstream estuaries along Florida’s coast where they contribute
to algal blooms and disrupt natural water conditions. In water year 2018, 1,324,234 acre-
feet of water was discharged through the Caloosahatchee Canal from Lake Okeechobee.
Another 636,399 acre-feet was discharged to the St. Lucie Canal while only 525,091 acre-
feet flowed south. Table 1 provides a summary of water inflows and outflows to and from
Lake Okeechobee.
TABLE 1: WATER FLOW IN AND OUT OF LAKE OKEECHOBEE (ACRE-FEET)
Water Body WY2018 WY2015-WY2018 Average
Lake Okeechobee Total Inflows 3,386,788 2,915,881
Lake Okeechobee Total Outflows 2,613,134 2,385,574
• Caloosahatchee Canal 1,324,234 1,026,216
• St. Lucie Canal 636,399 387,164
• South 525,091 938,818
• Other 127,410 *
* Other flows from Lake Okeechobee not available in 2015-2017 Environmental Reports.
Source: South Florida Water Management District 2015-2019 Environmental Reports.
There are two key components to addressing toxic blue-green algal blooms in Florida. First,
sources of nutrient pollution must be identified and managed to reduce the amount of
nitrogen and phosphorus reaching Lake Okeechobee. Second, several existing and
proposed water storage projects will reduce the need to release water from the lake into
14
Peterson, Dan. “Everglades Restoration: Facts from the Past, Projects for the Present, Recommendations
for the Future.” The Coalition for Property Rights-FL, 2019. Web.
www.cpr-fl.org/everglades-restoration/ 19 Feb. 2020
Vittorio NastasiSOLVING FLORIDA’S BLUE-GREEN ALGAE CRISIS: A CONCERTED APPROACH 12 the St. Lucie and Caloosahatchee rivers by allowing more water to flow south. Part 4 discusses nutrient pollution while Part 5 describes various projects to alter the current flow of water through central and south Florida. Part 6 describes policy recommendations to achieve restoration and realign incentives to protect Florida’s water resources from further degradation. Vittorio Nastasi | Solving Florida’s Blue-Green Algae Crisis: A Concerted Approach
SOLVING FLORIDA’S BLUE-GREEN ALGAE CRISIS: A CONCERTED APPROACH                               13

PART 4

 SOURCES OF NUTRIENT
 POLLUTION
 A watershed is the area of land that feeds into a body of water like a lake, river, or stream
 (Figure 4). When it rains, the topography of the land in an area determines where and how
 the water flows. Generally, water moves from areas of high elevation to water bodies at
 lower elevations. Water can travel over the ground surface as overland flow or percolate
 into the soil to flow as groundwater. Smaller water bodies such as streams often feed into
 larger lakes and rivers. Consequently, their watersheds can be considered sub-watersheds
 of the larger body. Human activity within a watershed can have detrimental effects on
 water quality in receiving water bodies. For example, nutrient runoff from urban and
 agricultural areas can make its way to lakes, rivers, and streams where elevated nutrient
 levels trigger algal blooms.

 The sprawling Lake Okeechobee Watershed covers over 5,000 square miles (3,200,000
 acres) including the Kissimmee River which begins just south of Orlando and conveys over
 800,000 acre-feet of water from Lake Kissimmee to Lake Okeechobee annually (Figure 5).
 Stormwater runoff from Orlando and other inland areas flows to the Kissimmee River
 where it is carried to Lake Okeechobee, depositing nutrients like nitrogen and phosphorus
 along the way. In urban areas, residential fertilizers and wastewater are among the main
 sources of nutrient pollution. Agricultural areas also contribute through fertilizers and
 animal waste. A 2011 report from the South Florida Water Management District, Florida
 Department of Environmental Protection (FDEP), and Florida Department of Agriculture and

                                                                                  Vittorio Nastasi
SOLVING FLORIDA’S BLUE-GREEN ALGAE CRISIS: A CONCERTED APPROACH 14
Consumer Services (FDACS) includes estimates of phosphorus imports by land use (Table 2,
Figure 6). The findings indicated that agricultural land uses were responsible for the
majority of phosphorus imports, but the contributions of different agricultural activities
varied widely. The report also found that urban areas were responsible for 29% of net
phosphorus imports to the Lake Okeechobee Watershed.15
FIGURE 4: HOW WATER FLOWS THROUGH A WATERSHED
Source: Lake County, IL Stormwater Management Commission http://www.lakecountyil.gov/2375/Watersheds
15
“Lake Okeechobee Protection Plan Update.” South Florida Water Management District, Florida
Department of Environmental Protection, and Florida Department of Agriculture and Consumer Services.
SFWMD.gov. March 2011. 54–55. Web.
www.sfwmd.gov/sites/default/files/documents/lopp_update_2011.pdf
Vittorio Nastasi | Solving Florida’s Blue-Green Algae Crisis: A Concerted ApproachSOLVING FLORIDA’S BLUE-GREEN ALGAE CRISIS: A CONCERTED APPROACH 15
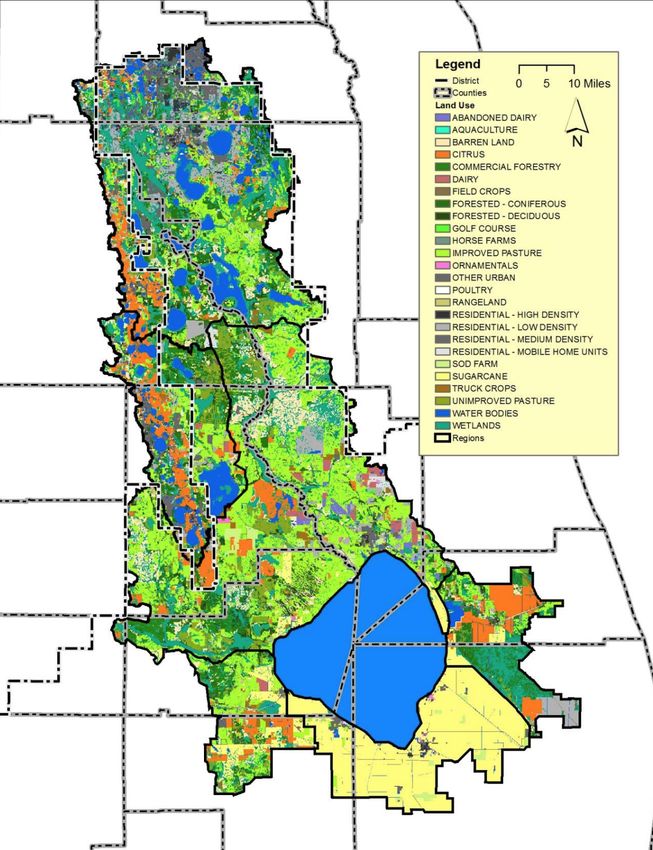
FIGURE 5: LAND USE IN THE LAKE OKEECHOBEE WATERSHED
Image Source: “Lake Okeechobee Protection Plan Update.” March 2011.
https://www.sfwmd.gov/sites/default/files/documents/lopp_update_2011.pdf
Vittorio NastasiSOLVING FLORIDA’S BLUE-GREEN ALGAE CRISIS: A CONCERTED APPROACH 16
In coastal communities, nutrient pollution quickly makes its way to estuaries, lagoons, or
the ocean. Moreover, human interventions in the environment have exacerbated the spread
of pollutants through Florida’s water systems. Sources of pollution in the Lake Okeechobee
Watershed also contribute to pollution in the Caloosahatchee and St. Lucie rivers. The
artificial links between these rivers and the lake have effectively expanded estuarine
watersheds to include all of the Lake Okeechobee Watershed (Figure 7). As a result, the
water quality in the St. Lucie Estuary is dependent on conditions in the Kissimmee River,
EAA, and Lake Okeechobee in addition to its own natural watershed.16 This effect highlights
the need to address both inland and coastal sources of nutrient pollution.
TABLE 2: NET PHOSPHORUS IMPORTS TO LAKE OKEECHOBEE WATERSHED BY LAND USE
Land-use Area (Acres) % (Area) Net Phosphorus % (Import)
Import (mt)
Barren Land 41,318 1.20 – 0.00
Citrus 245,790 7.14 1,274 20.93
Dairies 23,361 0.68 470 7.72
Improved Pasture 676,991 19.67 1,916 31.47
Other Areas 30,935 0.90 170 2.79
Row Crops 23,238 0.68 309 5.08
Sod 38,425 1.12 -256 -4.20
Sugarcane 399,213 11.60 543 8.92
Unimproved 325,064 9.44 -84 -1.38
Pastures/Rangeland
Upland Forest 392,200 11.39 -36 -0.59
Urban 410,397 11.92 1,783 29.29
Water Bodies 219,847 6.39 – 0.00
Wetlands 615,081 17.87 – 0.00
Totals 3,441,861 100 6,088 100
Source: “Lake Okeechobee Protection Plan Update. March 2011.
https://www.sfwmd.gov/sites/default/files/documents/lopp_update_2011.pdf
16
Lapointe, Brian E., Laura W. Harren and Bradley J. Bedford. “Effects of Hurricanes, Land Use, and Water
Management on Nutrient and Microbial Pollution: St. Lucie Estuary, Southeast Florida.” Journal of Coastal
Research 28 (6) (2012). Web. doi.org/10.2112/JCOASTRES-D-12-00070.1
Vittorio Nastasi | Solving Florida’s Blue-Green Algae Crisis: A Concerted ApproachSOLVING FLORIDA’S BLUE-GREEN ALGAE CRISIS: A CONCERTED APPROACH 17
FIGURE 6: NET PHOSPHORUS IMPORTS TO LAKE OKEECHOBEE WATERSHED
BY LAND USE
4.1 RESIDENTIAL AND AGRICULTURAL FERTILIZER RUNOFF
Residential and agricultural fertilizer use is a major source of nutrient pollution that feeds
algal blooms. During storms, water runoff carries sediments and nutrients from fertilizers
into nearby waterways where they provide the necessary conditions for algae to grow.
Stormwater runoff from Orlando and other areas in the Lake Okeechobee Watershed makes
it way to the Kissimmee River where it is carried to Lake Okeechobee, depositing nutrients
along the way. This nutrient-laden water eventually gets discharged to the coast through
the St. Lucie and Caloosahatchee rivers. Along the coast, runoff flows directly into the
ocean, estuaries, and lagoons. In an effort to reduce urban fertilizer runoff, several
municipalities have adopted ordinances to limit fertilizer application during wet seasons.
Ongoing projects to increase water storage north of the lake will reduce the impacts of
urban development to the north.
Vittorio NastasiSOLVING FLORIDA’S BLUE-GREEN ALGAE CRISIS: A CONCERTED APPROACH 18 FIGURE 7: LAKE OKEECHOBEE, ST. LUCIE, AND CALOOSAHATCHEE WATERSHEDS Source: South Florida Water Management District. “Lake Okeechobee Protection Plan Update.” March 2011. https://www.sfwmd.gov/sites/default/files/documents/lopp_update_2011.pdf Vittorio Nastasi | Solving Florida’s Blue-Green Algae Crisis: A Concerted Approach
SOLVING FLORIDA’S BLUE-GREEN ALGAE CRISIS: A CONCERTED APPROACH                                              19

Environmental groups frequently cite agricultural producers as the primary source of nutrient
pollution that causes algal blooms. Indeed, the vast majority of phosphorus imports to the
Lake Okeechobee Watershed are by agricultural producers, but the contributions of specific
types of agricultural activities vary. Sugarcane fields dominate production in the EAA while
cattle ranching is the primary activity to the north of Lake Okeechobee (Figure 5). Cattle
ranches in the Lake Okeechobee Watershed likely contribute to nutrient pollution in the lake,
but the impact of sugarcane producers is less clear. The 2011 report also found that dairies
and pastures caused more than 37% of net phosphorous imports to the Lake Okeechobee
Watershed (Table 2).17 Meanwhile, sugarcane caused less than 10%.

Requiring agricultural producers to implement Best Management Practices (BMPs) has
proven successful at reducing nutrient runoff from agricultural lands. The 1994 Everglades
Forever Act defines a BMP as:

     a practice or combination of practices determined by the district, in cooperation with the
     department, based on research, field-testing, and expert review, to be the most effective and
     practicable, including economic and technological considerations, on-farm means of
     improving water quality in agricultural discharges to a level that balances water quality
     improvements and agricultural productivity.

The Florida Department of Agriculture and Consumer Services (FDACS) develops specific
BMPs for different agricultural operations, which are outlined in BMP manuals. Typical
components of BMPs include:
     1. Nutrient management practices that optimize fertilizer and manure applications to
        minimize the impact of nutrients on water resources
     2. Irrigation management to reduce water and nutrient runoff to the environment
     3. Water resource protection in the form of buffers, setbacks, and swales to prevent the
        transport of nutrients to nearby water bodies18

Agricultural producers surrounding Lake Okeechobee and in other vulnerable watersheds
are required to either implement BMPs or demonstrate compliance with water quality
standards. Implementation of BMPs has resulted in an annual average of 55% phosphorus

17
     “Lake Okeechobee Protection Plan Update.” South Florida Water Management District, Florida
     Department of Environmental Protection, and Florida Department of Agriculture and Consumer Services.
18
     “Agricultural Best Management Practices.” FreshFromFlorida.com, Florida Department of Agriculture and
     Consumer Safety. Web. https://www.freshfromflorida.com/Agriculture-Industry/Water/Agricultural-Best-
     Management-Practices Accessed 19 Feb. 2020

                                                                                             Vittorio Nastasi
SOLVING FLORIDA’S BLUE-GREEN ALGAE CRISIS: A CONCERTED APPROACH 20
reduction in the EAA since 1996—more than twice the reduction required under the
Everglades Forever Act. According to the South Florida Water Management District, BMPs
resulted in a 70% phosphorus reduction from EAA sources in 2017.19 However,
environmental groups challenge these figures because the District relies on “best-case-
scenario” modeling to estimate phosphorus reductions. Moreover, the BMP program
previously assumed compliance with water quality standards after producers enroll in the
program. The Clean Waterways Act will now require on-site inspections by FDACs every two
years to ensure practices are being implemented correctly. However, adequate water
quality data and monitoring will ultimately be necessary to confirm that BMPs—in addition
to being properly implemented—are achieving sufficient nutrient reductions. As
recommended by the Blue-Green Algae Taskforce, the effectiveness of BMPs must “be
supported by adequate data to justify the presumption of compliance with water quality
standards granted upon enrollment and implementation.”20
Data on the effectiveness of BMPs outside of the EAA is more limited. However, BMPs are
generally regarded to have been less effective north of Lake Okeechobee than in the EAA
because the northern watershed is less heavily engineered than the area to the south. The
more natural topography north of Lake Okeechobee limits the potential benefits of BMPs
alone.21 Consequently, water storage and treatment infrastructure will be necessary
components of any effort to mitigate the effects of fertilizer runoff from the north.
4.2 MUNICIPAL WASTEWATER MANAGEMENT
4.2.1 SEPTIC SYSTEMS AND LEACHING
The U.S. Environmental Protection Agency (EPA) defines septic systems as underground
wastewater treatment structures consisting of septic tanks and drainfields or soil
absorption fields (Figure 8).22 Household wastewater flows into underground tanks where
19
“Everglades Water Quality Program Achieves 70 Percent Phosphorus Reduction.” South Florida Water
Management District. 13 July 2017. Press Release.
20
“Blue-Green Algae Taskforce Consensus Document #1.” Florida Department of Environmental Protection.
FloridaDEP.gov.
21
“Department of Environmental Protection Blue-Green Algae Task Force Part 1.” The Florida Channel. 1
July 19. Video. https://thefloridachannel.org/videos/7-1-19-department-of-environmental-protection-
blue-green-algae-task-force-part-1/
22
“How Your Septic System Works.” EPA.gov, U.S. Environmental Protection Agency. 28 Aug. 2018. Web.
https://www.epa.gov/septic/how-your-septic-system-works Accessed 19 Feb. 2020.
Vittorio Nastasi | Solving Florida’s Blue-Green Algae Crisis: A Concerted ApproachSOLVING FLORIDA’S BLUE-GREEN ALGAE CRISIS: A CONCERTED APPROACH 21
solids separate from lighter material like greases and fats. When systems operate properly,
healthy bacteria break down waste matter before liquid known as “effluent” is discharged.
Soil-based systems discharge effluent through a series of pipes that slowly release liquid
into the surrounding soil. Effluent is filtered as it percolates through the soil before
reaching groundwater. Other types of systems pass effluent through sand, sawdust, and
other materials to neutralize pollutants before it is released into the soil. Septic systems
are generally a safe and responsible means for waste disposal. However, failing systems
and unfavorable topography can cause environmental and health hazards.
FIGURE 8: BASIC COMPONENTS OF SEPTIC SYSTEMS
Source: U.S. Environmental Protection Agency https://www.epa.gov/septic/types-septic-systems
Vittorio NastasiSOLVING FLORIDA’S BLUE-GREEN ALGAE CRISIS: A CONCERTED APPROACH 22
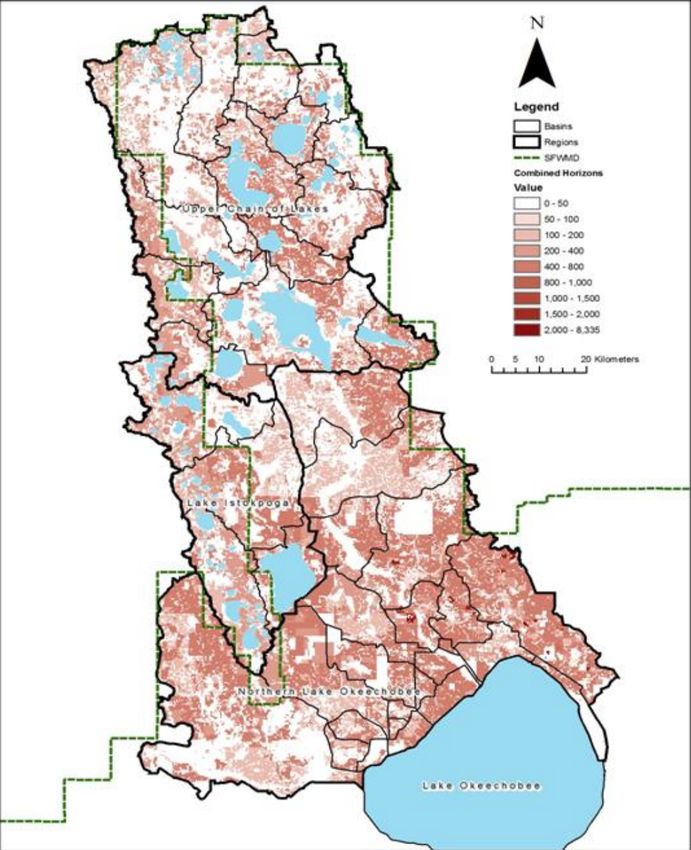
There are an estimated 2.6 million septic systems operating in Florida, accounting for 30%
of Floridians’ wastewater treatment and 12% of septic systems in the United States.23 In
relatively rural, low-density areas with sufficient separation between the drainfield and
groundwater, septic systems are acceptable alternatives to public sewer systems. However,
septic systems can be a major problem in high-density areas, in close proximity to
waterways, or in areas with higher water tables. Under these conditions, seepage from
septic tanks can release substantial amounts of nitrogen and phosphorus into the
groundwater. In fact, septic systems are the second largest source of nitrogen pollution in
Florida waters behind agriculture.24 Nutrient-polluted groundwater can make its way into
lakes, rivers, and estuaries, feeding algal blooms around the state. During heavy rain
events, the water table rises and soils become water-saturated, causing wastewater to flow
to the ground surface where it may run off into surrounding water bodies. Research
suggests that septic systems in residential areas near the St. Lucie Estuary contribute to
blooms.25 Systems north of Lake Okeechobee (Figure 9) contribute to the high nutrient
levels found in the lake that then spread to the coasts following mandatory discharges.
New septic installations in most areas across the state require 24 inches of separation
between the drainfield and water table. Regulations also require setbacks from water bodies,
water pipes, and water wells.26 After installation, however, there are no regular inspections of
conventional septic systems to ensure proper function and compliance with regulations. As a
result, existing systems are generally only inspected at the homeowner’s request or if a
failure is reported. As recommended by the Blue-Green Algae Task Force, a septic system
inspection and monitoring program could be used to more readily identify failing systems.27
23
“Onsite Sewage.” FloridaHealth.gov, Florida Department of Health. 21 June 2018. Web.
http://www.floridahealth.gov/environmental-health/onsite-sewage/index.html Accessed 19 Feb. 2020
24
Lapointe, Brian, Laura Herren, Armelle Paule, Anne Sleeman and Rachel Brewton. “Charlotte County
Water Quality Assessment Phase I: Data Analysis and Recommendations for Long-Term Monitoring.”
Harbor Branch Oceanographic Institute, Florida Atlantic University, 2016. Web.
https://www.charlottecountyfl.gov/dept/utilities/Site%20Documents/Charlotte%20County%20HBOI.FAU.P
haseI.Final%20Report.12.12.2016.pdf Accessed 19 Feb. 2020.
25
Lapointe, Brian E., Laura W. Herren and Armelle L. Paule. “Septic Systems Contribute to Nutrient Pollution and
Harmful Algal Blooms in the St. Lucie Estuary, Southeast Florida, USA.” Harmful Algae 70 (2017). 1-22. Web.
https://www.researchgate.net/publication/320991096_Septic_systems_contribute_to_nutrient_pollution_and_h
armful_algal_blooms_in_the_St_Lucie_Estuary_Southeast_Florida_USA
26
“Standards for Onsite Sewage Treatment and Disposal Systems.” Chapter 64E-6, Florida Administrative Code.
27
“Blue-Green Algae Taskforce Consensus Document #1.” Florida Department of Environmental Protection.
FloridaDEP.gov.
Vittorio Nastasi | Solving Florida’s Blue-Green Algae Crisis: A Concerted ApproachSOLVING FLORIDA’S BLUE-GREEN ALGAE CRISIS: A CONCERTED APPROACH 23
FIGURE 9: SEPTIC TANKS IN THE LAKE OKEECHOBEE WATERSHED
Source: Florida Department of Environmental Protection
https://floridadep.gov/sites/default/files/2c.%20Septic%20Tanks%20LOW.pdf
Vittorio NastasiSOLVING FLORIDA’S BLUE-GREEN ALGAE CRISIS: A CONCERTED APPROACH 24
The 2016 Florida Springs and Aquifer Protection Act requires “advanced” nitrogen-reducing
systems in certain areas of the state.28 However, these requirements are limited to the
watersheds of springs in north Florida and do not apply to areas connected to Lake
Okeechobee or the Caloosahatchee and St. Lucie estuaries. The advanced systems are
intended to reduce nitrogen pollution but require electricity to operate. They are also more
expensive than conventional systems and require more frequent monitoring.
Oversight of septic system installation, repairs, and removal was recently transferred from
the Florida Department of Health (FDOH) to the Department of Environmental Protection
(FDEP). In most cases, systems are only required to be removed if they are (1) failing and (2)
have less than six inches between the drainfield and the water table. If both these
conditions are met, the system must be removed at the property owner’s expense. The DOH
has an ongoing project to track the location of septic systems in Florida, but the data are
not currently complete and are largely based on estimates.
Municipalities have been slow to move existing development off of septic because of
associated financial costs. The Clean Waterways Act created a wastewater grant program
which requires a 50% match of local funds. Funding from the program can be used for
projects to upgrade septic systems or connect systems to central sewer facilities.
Nevertheless, millions of existing septic systems continue to pose environmental risks, and
limited local budgets will slow progress on system upgrades. Some municipalities require
developers to pay for sewage extension to new construction because it is far more
expensive to convert existing development than to extend sewer systems beforehand.
The Clean Waterways Act now requires that municipal governments develop septic system
remediation plans in areas where FDEP determines that septic systems are responsible for
at least 20% percent of nutrient pollution. The plans must include an inventory of septic
systems in the area including systems that need to be replaced or converted, the estimated
costs of improvements, and timelines for implementation. This is a reasonable approach,
but determining the relative contribution of septic systems will require more robust water
quality monitoring than is currently available.
28
“Springs Protection and Basin Management Action Plans (BMAPS).” FloridaHealth.gov, Florida Department
of Health. 11 March 2019. Web. http://www.floridahealth.gov/environmental-health/onsite-
sewage/springs-nreducing-systems.html
Vittorio Nastasi | Solving Florida’s Blue-Green Algae Crisis: A Concerted ApproachSOLVING FLORIDA’S BLUE-GREEN ALGAE CRISIS: A CONCERTED APPROACH 25
4.2.2 PUBLIC WASTEWATER INFRASTRUCTURE FAILURE
Aging public sewer systems also pose a threat when they are not sufficiently maintained or
replaced over time. According to a recent report from GateHouse Media, 1.6 billion gallons
of sewage were spilled in Florida over the past decade, more than 370 million gallons of
which were untreated (Figure 10). Over the same period, a total of 980 million gallons—220
million gallons of which were untreated—entered Florida waterways.29
FIGURE 10: SEWAGE SPILLS (2009-2018)
Source: Salman, Josh et al. “Sewer Crisis in the State of Florida: Aging Infrastructure and Storms Contribute to Massive
Spills.” GateHouse Media http://gatehousenews.com/sewers/
Breaks in sewer lines were the most frequent cause of spills identified in the report. This
can occur when tree roots grow into sewer pipelines. Major storm events—especially along
the coast—can also lead to sewage infrastructure failure. Large inflows of rainwater can
overload systems, causing power outages that prevent pumps from moving sewage through
lines creating backups. Since 2009, nearly one billion gallons of sewage was spilled as a
result of rain and power outages.30 Households can also contribute to spills by improperly
29
Salman, Josh, Jennifer Borresen, Daphne Chen and Dak Le. “Sewer Crisis in the State of Florida.”
USATodayNetwork.com, GateHouse Media. Web. https://stories.usatodaynetwork.com/sewers/
30
Ibid.
Vittorio NastasiSOLVING FLORIDA’S BLUE-GREEN ALGAE CRISIS: A CONCERTED APPROACH 26 disposing of fats and greases through sinks or flushing materials like baby wipes down toilets. These activities can block pipes and force ruptures in sewage lines. Like seepage from septic tanks, sewage spills contribute to nutrient pollution in Lake Okeechobee, leading to algal blooms in the lake and connecting rivers. Spills in coastal communities and near other bodies of water also fuel algae growth along the coast and local waterways. Any effort to tackle blue-green algae in Florida has to address the state’s failing wastewater infrastructure—especially if existing septic systems are converted to traditional sewer systems. Similar to septic systems, the Clean Waterways Act requires municipal governments to develop wastewater treatment plans in areas where wastewater facilities contribute at least 20% of nutrient pollution. The plans must identify necessary expansions and upgrades, estimates of nutrient loads, construction timelines, and cost estimates. Again, more robust water quality monitoring is required to determine the relative contribution of wastewater facilities. Vittorio Nastasi | Solving Florida’s Blue-Green Algae Crisis: A Concerted Approach
SOLVING FLORIDA’S BLUE-GREEN ALGAE CRISIS: A CONCERTED APPROACH                               27

PART 5

 SOUTH FLORIDA
 ECOSYSTEM
 RESTORATION (SFER)
 In addition to feeding algal blooms in the estuaries of the Caloosahatchee and St. Lucie
 rivers, the altered water flows resulting from the Central & South Florida Project have
 reduced water flow to the Everglades region. This has parched large portions of wetlands,
 causing salinity levels to increase and threatening wildlife populations in southern Florida.
 The South Florida Ecosystem Restoration (SFER) Program is a jointly managed effort
 between federal, state, and local governments to establish a more natural flow of water
 through the Everglades and mitigate the impacts of previous interventions. The Integrated
 Delivery Schedule (Figure 11) is a document that provides a sequencing plan for SFER
 projects and is updated regularly by the U.S. Army Corps of Engineers. More than 50
 projects are included in the Integrated Delivery Schedule with timelines that span several
 decades. Most of these projects fall under the Comprehensive Everglades Restoration Plan
 (CERP). Foundation projects are non-CERP projects that are necessary for implementation
 of CERP.

                                                                                  Vittorio Nastasi
SOLVING FLORIDA’S BLUE-GREEN ALGAE CRISIS: A CONCERTED APPROACH 28
FIGURE 11: INTEGRATED DELIVERY SCHEDULE
Project Construction Project
Complete Complete
Modified Water Deliversies to Everglades National Park 2018 2020
Herbert Hoover Dike 2022 2022
Restoration Strategies 2026 2026
Tamiami Trail Next Steps Phase 2 2022 2022
Kissimmee River Restoration Construction 2021 2021
Kissimmee River Restoration Monitoring - 2026
C-111 South Dade Construction 2019 2020
C-111 South Dade PACR 2026 2026
Picayune Strand Restoration - -
Faka Union Pump Station - 2018
Miller Pump Station 2018 2020
Flood Protection Features - Conveyance 2023 2023
Flood Protection Features - Levee 2024 2024
Road Removal 2021 2021
Canal Plugging 2023 2023
Indian River Lagoon-South - -
C-44 Reservoir 2021 2023
C-44 STA & Pump Station 2020 2023
C-23/24 Reservoir North 2028 2028
C-23/24 Reservoir South 2028 2028
C-23/24 STA 2025 2025
C-25 Reservoir 2027 2027
C-25 STA 2029 2029
C-23/C-44 Interconnect 2023 2024
Caloosahatchee River (C-43) West Basin Storage - -
Pump Station and Reservoir 2023 2025
Broward County Water Preserve Areas - -
Mitigation Areas A Berm 2019 2019
C-11 Impoundment 2026 2026
WCA 3A & 3B Seepage Management 2027 2027
C-9 Impoundment Beyond 2030 Beyond 2030
Biscayne Bay Coastal Wetlands Phase 1 - -
L-31 East Flow-way - Federal 2022 2022
Cutler Wetlands 2021 2021
C-111 Spreader Canal Western Project (Requires PPA) 2023 2023
Central Everglades Planning Project (2016 WRDA) - -
Decomp Physical Model - 2021
CEPP South: Additional outlet structures needed to move more water south - -
Validation Report 2019
Remove Old Tamiami Trail 2021 2021
Structure S-631 & gap in L-67C Levee and Structure S-633 with 2022 2024
gap in L-67C
Increase in S-356 Pump Station 2026 2028
Spillway S-355W 2024 2026
Structure S-333N 2020 2021
Structure S-632 2022 2024
Removal L-67C & L-67 Ext, Constr L-67D Levee 2026 2026
Removal L-29 Levee & Backfill L-67 Ext 2027 2027
CEPP North: Inflow facilities needed to restore northern WCA-3A and move - -
additional water south to Everglades
Validation Report 2022
Vittorio Nastasi | Solving Florida’s Blue-Green Algae Crisis: A Concerted ApproachSOLVING FLORIDA’S BLUE-GREEN ALGAE CRISIS: A CONCERTED APPROACH 29
Project Construction Project
Complete Complete
L-4 Degrade & Pump Station S-630 2025 2027
S-8 Pump Station Modifications 2025 2027
Miami Canal Backfill/Tree Islands 2026 2028
L-5 Canal Improvements 2026 2028
L-6 Diversion 2025 2027
CEPP New Water: Moves New Water South, Stores It, and Treats It Before - 2020
Going to the Everglades
Validation Report
Seepage Barrier L-31N 2024 2026
Canal Conveyance Improvements - Miami and North New River 2023 2025
EAA Reservoir - A-2 STA, Inflow-Outflow Canal and Bridge 2022 2024
EAA Reservoir - A-2 STA 2023 2025
EAA Reservoir - Inflow-Outflow Canal, Bridges, Spillway 2023 2025
EAA Reservoir - Inflow Pump Station 2027 2029
EAA Reservoir: Cutoff Wall, Culverts & Embankment 2027 2029
Loxahatchee River Watershed Restoration Project TBD TBD
Lake Okeechobee Watershed Restoration Project TBD TBD
Western Everglades Restoration Project TBD TBD
BBCW Phase 2 TBD TBD
C-111 Spreader Canal Eastern TBD TBD
Lake Okeechobee System Operating Manual - 2023
ASR/Decomp Phase 2 TBD TBD
Non-CERP & Foundation Projects
CERP Generation 1 Projects - Authorized, Project Partnership Agreement (PPA) Executed
CERP Generation 2 Projects - Authorized, PPA Executed Except Where Noted
CEPP - Authorized, Features added in WRDA 2018, PPA in 2020
Planning Phase - Initiated and Proposed
Source: U.S. Army Corps of Engineers https://usace.contentdm.oclc.org/utils/getfile/collection/p16021coll11/id/2641
Authorized by Congress in 2000, CERP is the most substantial project to restore the
Everglades and is widely considered the largest ecosystem restoration plan in the world.31
Collectively, the goal of these projects is to “get the water right”—in other words, to
improve water flows along four dimensions: quality, quantity, timing, and distribution.
While CERP aims to restore the natural hydrological conditions in the Everglades region
within the constraints of extant human development (Figure 12), a more forward-looking
approach will be necessary in light of global climate change and associated sea level rise.
In fact, the most recent Biennial Review of progress toward CERP goals recommended a
rigorous mid-course assessment of CERP implementation to better understand the
potential impacts of sea level rise and the combined impact the projects completed to
date.32
31
“Ecosystem Restoration.” U.S. Army Corps of Engineers. Web.
https://www.saj.usace.army.mil/Missions/Environmental/Ecosystem-Restoration/
32
National Academies of Sciences, Engineering, and Medicine. “Progress Toward Restoring the Everglades:
The Seventh Biennial Review - 2018.”
Vittorio NastasiSOLVING FLORIDA’S BLUE-GREEN ALGAE CRISIS: A CONCERTED APPROACH 30
FIGURE 12: PAST, CURRENT, AND FUTURE WATER FLOWS THROUGH THE EVERGLADES
Past Flow Current Flow Future Flow
Source: U.S. Army Corps of Engineers
https://usace.contentdm.oclc.org/utils/getfile/collection/p16021coll11/id/4195
While most of the foundation projects are nearing completion, political factors have
delayed implementation of CERP resulting in extended timelines and increased costs. Most
glaringly, the federal government is more than $1 billion behind the state in fulfilling its
funding obligations despite an equal funding agreement (Figure 13). Several key CERP
projects are described in the remainder of this section and displayed in Figure 14.
FIGURE 13: TOTAL STATE VS. FEDERAL CERP SPENDING (OCT 1, 2000– JUN 30, 2018)
State/SFWMD
Federal
$0.0 $0.5 $1.0 $1.5 $2.0 $2.5
Actual Spending $Billions
Source: South Florida Water Management District
https://www.sfwmd.gov/our-work/cerp-project-planning/cerp-implementation
Vittorio Nastasi | Solving Florida’s Blue-Green Algae Crisis: A Concerted ApproachSOLVING FLORIDA’S BLUE-GREEN ALGAE CRISIS: A CONCERTED APPROACH 31
FIGURE 14: OVERVIEW OF SFER PROJECTS
5.1 KEY TERMS AND TOOLS FOR WATER MANAGEMENT
5.1.1 RESERVOIRS AND AQUIFER STORAGE AND RECOVERY (ASR) WELLS
Reducing harmful discharges to the Caloosahatchee and St. Lucie estuaries demands
additional water storage. A 2015 report from the University of Florida Water Institute
indicated a need for additional storage capacities of 400,000 acre-feet in the
Caloosahatchee River Watershed, 200,000 acre-feet in the St. Lucie Watershed, and
Vittorio NastasiYou can also read