Single Photon Lidar Gas Imagers for Practical and Widespread Continuous Methane Monitoring
←
→
Page content transcription
If your browser does not render page correctly, please read the page content below

Single Photon Lidar Gas Imagers for Practical
and Widespread Continuous Methane
Monitoring
James Titchener*, Doug Millington-Smith, Chris Goldsack, George Harrison, Alexander
Dunning, Xiao Ai*, Murray Reed
QLM Technology Ltd, Unit DX, Albert Rd, Bristol BS2 0XJ, United Kingdom

*Corresponding authors: james.titchener@qlmtec.com; xiao.ai@qlmtec.com

Highlights

 A novel gas imager using Single-Photon Lidar with Tunable Diode Laser Spectroscopy

 Imaging of methane leaks as low as 0.012 g/s and at ranges of up to 90 m.

 A robust, low-cost, and autonomous gas imager for continuous methane monitoring.

Abstract
The accurate and comprehensive identification and quantification of greenhouse gas (GHG) emissions
is an essential part of the management and mitigation of climate change. We are developing a novel
remote gas imaging sensor for the detection, visualisation, and quantification of methane emissions.
The sensor uses a new technique we call Tunable Diode Lidar (TDLidar) which combines aspects of
Tunable Diode Laser Absorption Spectroscopy (TDLAS) with Differential Absorption Lidar (DIAL) and
Time Correlated Single Photon Counting (TCSPC) to enable remote spectroscopy and ranging with low
power semiconductor diode lasers. Our first TDLidar methane sensors use diode lasers with
wavelengths around the CH4 absorption line at 1650.9 nm and Peltier-cooled Single Photon Avalanche
Diode (SPAD) detectors in a Random Modulation Continuous Wave (RM-CW) Lidar system. Here we
characterise our TDLidar methane sensor performance with calibrated gas cells and controlled gas
release trials and we demonstrate quantification of leak rates as low as 0.012 g/s and detection at
distances over 90 m. The accuracy, speed, and practicality of the sensor, combined with an
expectation of low-cost in volume, offers the potential that these sensors can be effectively applied
for widespread continuous and autonomous monitoring of industrial methane emissions.

 Date: 01/02/2021
 QLM Technology Ltd
 Unit DX, Albert Road, St Philips, Bristol BS2 0XJ, UK Page | 1
 Company ID: 10673098 VAT No: 310069547
1 Introduction
Methane (CH4), the main component of natural gas, is the second largest source of climate change
and has a 20-year global warming potential of 84 times that of carbon dioxide (CO2) [1][2]. Because
CH4 has a short lifetime in the atmosphere [3], reduction in CH4 emissions can have a rapid effect on
climate forcing. Thus, reducing CH4 emissions has been identified as a key goal for reducing global
warming [4].

Almost one third of anthropogenic CH4 emissions are from the oil and gas sector [5][6][7]. There are
over 500,000 active gas well pads in the U.S.A alone, and many industrial sites. Measurement
campaigns have shown that many sites are leaking much more than expected. For example up to 3.7
% of CH4 gas extracted from the Permian basin is emitted into the atmosphere, which is over 60 %
more than initial emissions studies predicted [8].

The energy industry has made major commitments towards effective CH4 emissions monitoring and
reduction in compliance with, and often ahead of, expanding government regulations. Significant
effort is being made to develop affordable and practical ways of implementing leak detection and
repair (LDAR) operations across the industry. CH4 emissions in the oil and gas industry follow a highly
skewed distribution, where a small number of sites contribute the vast majority of emissions. For
example in one study 30% of gathering sites have been found to contribute 80% of the total emissions
[9]. Identifying and repairing these high emitting sites through LDAR programs is of high importance
[10]. Effective LDAR therefore requires finding this small set of large emitters where and when they
occur. This naturally necessitates the use of continuous monitoring systems across the entire industry,
rather than periodic inspections every few months.

Significant effort has been applied to the development of a range of technologies and systems for
monitoring CH4 emissions on a continuous basis [11]. However, meeting the requirements for
deployment at scale in an industry driven by cost reduction and practicality is a significant challenge.
This challenge is being actively addressed by a large range of research groups and companies.

QLM Technology Ltd. are developing a new Lidar based technology for CH4 monitoring. The technology
is called Tunable Diode Lidar (TDLidar) and is enabled by advances in IR single photon detectors
combined with novel signal processing algorithms. The technology has been specifically optimised to
provide continuous and widespread monitoring of CH4 emissions at a price and level of practicality
suitable for mass deployment in the oil and gas industry. We are working with industry leaders,
including BP, National Grid and AMETEK Land, to validate and industrialise our designs as cost-
effective scalable systems for continuous and fully autonomous leak detection and quantification.

The purpose of this paper is to describe our novel optical gas imaging technology and investigate its
application for use in continuous CH4 emission monitoring. We will first briefly explain some of the
requirements for the deployment of such technologies in the oil and gas industry, and give an overview
of other relevant remote gas imaging technologies. We will then give a technical overview of the basic
principles behind the operation of the TDLidar gas imager, and present measured performance
specifications of the sensor in laboratory conditions. Finally, we present results of testing the sensor
in field trials with controlled CH4 emissions that were carried out with the National Physical Laboratory
(NPL) Emissions and Atmospheric Metrology Group, and briefly preview preliminary results from a

 Date: 01/02/2021
 QLM Technology Ltd
 Unit DX, Albert Road, St Philips, Bristol BS2 0XJ, UK Page | 2
 Company ID: 10673098 VAT No: 310069547
measurement campaign at Total SE’s TADI (Transverse Anomaly Detection Infrastructure) platform
carried out in October 2020.

2 Review and comparison of existing technologies
Traditional leak detection methods involve handheld “sniffers”; samplers that detect a leak at short
range, requiring them to be passed over every square foot of a facility. This is both time consuming
and labour intensive, and therefore expensive and inefficient. Furthermore, the intermittent nature
of the survey only provides a snapshot in time; leaks that begin after the survey are not picked up until
the next survey.

Leak detection methods have progressed in the last ten years to using optical gas imaging (OGI);
infrared cameras that can see leaks from a distance without having to be right on top of them [12].
However, these cameras are expensive, require trained operators to interpret the results, and when
a leak is identified often struggle to quantify how much gas is leaking. After visualising a leak with an
OGI camera it typically needs to be re-surveyed with a sniffer to measure its size. With this as the best
practice, regulations have been set up so that operators are only required to do one or two inspections
a year and only on certain types of installation.

The majority of total reported emissions are due to what are called super emitters, large leaks that,
due to the intermittent nature of LDAR surveys, may not be detected for months at a time. The
industry has recognized it has a significant problem, so is looking for much more practical ways to
effectively implement continuous autonomous monitoring. The U.S. ARPA‐E‐MONITOR program
stated the goal to “detect and measure methane leaks as small as 1 ton per year from a site 10m x
10m in area with a certainty that would allow 90% reduction in methane loss for an annual site cost of
$3,000” [13]. The emission rate target of 1 ton per year equates to about 0.03g/s or 6scfh. The
requirement to reduce emissions by 90% implies some form of continuous (or at least very regular)
monitoring will be required industry wide, since the distribution of leaks is characterized by a small
number of large leaks [3]. The annual cost requirement of $3,000 precludes many technologies.
Particularly it would very likely preclude any technology requiring a human operator for regular site
surveys due to the cost of the labour, so the need for continuous and automated monitoring is evident.
Cost requirements of $3,000 per year would further seem to preclude technologies with industrial
equipment amortisation periods less than ten years that cost more than $20,000. These criteria are a
significant barrier to existing offerings.

Overall, it has been observed that there is a clear lack of available technology to locate leaks
autonomously with the accuracy needed for a repair crew to find the leak, and beyond that there is
an even greater technological and systems challenge to quantify the leak rate and determine the
priority for repair. For comprehensive overviews of the different CH4 detection and quantification
technologies and systems see [11][14]. Here, the advantages and disadvantages of various relevant
technologies will be briefly discussed, with a focus on comparing with TDLidar gas imaging technology
presented in this work. As such, we will mainly focus on comparisons to other long range gas imaging
technologies (OGI and hyperspectral gas cloud imaging (GCI)), neglecting point sensor-based network
systems and linear fence-line monitoring systems.

 Date: 01/02/2021
 QLM Technology Ltd
 Unit DX, Albert Road, St Philips, Bristol BS2 0XJ, UK Page | 3
 Company ID: 10673098 VAT No: 310069547
2.1 Optical Gas Imaging (OGI)
The current standard to locate leaks is to use a handheld optical gas imaging (OGI) camera operating
in the mid-wave (3-5 µm) to long-wave infrared (7-14 µm) [15]. These IR cameras can infer the
presence of gas by detecting changes in light intensity due to absorption of the gas at infrared
wavelengths. They can utilise spectral filters in and out of the imaging path to provide indication of
the relative gas concentration [16]. OGI cameras employ a high frame rate (typically comparable to
full-motion video), which can further assist localization and help inform on wind conditions.

In ideal conditions the technique is effective, but a number of difficulties prevent OGIs use for
widespread continuous monitoring. The mid-infrared sensors will typically employ an expensive cooler
to keep the sensor at the required temperature for low noise operation. Furthermore, a human
operator can be required to operate the camera as OGI cameras have a relatively limited range (tens
of meters) for small leaks and poor selectivity between species [15]. The technique is also dependent
on the thermal background of the environment, which can affect the signal to noise ratio and require
careful interpretation from skilled operators [14]. Although machine algorithms are being developed
for this task [17], quantification remains unreliable.

2.2 Hyperspectral Gas Cloud Imaging (GCI)
A more sophisticated use of infrared sensor arrays is hyperspectral imaging, where light from the
environment is spatially separated by wavelength before detection on the sensor array. For the
detection of gases hyperspectral imaging is known as hyperspectral Gas Cloud Imaging (GCI) [18]. GCI
measures multiple wavelengths of infra-red light per pixel to visualise leaks of target gas species from
equipment [19][20]. By sampling a wider range and density of spectra, the technique can be more
selective between species, while keeping the high frame rate live video advantages of OGI. However,
since the technique is based on passive environmental illumination there is still interference from the
thermal background of the scene. Furthermore, the technology is based on long-wave infrared sensor
arrays which are less developed for robust long-term deployment compared to standard
telecommunications components in the near-IR. Finally, this there is a difficult trade-off between
either using expensive cooling systems to cool the long-wave IR sensor, or tolerating higher noise
operation.

2.3 Solar Occultation Flux (SOF)
SOF is an open-path spectroscopy technique making use of sunlight as a light source, collecting real-
time infrared spectra of sunlight from a moving vehicle, and monitoring changes in the spectrum as
the sunlight is occluded by emissions of the target species. This dynamic spectrum information is then
combined with measurements of wind speed to calculate the overall flux through an area [21]. This
technique is versatile in that it can detect a wide range of gas species but retains the high labour-
intensity and snapshot-in-time limitations of survey measurements, and suffers from poor localisation
of emission if the source is not known, limiting its effectiveness for leak detection and repair
operations.

2.4 Tunable Diode Laser Absorption Spectroscopy (TDLAS)
In contrast to techniques like OGI and GCI that rely on passive illumination from the environment for
gas sensing, active techniques illuminate the environment with narrow linewidth laser light. This has

 Date: 01/02/2021
 QLM Technology Ltd
 Unit DX, Albert Road, St Philips, Bristol BS2 0XJ, UK Page | 4
 Company ID: 10673098 VAT No: 310069547
the advantage of precisely targeting specific gas absorption line wavelengths to avoid interference
from other gas species, and so allows measurement of gas concentration with high accuracy. In
addition, the use of active illumination eliminates interference due to background optical (or thermal)
effects since the active signal can be modulated in time and space to be clearly distinguishable from
any background light.

Laser absorption spectroscopy has been a laboratory technique for many years and is now used
industrially with an open laser beam path, and the atmosphere taking the place of the measurement
cell [22]. Most greenhouse gases have narrow wavelength absorption lines in the short-wave infrared
spectral region (around 1550 nm in wavelength) employed in the fibre optic telecommunications
industry. CH4, for example, has good absorption at 1651 nm, and CO2 has many absorption lines in the
telecom region, with 1572 nm being particularly strong. These lines are widely used in Tunable Diode
Laser Absorption Spectroscopy (TDLAS) equipment, employing semiconductor diode lasers that are
rapidly modulated to tune in wavelength across a target gas absorption line to measure the exact
concentration of a particular gas in the laser path [23][24].

In TDLAS, the laser is typically pointed at a fixed location creating a line sensor which will detect any
gas crossing the beam. Often in this configuration a co-located retroreflector is used to reflect the
beam directly back to the sensor with high intensity. This can extend the operable range to hundreds
of meters. This offers very effective analysis of concentration, but considerable processing,
approximation and interpretation based on the environmental conditions is required to infer gas
emission location and rate. A more recent form of TDLAS is based on detecting diffusive scattering of
the laser off non-cooperative targets in the environment. This approach has the possibility of forming
images of gas plumes by scanning the laser beam rapidly around the environment [25]. However, the
imaging standoff range for is typically very limited in this configuration due to the parametric fall in
return light intensity with distance. As we will show this range limitation is overcome in TDLidar using
a highly sensitive single photon avalanche detector.

2.5 Differential Absorption Lidar (DIAL)
Another active illumination technique is Differential absorption Lidar (DIAL) [26]. This involves
collecting the backscatter from very powerful laser beams reflecting off aerosol and other particulate
matter in the atmosphere, and comparing with laboratory spectra to identify the concentration and
spatial distribution of a range of polluting gaseous species over long distances [27][28][29]. This
technique offers high-fidelity quantification and localisation, but is large, has a high capital cost, and
is non-portable; the DIAL equipment used by NPL, for example, is contained in the trailer of an
articulated truck, and requires expert operation and interpretation, presenting a range of logistical
challenges to usage in regular surveys [30]. DIAL is a highly effective scientific instrument for large
scale total site surveys, but due to its significant cost and size it isn’t a viable option for continuous
surveillance of individual emissions.

2.6 Mobile Sensors
In recent times, there has been considerable interest in increasing the portability of both point sensors
and more advanced techniques, leading to the mounting of OGI and GCI cameras, and extractive or
short-path TDLAS sensors [31][32], on manned and unmanned vehicles (including UAVs). The efficacy
of the techniques can be improved by allowing them to be positioned and repositioned as necessary,
 Date: 01/02/2021
 QLM Technology Ltd
 Unit DX, Albert Road, St Philips, Bristol BS2 0XJ, UK Page | 5
 Company ID: 10673098 VAT No: 310069547

and to access up-close locations that cannot be reached by an operator on foot. However, it does not
entirely bypass the labour-intensiveness, cooling requirements or interpretation challenges of OGI and
GCI, nor the localisation challenges associated with TDLAS, and does not offer a total solution in and
of itself.

3 TDLidar technology description
We have developed a novel remote gas imaging sensor for application to the detection of gas
emissions that builds on some of the key advantages of previously described technologies while
avoiding their limitations. The new sensor uses a technique we call Tunable Diode Lidar (TDLidar) and
combines aspects of Tunable Diode Laser Absorption Spectroscopy (TDLAS) with Differential
Absorption Lidar (DIAL) and Time Correlated Single Photon Counting (TCSPC) to enable remote
spectroscopy and ranging with low power semiconductor diode lasers. Our first TDLidar CH4 sensors
use diode lasers with wavelengths around the CH4 absorption line at 1650.9 nm and Peltier-cooled
Single Photon Avalanche Diode (SPAD) detectors in a Random Modulation Continuous Wave (RM-CW)
Lidar system. This allows long range accurate imaging of gas similar to that obtained by DIAL, but in a
much smaller, easily portable form factor. TDLidar therefore offers a simple, robust, precise
visualisation and quantification of gas emissions on a continuous basis, from a compact, relatively low-
cost platform.

Like TDLAS, TDLidar directly measures the shape of a gas absorption line by continuously sweeping of
the output wavelength of a diode laser across the line. However, similar to DIAL systems, TDLidar uses
a pulsed laser output to encode the light signal and a digital time-domain correlation algorithm
between the transmitted and detected light in order to identify the returned light. By simultaneously
tuning the laser wavelength and modulating the amplitude it is possible to simultaneously and
accurately determine both the range the laser light has travelled, as with typical Lidar, and the amount
of a particular gas that the laser light has passed through, as with typical TDLAS.

A fundamental aspect of TDLidar is the use of the high-speed laser tuning, modulation, and detection
possible with semiconductor components. This allows the laser wavelength to be scanned at rates of
1 MHz or faster and allows the rapid acquisition of images of both gas spectra and structural distance
data over extended fields of view. These high-quality and non-ambiguous three-dimensional images
of both the gas and the physical environment it occupies enable the analysis of gas plumes to
determine not just the location of the gas, but also assist the calculation of the leak rate that industrial
users need.

3.1 Single Photon Avalanche Diode (SPAD) detectors
A major differentiator of the TDLidar CH4 sensor we have developed is the use of a Short-Wave Infra-
Red (SWIR) indium gallium arsenide Single Photon Avalanche Diode (SPAD) detector. These SWIR
SPADs are sensitive to single photons of light in the 1.0-1.7 µm wavelength range, where many
greenhouse gases absorb radiation (Figure 1), and in particular at the 1.65 µm wavelength where
CH4 has a strong absorption line free of common interferences. In addition, these devices operate
with low background noise even at temperatures close to room temperature, which is important for
practical use. They also have very high-speed recovery and time resolution, which is important for
building up images quickly for analysis. The very high sensitivity of the detector provides the sensor

 Date: 01/02/2021
 QLM Technology Ltd
 Unit DX, Albert Road, St Philips, Bristol BS2 0XJ, UK Page | 6
 Company ID: 10673098 VAT No: 310069547
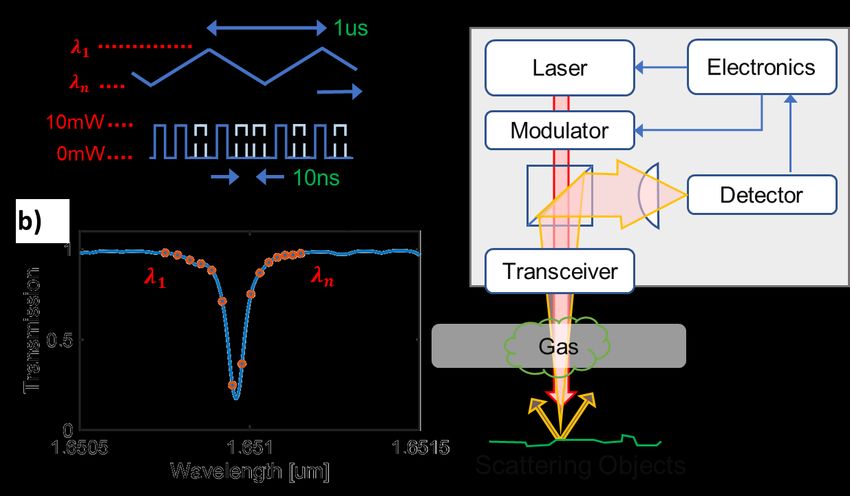
with a long operational range, we have measured gas at more than 100m distance, while using low
power laser components and relatively small light collection optics.

Figure 1: Spectral response of a SWIR SPAD (Short-Wave InfraRed indium gallium arsenide Single Photon Avalanche Detector)
indicating the location of the CH4 absorption line at 1651 nm.

3.2 Photonics and signal processing
The combined gas spectroscopy and Lidar of the TDLidar sensor is depicted schematically in Figure 2.
As shown in Figure 2a we apply both continuous wavelength tuning and pseudo-random amplitude
modulation to the laser light [33]. A similar amplitude modulation approach was applied in
conjunction with a single photon detector and two independent laser wavelengths previously for the
detection of CO2 [34]. The narrow line-width diode laser is continuously tuned back and forth across
the gas absorption line at a rate of approximately 1 MHz (i.e. 1µs period), and then the light is
independently amplitude modulated on and off with a pulse duration of around 10 ns per bit. The
amplitude modulation and subsequent convolution of the return signal with the output allows the
system to independently measure both the wavelength and the time of flight of the return signal. We
can therefore produce a spectrum of the CH4 1650.95 nm absorption line with multiple wavelengths
as shown by the dots in Figure 2b. For high-speed imaging a signal integration time of 10 ms, is used
to accumulate enough data to accurately measure the absorption curve and gas concentration. This
gives the sensor a base data acquisition rate of 100 CH4 measurements per second (i.e. 100Hz). We
will expand on this point in Figure 5 later in the paper.

 Date: 01/02/2021
 QLM Technology Ltd
 Unit DX, Albert Road, St Philips, Bristol BS2 0XJ, UK Page | 7
 Company ID: 10673098 VAT No: 310069547
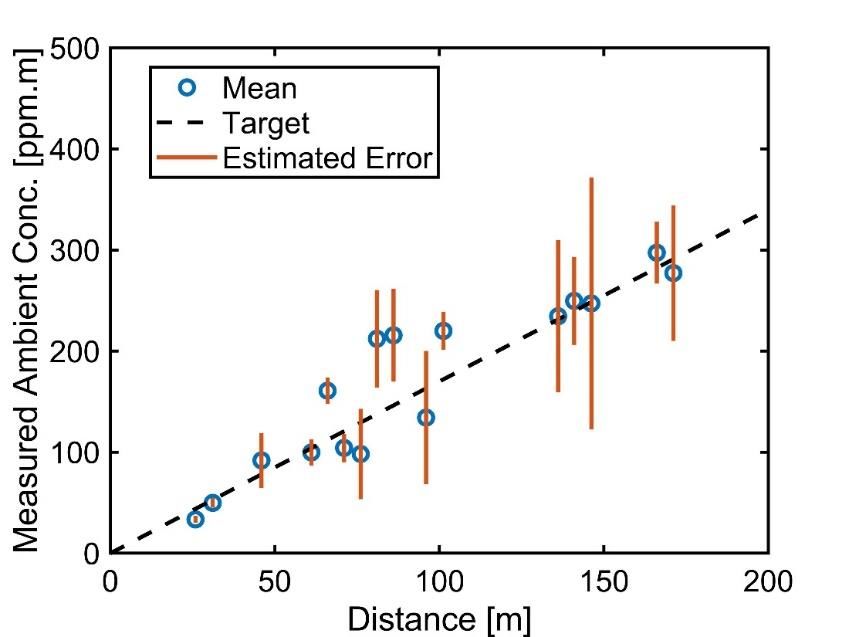
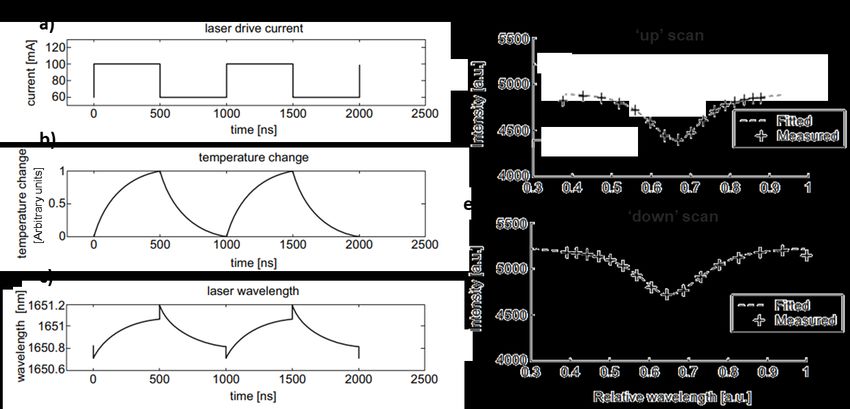
Figure 2: Tunable Diode Lidar (TDLidar) principle of operation. a) Continuous wavelength tuning combined with pseudo
random amplitude modulation. b) CH4 absorption spectrum measurement at multiple wavelengths. c) Schematic of the
TDLidar system.

3.3 Optical layout and components
The optical layout of the key components in the TDLidar transceiver system is shown in Figure 2c. The
laser light source is a commercially available multi-quantum well Distributed Feedback Laser (DFB)
with an eye-safe 10mW of output power. The DFB laser is driven by a periodically varying current with
around a 1 MHz period that scans the output wavelength across the CH4 absorption line. We apply the
required amplitude modulation to the DFB laser output by passing in through a commercially available
optical modulator. A key principle of the optical design is the use of a single co-axial optical transmit
and receive axis, coupled via a polarising beam splitter. This maintains the transmit and receive path
alignment over long ranges, while polarisation purity of the output and the polarisation selection of
the beam splitter protects the sensitive SPAD from short range reflected return laser light. Finally, we
use a mechanically rotated Risley prism pair [35] (not shown) to rapidly scan the transmitted beam
across the scene and build up an image. After diffusive scattering off objects in the environment a tiny
fraction of the scattered light (~1/108) returns to the transceiver. At the polarising beam splitter 50 %
of the returning light is directed towards the SPAD where it is detected. Typical return light levels are
in the range of tens to hundreds of picowatts. The design has high alignment robustness and so can
be produced very cost effectively at large volumes.

3.4 DFB laser tuning
The DFB laser is modulated in wavelength back and forth across a CH4 absorption line at 1650.9 nm.
This is achieved using a square wave laser drive current with period 1 µs as shown in Figure 3a. Both
the high and the low current states are above the lasing threshold for the laser, and the equilibrium
temperature and output wavelengths differ for the high and low input currents. Thus, the temperature
of the laser gain medium oscillates between the two steady state temperatures with 1 µs period, and

 Date: 01/02/2021
 QLM Technology Ltd
 Unit DX, Albert Road, St Philips, Bristol BS2 0XJ, UK Page | 8
 Company ID: 10673098 VAT No: 310069547
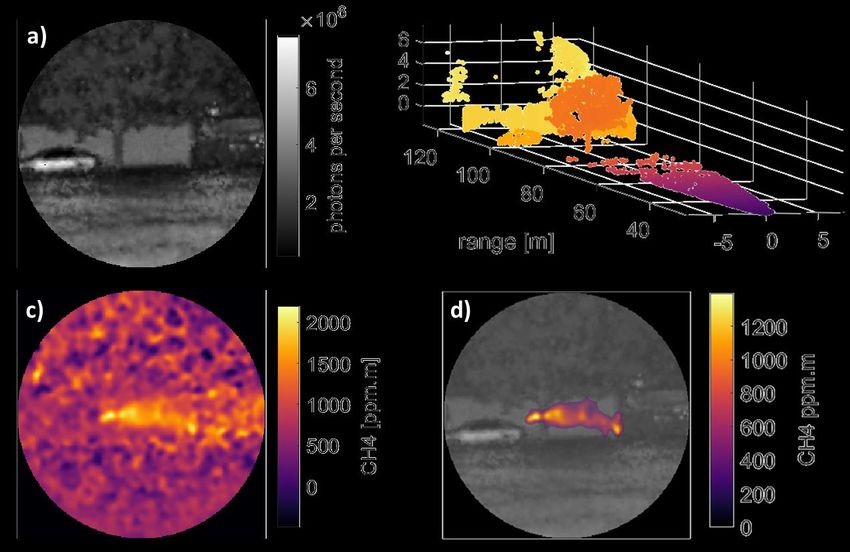
similarly the laser wavelength is continuously tuned between two different wavelengths limits as
shown in Figure 3b-c. The laser output wavelength is affected instantaneously by both the number of
free carriers in the gain medium and the temperature of the gain medium. This explains why the DFB
wavelength jumps when the injection current is changed, and thereafter smoothly tunes due to the
slower temperature changes between the two equilibrium states [36]. This smooth continuous tuning
across the CH4 line is used for spectroscopy in the TDLidar system.

An example of the measured spectrum using this scheme is shown in Figure 3d-e. Here the ‘+’ points
represent wavelengths that are measured by the sensor while the dashed line is a curve fitted to those
data points applying the Beer-Lambert law and assuming a Lorentzian absorption cross section. The
density of measured spectral points is higher on the right-hand side of Figure 3d since the laser is
scanning up in wavelength, and the scanning rate slows as the laser gain medium approaches thermal
equilibrium (and vice-versa for the down scan in Figure 3e).

 Figure 3: Tunable Diode Laser tuning. a) Laser current modulation at 1 MHz. b) Temperature change of laser induced by
current modulation. c) Laser output wavelength induced by combined current changes and temperature changes. d)-e) CH4
 absorption spectrum for the ‘up’ and ‘down’ wavelength scans. Note that a)-e) are all analytically generated illustrations,
 not experimental data

3.5 TDLidar data visualisation
TDLidar uses the relative depth of the measured absorption curve to determine the gas concentration
path length product, typically expressed in parts per million times meters (ppm.m). The sensor
accumulates data points at a rate of 100 Hz while the beam is rapidly scanned around the
environment. After accumulating several thousands of points the data can be visualized in two- and
three-dimensional images. The data is complex, containing signal intensity, Lidar range and spectral
information. Because of this there are a number of different ways to visualise it.

Figure 4 describes the typical formats for visualising TDLidar data. Firstly, like a normal visual camera,
the basic intensity level of the returned signal can be imaged spatially, as shown in Figure 4a. Here we
can see a tree, a car and a wall at a range of around 100 m. White areas are high signal and dark areas
are low signal. Acceptable signal levels for accurate CH4 measurement can be as low as 0.7 x 10⁶
 Date: 01/02/2021
 QLM Technology Ltd
 Unit DX, Albert Road, St Philips, Bristol BS2 0XJ, UK Page | 9
 Company ID: 10673098 VAT No: 310069547
photons per second. Next, a typical Lidar distance point cloud is generated. The same data set is
plotted in Figure 4b showing the ranges of the various objects in the scene both in a three-dimensional
plot and by colour. The CH4 concentration path length image for the same data set is shown in Figure
4c. There is a background CH4 level of around 600 ppm.m, largely due to the use of a small internal
sealed gas cell inside the sensor to provide robust calibration, as well as the presence of an ambient
CH4 gas level in the atmosphere. The noise level in the CH4 image is fairly high due to the long range
from which the signal is returning (100-120 m). Finally, in Figure 4d the CH4 plume is isolated by
subtraction of the background due to the internal gas cell and ambient gas in the atmosphere,
followed by applying a plume detection algorithm that simply identifies and separates out large
connected regions of elevated CH4. The plume image is overlaid on the original signal level image from
Figure 4a. This is the standard image used to identify both the location and size of the plume for the
remainder of this publication. It is of interest to note that all images appearing in the form of similar
to Figure 4d are generated automatically by the plume detection algorithm rather than by manually
identifying the plume.

Figure 4: TDLidar imaging data examples. a) sensor signal level image. b) Lidar point cloud (colour indicates distance from
sensor). c) CH4 concentration path length (ppm.m) image and d) CH4 concentration path length plume extracted from c) with
a background level change, and overlaid on the signal level image a).

3.6 Leak rate estimation
Estimation of leak flow rate is of considerable interest to the overall quantification method:
Understanding the leak rate of individual sources informs prioritisation of a repair schedule,
facilitating the greatest reductions in emission in the short term. Once a CH4 plume is identified the
TDLidar sensor currently uses a simple mass balance approach to calculate the gas flow rate [37],
although there is significant scope for more sophisticated algorithms to be applied. The mass balance
approach aims to determine the flow rate by calculating the mass of gas flowing through a three-
dimensional surface enclosing a gas source. The mass flux is defined as the mass of gas passing through
a surface per unit area per unit time. By integrating the mass flux through a set of planes enclosing a
 Date: 01/02/2021
 QLM Technology Ltd
 Unit DX, Albert Road, St Philips, Bristol BS2 0XJ, UK Page | 10
 Company ID: 10673098 VAT No: 310069547
volume the total flux of gas entering or leaving that volume can be found. If the net flux is non-zero
this indicated that the region is emitting gas. The mass flux through a plane is defined as

 Φ= ∙

where is the gas concentration (g/m3), is the wind velocity vector, and is the area vector of the
plane. For the case of TDLidar the beam measures a concentration path length rather than the point
density of CH4. The equation is adapted to set one dimension of the plane to be the laser beam
vector times the concentration path length ( ), and the other edge to be a vector length
perpendicular to the laser beam. Then = × where the vector is the side of the plane
perpendicular to the laser and is the vector of the laser beam concentration path length (units of
g/m2). This vectorisation allows the mass balance algorithm to be applied to the images data produced
by the TDLidar sensor in a similar manner similarly to many previous works [37][38].

4 Results
4.1 Sensor metrological validation
Validation of the sensor under laboratory conditions was undertaken using calibrated CH4 gas cells to
create a range of different concentration path lengths. The measurements evaluated both the
precision and accuracy of the CH4 measurements produced by the sensor. The precision was analysed
with respect to varied measurement averaging time and concentration path length values. The
accuracy measurements used a long measurement time (10 s) to reach a high level of precision, then
checked the discrepancy between the sensor reading and the true CH4 concentration path length.

The precision of the TDLidar sensor was estimated by calculating the standard deviation of the
measurement reading over time, for a fixed target. We tested the precision of the sensor by disabling
the scanner system and directing the beam at a fixed diffusive target 5m from the sensor. The laser
beam was attenuated significantly to ensure a return signal of 2 mega-counts of photons detected per
second (Mcps). This signal level corresponds to typical long range signal return levels for the sensor
operating up to 200 m (depending on surface scattering coefficient). Different concentration path
lengths of CH4 were achieved by placing various combinations of calibrated CH4 gas cells in the external
beam path of the sensor. This allowed the sensor precision to be tested for concentration path lengths
from 500 ppm.m to 9250 ppm.m.

The results of the precision testing are shown in Figure 5. The y-axis shows the standard deviation of
the sensor CH4 concentration path length measurements, while the x-axis shows the amount of
averaging used on raw the 0.01 s data points to obtain the measurements. For example, an averaging
time of 1 s means that 100 of the raw 0.01 s CH4 readings were averaged together to produce one
higher precision CH4 measurement. The standard deviation of a large set of these 1 s averaged
measurement is then calculated to find the sensor precision for 1 s averaging time.

As expected, precision improved with averaging time ( ). The precision follows the maximal
1/√ scaling until around 1 s averaging time. For longer averaging times low frequency noise sources
begin to affect the precision. We believe this low frequency noise is due to fluctuations in the laser
wavelength tuning. This effect is more pronounced for the higher ppm.m measurements due to the
inverse exponential relationship between gas concentration path length and transmission amplitude
 Date: 01/02/2021
 QLM Technology Ltd
 Unit DX, Albert Road, St Philips, Bristol BS2 0XJ, UK Page | 11
 Company ID: 10673098 VAT No: 310069547
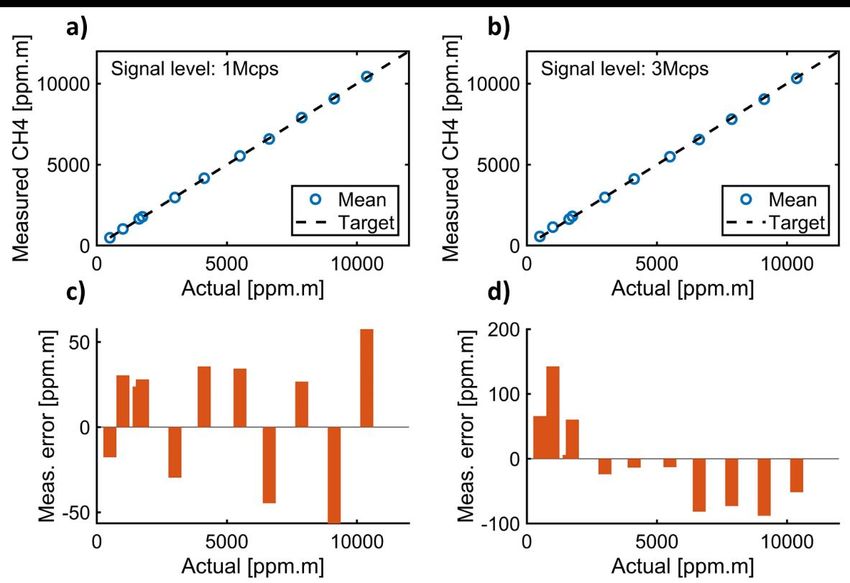
(described by the Beer-Lambert law). In other words, the same sized fluctuation in laser amplitude
causes a larger absolute change in ppm.m if the ppm.m level is higher.

Figure 5: Measurement standard deviation for varied measurement averaging time (x-axis) and different amounts of CH4 (line
colour). The inverse square root slope indicates random noise being reduced by increased averaging time.

Further testing was carried out to test the accuracy of the sensor to known CH4 concentration path
lengths. Accuracy was tested in two configurations.

Firstly, the sensor accuracy was tested in a lab setting with a scattering target at 5 m range and a
selection of different combinations of calibrated CH4 gas cells (Figure 6). In this case the sensor laser
beam was attenuated to two different levels (1 Mcps and 3 Mcps) per concentration path length value
to emulate high signal return levels and low signal levels. The measured and actual values of the cells
for signal levels of 1 Mcps and 3 Mcps are shown in Figure 6a and Figure 6b respectively. The
measurement averaging time used for these measurements was 10 s. The resulting CH4 readings very
closely match the true cell ppm.m values, as shown by the close agreement of the data points to the
expected ppm.m line in Figure 6a-b. This verifies that the CH4 ppm.m reading is not influenced
significantly by the signal level.

The error between the measured and actual ppm.m values of the cells is shown in Figure 6c and
Figure 6d for the 1 Mcps and 3 Mcps signal levels respectively. The error is defined as the difference
between the true and measured concentration path lengths. The results show there is a certain
amount of systematic error, although it is typically less than 100ppm.m. This level of accuracy is
quite good, even relative to the CH4 concentration path length values typically produced by small
leaks of 0.012g/s (see Figure 8c later). These systematic errors are likely caused by non-uniformity of
the laser spectrum. A slight bend in the output spectrum caused by internal photonic effects can
increase or decrease the apparent size of the CH4 absorption line shape. However, as shown the
resulting error from this effect is minimal for concentration path length accuracy required for
emissions detection. It is also worth noting there is a small amount of uncertainty about the exact
beam path length through the cell, which will also contribute to the systematic error.

 Date: 01/02/2021
 QLM Technology Ltd
 Unit DX, Albert Road, St Philips, Bristol BS2 0XJ, UK Page | 12
 Company ID: 10673098 VAT No: 310069547
Figure 6: CH4 measurement accuracy. a)-b) Measurement of CH4 concentration pathlength (ppm.m) with calibrated gas cells.
Sensor readings compare accurately with the known calibrated gas cell values. c) and d) show the corresponding error
between the measured ppm.m values and the actual calibrated cell ppm.m values.

Further testing was carried out with the scanner now operating to scan the beam around the
environment outdoors. This allows the sensor to acquire data from a variety of different ranges to
generate a more representative data set. A plot of the observed CH4 concentration vs range is shown
in Figure 7. When the scanner is in motion the beam does not dwell on one spot, so the
measurement averaging time of 10 s is achieved by picking non temporally sequential data points
from nearby spatial areas. This has the effect of increasing the time range over which the data points
are averaged, thus increasing exposure to low frequency noise. Therefore, the precision is lower
when the beam is scanning than in the case of a stationary measurement as in Figure 5. Regardless,
the result achieved in Figure 7 closely matches the expected ambient 1.8 ppm concentration of CH4.

 Date: 01/02/2021
 QLM Technology Ltd
 Unit DX, Albert Road, St Philips, Bristol BS2 0XJ, UK Page | 13
 Company ID: 10673098 VAT No: 310069547
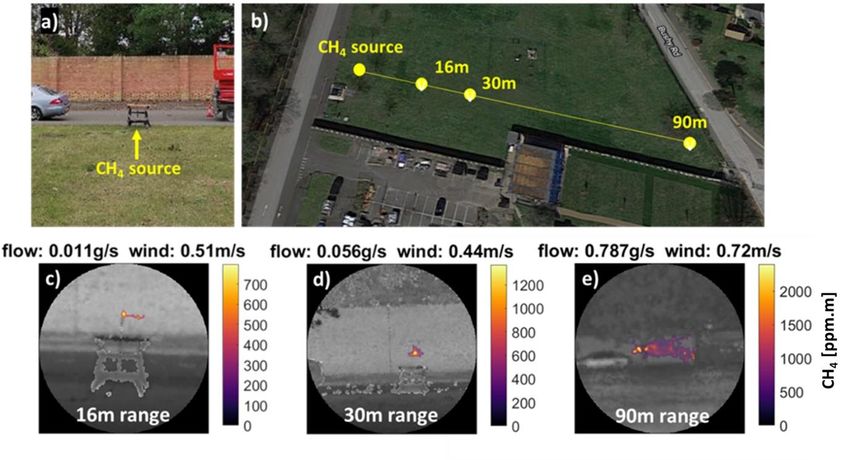
Figure 7: Measurement of the ambient CH4 in the atmosphere at varied ranges. The expected ~1.8 ppm ambient level is
 shown as a dashed line. The precision varies with the environmental reflection level at different distances

4.2 Field Trials with the National Physical Laboratory
A campaign of field trials was undertaken at the National Physical Laboratory. The prototype TDLidar
camera was used to image controlled releases of CH4 in an outdoor setting. Measurements were made
at a range of distances and release rates, in varying environmental conditions (both natural and
artificial). A flow control system similar to reference [27] was used to control the release rate of CH4.

Figure 8 illustrates the experimental setup for varied sensor range and flow rate measurements. The
camera was placed at several distances from a mounted release tube connected to a mass flow
controller. CH4 was nominally released at between 0.012 g/s and 0.835 g/s (the mass flow controller
used units of litres per minute, and these values corresponded to 1 L/min to 70 L/min). Measurements
were taken from distances between 16 m and 90 m from the CH4 release point with the sensor
directed horizontally across a field and a backdrop of trees and a brick wall for laser scattering as
shown in Figure 8a and b. The backdrop was around 15 m behind the CH4 release point.

Typical results from measurements in this configuration are shown in Figure 8c-e. Each image
corresponds to a measurement time of approximately one hundred seconds (i.e. 10,000 of the 10 ms
duration CH4 readings). Releases of as low as 0.012 g/s were imaged from the shorter 16 m range.
However, at longer ranges the relatively small solid angle occupied by the small leak made the
probability of intersection with the sensor beam too low for detection within a reasonable timeframe.
Releases of 0.056 g/s were imaged clearly from up to 30 m range, while the 0.835 g/s was easily
detectable from 90 m. Based on the relative size and high ppm.m values detected in the 0.835 g/s
release we estimate that this would be detectable at up to 200 m range, though due to the limited
size of the field this was not verified experimentally.

In summary larger CH4 releases were easily detectable at the longer ranges, while shorter range
measurements were able to detect and visualise even the smallest releases. The limitation in detection
of small leaks at long range was caused by the spatial resolution of the laser system, rather than a lack
of sensitivity to low ppm.m levels, or range of the optical transceiver system. It is expected that the

 Date: 01/02/2021
 QLM Technology Ltd
 Unit DX, Albert Road, St Philips, Bristol BS2 0XJ, UK Page | 14
 Company ID: 10673098 VAT No: 310069547
detection of small leaks (0.01 g/s) at long ranges (hundreds of meters) could be achieved if the laser
scanner directly intersected the plume.

Figure 8: Calibrated CH4 leak imaging. CH4 plumes of varying sizes were created with a calibrated piped CH4 supply and
measured at varying distances and environmental wind conditions. The experimental setup is shown in a) and b). Images c)-
e) show examples of ppm.m plume images overlaid on the signal level image as described in Figure 4d. Trials were conducted
at the National Physical Laboratory in Teddington UK.

An important factor in imaging and quantifying gas emissions is the speed of the wind. Variable wind
speeds were created using an artificial source in the form of a large fan, illustrated in Figure 9a. An
anemometer was positioned in the path of the fan, close to the CH4 source, to monitor the local air
flow speed. This setup allowed simulated wind to be applied to the CH4 source with speeds of 1 m/s
to around 10 m/s.

On this occasion, the sensor was deployed at height using a mobile elevated work platform (MEWP),
looking down over a short distance perpendicular to the flow of wind generated by the fan as shown
in Figure 9b. The background of the image was the grassy field around 13 m from the sensor. Release
rates and artificial wind speeds were varied to evaluate the limit at which wind speed reduced the
effectiveness of the measurement.

The variation in wind produced an expected variation in the shape of the plume, clearly imaged by the
TDLidar sensor. High wind velocity caused narrow and straight plumes, while lower wind velocity
produced border plumes with a gentle curve towards the wind direction (Figure 9c-h). At higher wind
velocities, some smaller releases are sufficiently diluted by the air flow to make them more difficult
for the camera to detect, resulting in less obvious visualisation and higher uncertainty in the flow rate
calculation. It should be noted, however, that the artificially induced wind was constant, which is
unlikely to be true of conditions experienced in real-world environments. It seems likely that capability
to image the way the plume changes shape and density over time could provide information about
the local wind speed [39] which would be useful for flow rate estimation.

 Date: 01/02/2021
 QLM Technology Ltd
 Unit DX, Albert Road, St Philips, Bristol BS2 0XJ, UK Page | 15
 Company ID: 10673098 VAT No: 310069547
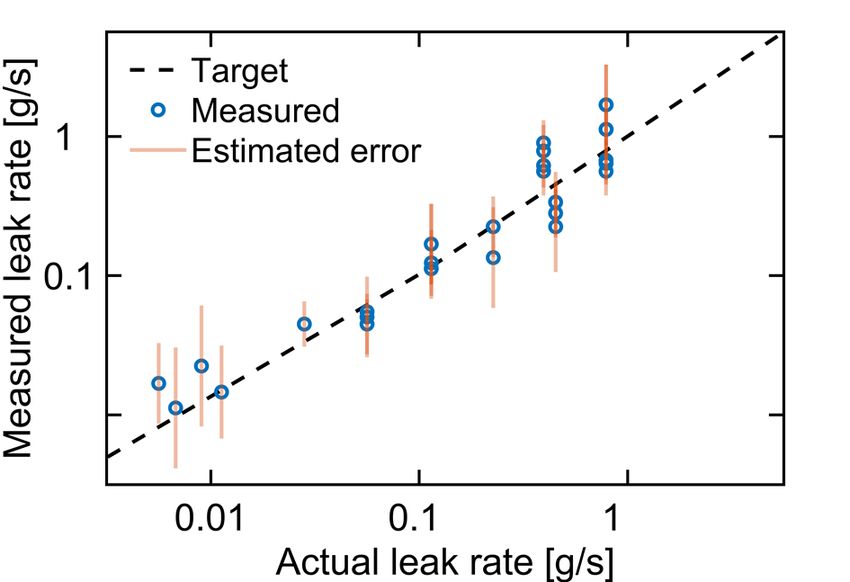
Figure 9: CH4 leak imaging with controlled wind conditions. CH4 plumes of varying sizes were measured at varying wind
speeds. The experimental setup using a large fan to vary winds speed at the plume is shown in a) and b). Images c)-h) show
example results for various combinations of wind speed and CH4 flow rate.

Flow rates were estimated using the simple mass balance algorithm applied to the entire data set
acquired during the trial. An anemometer positioned at roughly 1 m height was used to record the
wind speed with one-minute time resolution which was then used in the mass balance calculation.
The flow rate estimation results for all tests at NPL using the TDLidar sensor are shown in Figure 10.
This includes results from measurements with high (artificial) wind and long range. The correlation
between calculated leak flow rate and actual leak flow rate is strong considering the simple flow
algorithm and variety of wind speeds and ranges. Across the whole set there is an average percentage
error of around 50 % between the estimate and the true flow value. We believe this can be significantly
improved as we continue to refine the sensor performance and our flow rate calculations, but the
current results indicate very good potential for accuracy at the level needed for effective industrial
monitoring.

 Date: 01/02/2021
 QLM Technology Ltd
 Unit DX, Albert Road, St Philips, Bristol BS2 0XJ, UK Page | 16
 Company ID: 10673098 VAT No: 310069547
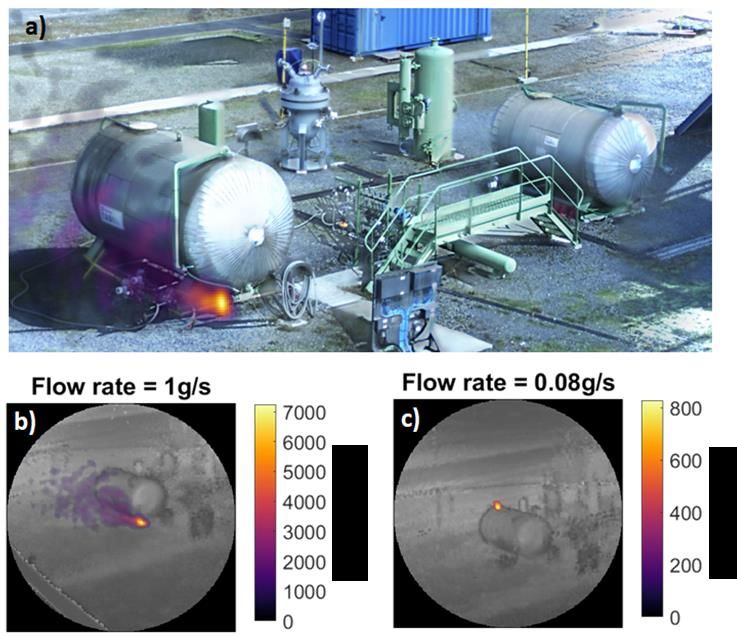
Figure 10: CH4 leak flow rate measurement accuracy. Comparison of calculated leak flow rate and calibrated leak rate for all
measurements during the NPL field trial.

4.3 Preliminary industrial trials with Total
QLM was invited to take part in blind CH4 emission monitoring tests run by Total SE on their TADI
(Transverse Anomaly Detection Infrastructure) platform in Lacq, France. These trials involve leak
detection and quantification equipment being set up around a dedicated zone that contains various
typical industrial infrastructure such as tanks and pipes. The site has been extensively plumbed with
an array of gas supply pipes and valves so that deliberate quantified leaks from 0.01 g/s to >100 g/s of
CH4 can be released on demand. The challenge for the equipment is to demonstrate the ability to
detect, localise and quantify blind releases (unknown location and unknown release rate). One “non-
blind” release with known flow rate was made, for calibration purposes, after which the leak detection
equipment under test needed to identify the location, and calculate the release rate, of leaks
generated over the site. Data generated by our TDLidar sensor during these trials has been very
promising but for now we are only able to share preliminary results.

Figure 11 shows some examples of data taken in these TADI tests. Figure 11a) is an image of a CH4
plume overlaid on a full-colour image taken with an onboard visual camera. This represents a close
approximation of the automatically generated images that we will provide in our commercially
released camera and clearly shows the exact location of the leak. Figure 11b and c show the TDLidar
sensor’s view of large and small leaks situated about a storage tank as examples in the style of the
previous images in the paper.

 Date: 01/02/2021
 QLM Technology Ltd
 Unit DX, Albert Road, St Philips, Bristol BS2 0XJ, UK Page | 17
 Company ID: 10673098 VAT No: 310069547
Figure 11: CH4 release measurement in an industrial environment. TDLidar images of CH4 releases test at Total’s TADI
(Transverse Anomaly Detection Infrastructure) platform at Lacq, France. a) CH4 plume image overlaid on full-colour
background image from visual camera b) and c) CH4 ppm.m plume images overlaid on the infrared signal level image as
described in Figure 4d. Data acquired at the Total TADI 2020 CH4 Quantification Blind Test trials.

Conclusions
To reduce CH4 emissions and slow global warming there is a widespread and growing need for
effective and scalable CH4 monitoring techniques that are deployable at industrial scale. Continuous
monitoring of CH4, as opposed to intermittent monitoring via surveys, offers the opportunity to enable
and verify CH4 emissions reduction programs by providing greater certainty in CH4 budgets, eliminating
estimation, and indicating where the greatest reductions can be made in the shortest possible time
frame. Government regulations are rapidly changing to reflect this, and the oil and gas industry has
committed to adopt a more effective CH4 monitoring and reporting strategy.

Continuous monitoring of emissions in the oil and gas industry is a major challenge due to the stringent
cost requirements of the industry and the obvious need for high durability, long lifetime, and complete
autonomy. In this paper we have demonstrated a unique Tunable Diode Lidar gas imaging technology
that meets these requirements. It utilises mature, robust, and highly cost effective and scalable near-
infrared telecommunications components in a unique configuration for spectroscopic Lidar. The
technology provides highly accurate CH4 concentration imaging using an active scanning technique
that can cover ranges of hundreds of meters. We have presented results of field trials of this
technology carried out with the help and support of the National Physical Laboratory. This has
demonstrated the capability of the technology for imaging CH4 emissions nominally as low as 0.012
g/s and larger leaks at ranges of up to 90 m. We have also previewed some results of trials at TOTAL’s
TADI platform where we demonstrated the sensor operating in a realistic industrial facility. We are
 Date: 01/02/2021
 QLM Technology Ltd
 Unit DX, Albert Road, St Philips, Bristol BS2 0XJ, UK Page | 18
 Company ID: 10673098 VAT No: 310069547
continuing to apply this technology to industrial applications with the help of end users, including the
UK National Physical Laboratory (NPL), National Grid Gas, BP and AMETEK Land.

The immediate target products are a fixed emplacement camera, mounted on a pan/tilt system to
survey a wide area from a single point, on a rugged and durable platform suitable for use in industrial
environments. The quantitative accuracy of the sensor, high quality of the multiple images it captures,
and lack of background interferences, means we expect our leak detection and quantification to be
reliable and autonomous. The next step will be to make the platform faster, smaller and lighter,
enabling deployment on mobile platforms such as UAVs. Of particular interest is autonomous UAV
monitoring, which removes the cost of the operator, and tethered versions which remove limitations
on flight time. We believe these solutions can be at the forefront of regulatory development, and
provide operators with the means to both comply, and to reach ambitious Net-Zero carbon targets,
on a readily available, cost effective platform.

 Date: 01/02/2021
 QLM Technology Ltd
 Unit DX, Albert Road, St Philips, Bristol BS2 0XJ, UK Page | 19
 Company ID: 10673098 VAT No: 310069547
Acknowledgements
We are grateful for funding support from the Innovate UK through the National Quantum Technology
Programme SPLICE project no. 106174 and the Analysis 4 Innovators Programme project no. 105579.
We also want to thank the University of Bristol, the Emissions and Atmospheric Metrology Group at
the National Physical Laboratory, and Total SE France for working closely with us. Particular thanks to
John Rarity at University of Bristol and Jon Helmore and Nigel Yarrow at NPL for their generous support
in time and discussions.

 Date: 01/02/2021
 QLM Technology Ltd
 Unit DX, Albert Road, St Philips, Bristol BS2 0XJ, UK Page | 20
 Company ID: 10673098 VAT No: 310069547
References
[1] T. Stocker, D. Qin, G. Plattner, M. Tignor, and S. Allen, “Climate Change 2013: The physical
 science basis. contribution of working group I to the fifth assessment report of IPCC the
 intergovernmental panel on,” 2014, Accessed: Jan. 22, 2021. [Online]. Available:
 https://boris.unibe.ch/71452/.
[2] M. Etminan, G. Myhre, E. J. Highwood, and K. P. Shine, “Radiative forcing of carbon dioxide,
 methane, and nitrous oxide: A significant revision of the methane radiative forcing,” Geophys.
 Res. Lett., vol. 43, no. 24, pp. 12,614-12,623, Dec. 2016, doi: 10.1002/2016GL071930.
[3] R. L. Thompson et al., “Methane emissions in East Asia for 2000-2011 estimated using an
 atmospheric Bayesian inversion,” J. Geophys. Res. Atmos., vol. 120, no. 9, pp. 4352–4369,
 May 2015, doi: 10.1002/2014JD022394.
[4] D. Shindell et al., “Simultaneously mitigating near-term climate change and improving human
 health and food security,” Science (80-. )., vol. 335, no. 6065, pp. 183–189, Jan. 2012, doi:
 10.1126/science.1210026.
[5] J. D. Maasakkers et al., “Global distribution of methane emissions, emission trends, and OH
 concentrations and trends inferred from an inversion of GOSAT satellite data for 2010–2015,”
 Atmos. Chem. Phys., vol. 19, no. 11, pp. 7859–7881, Jun. 2019, doi: 10.5194/acp-19-7859-
 2019.
[6] S. Schwietzke et al., “Upward revision of global fossil fuel methane emissions based on
 isotope database,” Nature, vol. 538, no. 7623, pp. 88–91, Oct. 2016, doi:
 10.1038/nature19797.
[7] M. Saunois et al., “The global methane budget 2000-2012,” Earth Syst. Sci. Data, vol. 8, no. 2,
 pp. 697–751, Dec. 2016, doi: 10.5194/essd-8-697-2016.
[8] Y. Zhang et al., “Quantifying methane emissions from the largest oil-producing basin in the
 United States from space,” Sci. Adv., vol. 6, no. 17, Apr. 2020, doi: 10.1126/sciadv.aaz5120.
[9] A. L. Mitchell et al., “Measurements of methane emissions from natural gas gathering
 facilities and processing plants: Measurement results,” Environ. Sci. Technol., vol. 49, no. 5,
 pp. 3219–3227, Mar. 2015, doi: 10.1021/es5052809.
[10] D. Zavala-Araiza et al., “Super-emitters in natural gas infrastructure are caused by abnormal
 process conditions,” Nat. Commun., vol. 8, no. 1, pp. 1–10, Jan. 2017, doi:
 10.1038/ncomms14012.
[11] T. A. Fox, T. E. Barchyn, D. Risk, A. P. Ravikumar, and C. H. Hugenholtz, “A review of close-
 range and screening technologies for mitigating fugitive methane emissions in upstream oil
 and gas,” Environ. Res. Lett., vol. 14, no. 5, p. 053002, Apr. 2019, doi: 10.1088/1748-
 9326/ab0cc3.
[12] “FLIR Gas-Find 320. FLIR Systems Inc.: Wilsonville, OR, 2011.” .
[13] “MONITOR | arpa-e.energy.gov.” https://www.arpa-
 e.energy.gov/technologies/programs/monitor (accessed Jan. 31, 2021).
[14] N. Hagen, “Survey of autonomous gas leak detection and quantification with snapshot
 infrared spectral imaging,” J. Opt. (United Kingdom), vol. 22, no. 10, p. 103001, Oct. 2020, doi:
 10.1088/2040-8986/abb1cf.
[15] A. P. Ravikumar, J. Wang, and A. R. Brandt, “Are Optical Gas Imaging Technologies Effective
 for Methane Leak Detection?,” Environ. Sci. Technol., vol. 51, no. 1, pp. 718–724, Jan. 2017,
 doi: 10.1021/acs.est.6b03906.
[16] J. Sandsten, P. Weibring, H. Edner, and S. Svanberg, “Real-time gas-correlation imaging
 employing thermal background radiation,” Opt. Express, vol. 6, no. 4, p. 92, Feb. 2000, doi:
 10.1364/oe.6.000092.
[17] J. Wang et al., “Machine vision for natural gas methane emissions detection using an infrared
 camera,” Appl. Energy, vol. 257, 2020, doi: 10.1016/j.apenergy.2019.113998.
[18] M. Gålfalk, G. Olofsson, P. Crill, and D. Bastviken, “Making methane visible,” Nat. Clim.
 Date: 01/02/2021
 QLM Technology Ltd
 Unit DX, Albert Road, St Philips, Bristol BS2 0XJ, UK Page | 21
 Company ID: 10673098 VAT No: 310069547
Chang., vol. 6, no. 4, 2016, doi: 10.1038/nclimate2877.
[19] N. Hagen et al., “Video-rate spectral imaging of gas leaks in the longwave infrared,” in
 Chemical, Biological, Radiological, Nuclear, and Explosives (CBRNE) Sensing XIV, May 2013,
 vol. 8710, p. 871005, doi: 10.1117/12.2015520.
[20] N. Hagen and M. W. Kudenov, “Review of snapshot spectral imaging technologies,” Opt. Eng.,
 vol. 52, no. 9, p. 090901, Sep. 2013, doi: 10.1117/1.oe.52.9.090901.
[21] J. Mellqvist, J. Samuelsson, and B. Galle, “The solar occultation flux method, a new technique
 to quantify fugitive voc emissions,” 2006, Accessed: Jan. 29, 2021. [Online]. Available:
 www.hitran.com.
[22] A. Fried and D. Richter, “Infrared Absorption Spectroscopy,” in Analytical Techniques for
 Atmospheric Measurement, Oxford, UK: Blackwell Publishing, 2007, pp. 72–146.
[23] H. R. Simonsen, J. Henningsen, and T. Mogelberg, “Monitoring of molecular species using
 near-infrared extended cavity diode lasers,” in LEOS Summer Topical Meeting, 1997, pp. 46–
 47, doi: 10.1109/leosst.1997.619214.
[24] M. B. Frish, R. T. Wainner, B. D. Green, J. Stafford-Evans, M. C. Laderer, and M. G. Allen,
 “Progress in reducing size and cost of trace gas analyzers based on tunable diode laser
 absorption spectroscopy,” in Advanced Environmental, Chemical, and Biological Sensing
 Technologies II, Dec. 2004, vol. 5586, p. 76, doi: 10.1117/12.580938.
[25] R. T. Wainner, N. F. Aubut, M. C. Laderer, and M. B. Frish, “Scanning, standoff TDLAS leak
 imaging and quantification,” in Next-Generation Spectroscopic Technologies X, May 2017, vol.
 10210, p. 1021006, doi: 10.1117/12.2264799.
[26] R. A. Baumgartner and R. L. Byer, “Continuously tunable ir lidar with applications to remote
 measurements of SO_2 and CH_4,” Appl. Opt., vol. 17, no. 22, p. 3555, Nov. 1978, doi:
 10.1364/AO.17.003555.
[27] T. Gardiner, J. Helmore, F. Innocenti, and R. Robinson, “Field Validation of Remote Sensing
 Methane Emission Measurements,” Remote Sens., vol. 9, no. 9, p. 956, Sep. 2017, doi:
 10.3390/rs9090956.
[28] A. K. Chambers, M. Strosher, T. Wootton, J. Moncrieff, and P. McCready, “Direct
 measurement of fugitive emissions of hydrocarbons from a refinery,” J. Air Waste Manag.
 Assoc., vol. 58, no. 8, pp. 1047–1056, 2008, doi: 10.3155/1047-3289.58.8.1047.
[29] J. B. Abshire et al., “remote sensing Airborne Measurements of CO 2 Column Concentration
 and Range Using a Pulsed Direct-Detection IPDA Lidar,” Remote Sens, vol. 6, pp. 443–469,
 2011, doi: 10.3390/rs6010443.
[30] F. Innocenti, R. Robinson, T. Gardiner, A. Finlayson, and A. Connor, “Differential Absorption
 Lidar (DIAL) Measurements of Landfill Methane Emissions,” Remote Sens., vol. 9, no. 9, p.
 953, Sep. 2017, doi: 10.3390/rs9090953.
[31] E. S. F. Berman, M. Fladeland, J. Liem, R. Kolyer, and M. Gupta, “Greenhouse gas analyzer for
 measurements of carbon dioxide, methane, and water vapor aboard an unmanned aerial
 vehicle,” Sensors Actuators, B Chem., vol. 169, pp. 128–135, Jul. 2012, doi:
 10.1016/j.snb.2012.04.036.
[32] L. M. Golston et al., “Lightweight mid-infrared methane sensor for unmanned aerial
 systems,” Appl. Phys. B, vol. 123, no. 6, p. 170, Jun. 2017, doi: 10.1007/s00340-017-6735-6.
[33] N. Takeuchi, N. Sugimoto, H. Baba, and K. Sakurai, “Random modulation cw lidar,” Appl. Opt.,
 vol. 22, no. 9, p. 1382, May 1983, doi: 10.1364/ao.22.001382.
[34] X. Ai et al., “Analysis of a random modulation single photon counting differential absorption
 lidar system for space-borne atmospheric CO_2 sensing,” Opt. Express, vol. 24, no. 18, p.
 21119, Sep. 2016, doi: 10.1364/OE.24.021119.
[35] G. F. Marshall, “Risley prism scan patterns,” in Optical Scanning: Design and Application, Jul.
 1999, vol. 3787, pp. 74–86, doi: 10.1117/12.351658.
[36] H. Shalom, A. Zadok, M. Tur, P. J. Legg, W. D. Cornwell, and I. Andonovic, “On the various

 Date: 01/02/2021
 QLM Technology Ltd
 Unit DX, Albert Road, St Philips, Bristol BS2 0XJ, UK Page | 22
 Company ID: 10673098 VAT No: 310069547
You can also read