Single-Cell Transcriptomic Analysis Reveals Developmental Relationships and Specific Markers of Mouse Periodontium Cellular Subsets
←
→
Page content transcription
If your browser does not render page correctly, please read the page content below
ORIGINAL RESEARCH
                                                                                                                                            published: 12 August 2021
                                                                                                                                     doi: 10.3389/fdmed.2021.679937

                                             Single-Cell Transcriptomic Analysis
                                             Reveals Developmental
                                             Relationships and Specific Markers
                                             of Mouse Periodontium Cellular
                                             Subsets
                                             Mizuki Nagata 1 , Angel Ka Yan Chu 2 , Noriaki Ono 3 , Joshua D. Welch 2 and Wanida Ono 1*
                                             1
                                              Department of Orthodontics, University of Texas Health Science Center at Houston School of Dentistry, Houston, TX,
                                             United States, 2 Department of Computational Medicine and Bioinformatics, Department of Computer Science and
                                             Engineering, University of Michigan, Ann Arbor, MI, United States, 3 Department of Diagnostic & Biomedical Sciences,
                                             University of Texas Health Science Center at Houston School of Dentistry, Houston, TX, United States

                                             The periodontium is essential for supporting the functionality of the tooth, composed
                                             of diversity of mineralized and non-mineralized tissues such as the cementum, the
                                             periodontal ligament (PDL) and the alveolar bone. The periodontium is developmentally
                                             derived from the dental follicle (DF), a fibrous tissue surrounding the developing
                            Edited by:       tooth bud. We previously showed through in vivo lineage-tracing experiments that
                          Joy Richman,
University of British Columbia, Canada
                                             DF contains mesenchymal progenitor cells expressing parathyroid hormone-related
                         Reviewed by:
                                             protein (PTHrP), which give rise to cells forming the periodontal attachment apparatus
                            Fuhua Yan,       in a manner regulated by autocrine signaling through the PTH/PTHrP receptor.
      Nanjing Stomatological Hospital        However, the developmental relationships between PTHrP+ DF cells and diverse
                          (NSH), China
                        Hongchen Sun,        cell populations constituting the periodontium remain undefined. Here, we performed
                 Jilin University, China     single-cell RNA-sequencing (scRNA-seq) analyses of cells in the periodontium by
                 *Correspondence:            integrating the two datasets, i.e. PTHrP-mCherry+ DF cells at P6 and 2.3kb Col1a1
                       Wanida Ono
            Wanida.Ono@uth.tmc.edu
                                             promoter-driven GFP+ periodontal cells at P25 that include descendants of PTHrP+
                                             DF cells, cementoblasts, osteoblasts and periodontal ligament cells. This integrative
                    Specialty section:       scRNA-seq analysis revealed heterogeneity of cells of the periodontium and their cell
          This article was submitted to
                                             type-specific markers, as well as their relationships with DF cells. Most importantly, our
                Regenerative Dentistry,
                a section of the journal     analysis identified a cementoblast-specific metagene that discriminate cementoblasts
           Frontiers in Dental Medicine      from alveolar bone osteoblasts, including Pthlh (encoding PTHrP) and Tubb3. RNA
           Received: 12 March 2021           velocity analysis indicated that cementoblasts were directly derived from PTHrP+ DF
            Accepted: 16 July 2021
          Published: 12 August 2021
                                             cells in the early developmental stage and did not interconvert with other cell types.
                            Citation:
                                             Further, CellPhoneDB cell-cell communication analysis indicated that PTHrP derived
         Nagata M, Chu AKY, Ono N,           from cementoblasts acts on diversity of cells in the periodontium in an autocrine and
         Welch JD and Ono W (2021)
                                             paracrine manner. Collectively, our findings provide insights into the lineage hierarchy
   Single-Cell Transcriptomic Analysis
 Reveals Developmental Relationships         and intercellular interactions of cells in the periodontium at a single-cell level, aiding to
      and Specific Markers of Mouse          understand cellular and molecular basis of periodontal tissue formation.
       Periodontium Cellular Subsets.
         Front. Dent. Med. 2:679937.         Keywords: mesenchymal progenitor cells, parathyroid hormone-related protein, dental follicle, periodontium,
   doi: 10.3389/fdmed.2021.679937            single cell analysis, mouse genetic models

Frontiers in Dental Medicine | www.frontiersin.org                                 1                                           August 2021 | Volume 2 | Article 679937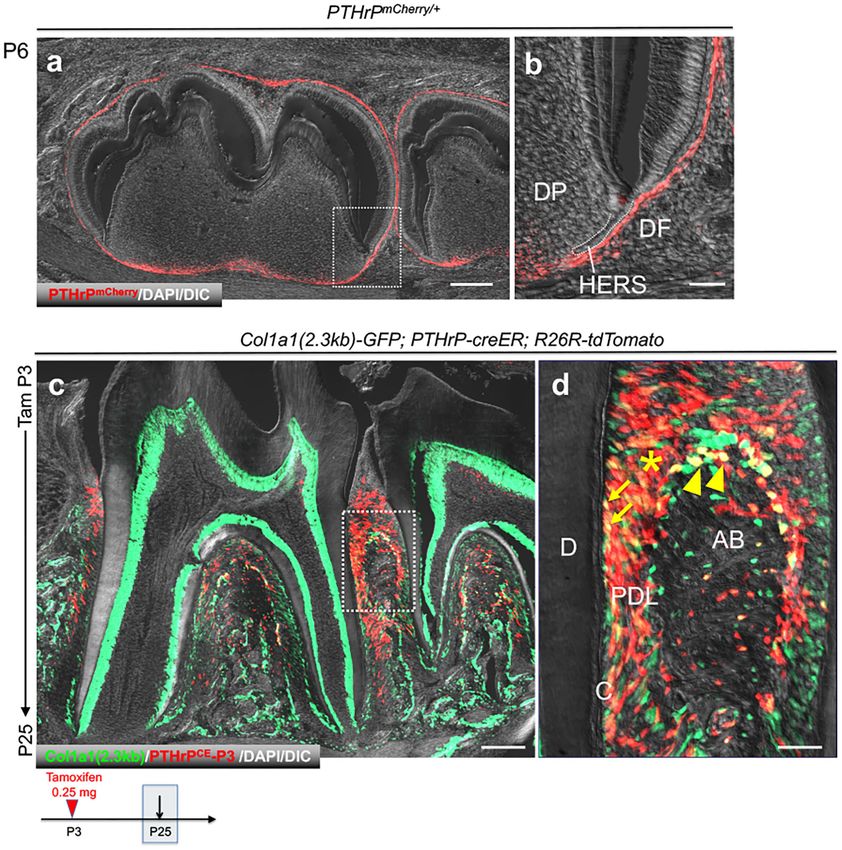
Nagata et al.                                                                                    Single-Cell Analysis Reveals Markers of Periodontium

INTRODUCTION                                                               Science University, OR, USA). All procedures were conducted
                                                                           in compliance with the Guidelines for the Care and Use of
The periodontium is an important structure anchoring the tooth             Laboratory Animals approved by the University of Michigan’s
to the bone, which is composed of diversity of mineralized and             Institutional Animal Care and Use Committee (IACUC),
non-mineralized tissues such as the cementum, the alveolar bone,           protocol 8944 and 9496 (Ono). All mice were housed in a specific
the gingiva and the periodontal ligament (PDL). Development                pathogen-free condition, and analyzed in a mixed background.
of the highly functional periodontal attachment apparatus                  Tamoxifen (0.25mg) was injected intraperitoneally into P3 mice.
requires a precise coordination of cell fates and differentiation          Mice were euthanized by over-dosage of CO2 or decapitation
of primitive mesenchymal cells. However, the mechanisms                    under inhalation anesthesia in a drop jar (Fluriso, Isoflurane
underlying how diverse types of cells in the periodontium –                USP, VetOne).
PDL cells, cementoblasts, and alveolar bone osteoblasts – are
developmentally related one another and to their precursor cell            Tamoxifen
populations remains largely undefined.                                     Tamoxifen (T5648; Sigma-Aldrich) was mixed with 100% ethanol
    The dental follicle (DF), a sac-like fibrous tissue surrounding        until completely dissolved. Subsequently, a proper volume of
the developing tooth bud, contains mesenchymal progenitor                  sunflower seed oil (Sigma S5007) was added to the tamoxifen-
cells that provide a cellular source for the periodontal                   ethanol mixture and rigorously mixed. The tamoxifen-ethanol-
attachment apparatus that is formed at the later stage (1). We             oil mixture was incubated at 60◦ C in a chemical hood until the
previously demonstrated that DF cells expressing parathyroid               ethanol evaporated completely. The tamoxifen-oil mixture was
hormone-related protein (PTHrP) function as mesenchymal                    stored at room temperature until use.
progenitor cells that orchestrate proper formation of the
periodontal tissue in a manner mediated by parathyroid hormone             Histology and Immunohistochemistry
(PTH)/PTHrP receptor signaling (2–4). Also in our previous                 Samples were dissected under a stereomicroscope (Nikon SMZ-
study, we characterized PTHrP+ DF cells using a single-cell                800) to remove soft tissues, and fixed in 4% paraformaldehyde
RNA sequencing (scRNA-seq) approach and defined cellular                   overnight at 4◦ C, then decalcified in 15% EDTA for 7 days.
heterogeneity of PTHrP+ DF cells. Single-cell RNA-seq analysis             Decalcified samples were cryoprotected in 30% sucrose/PBS
has been successfully applied to tooth-related cell types in the           solutions and then in 30% sucrose/PBS:OCT (1:1) solutions,
previous studies (2, 5–7). However, cellular heterogeneity of the          each at least overnight at 4◦ C. Samples were embedded in an
cells in the periodontium and their developmental relationships            OCT compound (Tissue-Tek, Sakura) under a stereomicroscope
with their earlier precursor cells are not yet dissected by scRNA-         and transferred on a sheet of dry ice to solidify the compound.
seq. Definitive answers at a single cell level would resolve long-         Embedded samples were cryosectioned at 16µm using a
standing debates regarding whether cementoblasts genuinely                 cryostat (Leica CM1850) and adhered to positively charged
represent a cell type distinct from osteoblasts, which largely             glass slides (Fisherbrand ColorFrost Plus). Cryosections were
emanates from lack of in vivo cementoblast specific markers                stored at −20◦ C in freezers until use. Sections were postfixed
(8, 9).                                                                    in 4% paraformaldehyde for 20 min at room temperature.
    In this study, we performed scRNA-seq analyses of cells in the         For immunostaining, sections were permeabilized with 0.25%
periodontium, and computationally defined their relationships              TritonX/TBS for 30 min, blocked with 3% BSA/TBST for
with their precursor cells. To this end, we integrated the                 30 min, and incubated with rabbit anti-TUBB3 polyclonal
two scRNA-seq datasets i.e. PTHrP-mCherry+ DF cells at P6                  antibody (1:500, Abcam ab18207), or sheep anti-DMP1
that we published previously [GSE120108], and Col1a1(2.3kb)-               polyclonal antibody (1:100, R&D AF4386) overnight at 4◦ C,
GFP+ cells at P25 including descendants of PTHrP+ DF cells,                and subsequently with Alexa Fluor 647-conjugated donkey
cementoblasts, osteoblasts and PDL cells that we newly generated           anti-rabbit IgG (A31573) for 3 hours at room temperature.
for this study [GSE168450], using the LIGER algorithm (10).                Sections were further incubated with DAPI (4’,6-diamidino-2-
Our findings provide insights into the lineage hierarchy and               phenylindole, 5 µg/ml, Invitrogen D1306) to stain nuclei. In situ
intercellular interactions of cells in the periodontium at a single-       hybridization was performed with RNAscope 2.5 HD Reagent
cell level, aiding to understand cellular and molecular basis of           kit Brown (Advanced Cell Diagnostics 322300) using Foxf1
periodontal tissue formation.                                              probe (Advanced Cell Diagnostics 473051) according to the
                                                                           manufacturer’s protocol. Stained samples were mounted in TBS
MATERIALS AND METHODS                                                      with No.1.5 coverslips (Fisher).

Mice                                                                       Imaging
PTHrP-mCherry/null knock-in and PTHrP-creER bacterial                      Images for fixed sections and live cell culture were captured
artificial chromosome (BAC) mice have been described                       by an automated inverted fluorescence microscope with a
previously (2, 11). Col1a1(2.3kb)-GFP (JAX013134), osteocalcin             structured illumination system (Zeiss Axio Observer Z1 with
(Oc)-GFP (JAX017469) and Rosa26-CAG-loxP-stop-loxP-                        ApoTome.2 system) and Zen 2 (blue edition) software. The
tdTomato (Ai14: R26R-tdTomato, JAX007914) mice were                        filter settings used were: FL Filter Set 34 (Ex. 390/22, Em.
acquired from the Jackson laboratory. Scleraxis (Scx)-GFP mice             460/50 nm), Set 38 HE (Ex. 470/40, Em. 525/50 nm), Set 43
were kindly provided by Ronen Schweitzer (Oregon Health and                HE (Ex. 550/25, Em. 605/70 nm), Set 50 (Ex. 640/30, Em.

Frontiers in Dental Medicine | www.frontiersin.org                     2                                     August 2021 | Volume 2 | Article 679937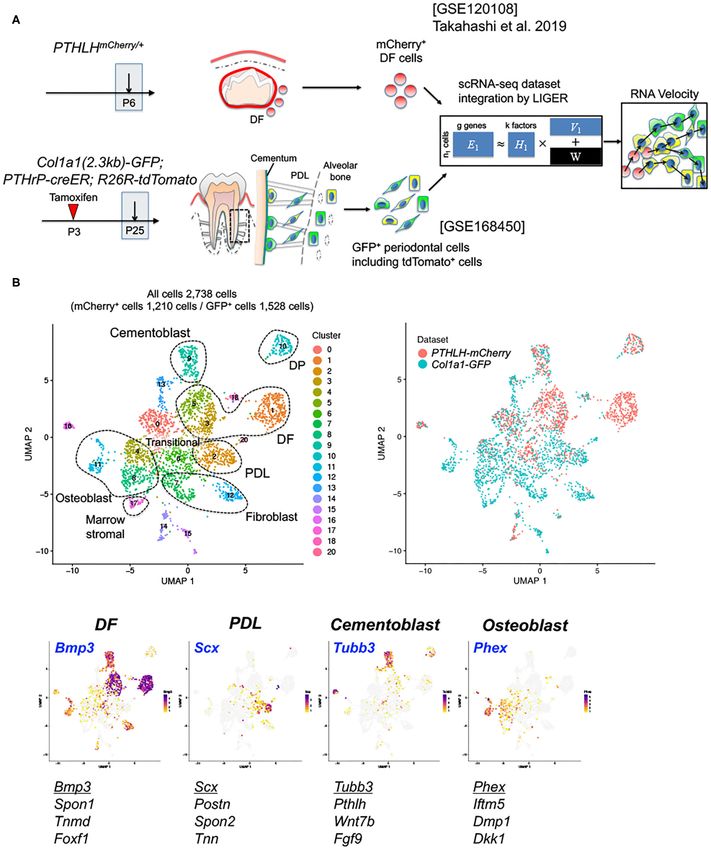
Nagata et al.                                                                                   Single-Cell Analysis Reveals Markers of Periodontium

690/50 nm) and Set 63 HE (Ex. 572/25, Em. 629/62 nm). The                LIGER Data Integration
objectives used were: Fluar 2.5×/0.12, EC Plan-Neofluar 5×/0.16,         LIGER (version 0.5.0) (10) was used for sample integration,
Plan- Apochromat 10x/0.45, EC Plan-Neofluar 20×/0.50, EC                 normalization, clustering, and visualization. A joint LIGER
Plan-Neofluar 40×/0.75, Plan- Apochromat 63×/1.40. Images                object was created using the two datasets (PTHrP-mCherry
were typically tile-scanned with a motorized stage, Z-stacked            and Col1a1(2.3kb)-GFP). We followed our recently published
and reconstructed by a maximum intensity projection (MIP)                protocol (12). Gene expression count data for the combined
function. Differential interference contrast (DIC) was used for          sample was normalized and scaled with functions “normalize”
objectives higher than 10×. Representative images of at least            and “scaleNotCenter”. Next, we selected 3,000 highly variable
three independent biological samples are shown in the figures.           genes across samples with function “selectGenes”. We utilized
                                                                         function “optimizeALS” for integrative non-negative matrix
                                                                         factorization (iNMF) and function “quantile_norm” for quantile
Cell Preparation                                                         alignment. Two-dimensional visualization and clustering were
Gingival tissues of detached mandibles were completely removed           carried out with “louvainCluster” at resolution 0.75 and
using sharp forceps, and dentoalveolar components including              “runUMAP” with cosine distance, nearest neighbors set to 30,
molars, dental sacs or periodontal tissue, were carefully resected       and minimum distance to 0.55. While Ptprc+ hematopoietic cells,
using a disposable scalpel (No.15, Graham-Field). Molars (M1             Cdh5+ endothelial cells, Krt5+ epithelial cells, and Plp1+ glial
and M2) were carefully extracted from sockets in a 35 mm dish            cells were filtered, mesenchymal cells, expressing a high level
containing 3 ml Ca2+ , Mg2+ -free Hank’s Balanced Salt Solution          of Postn, were retained (Supplementary Figure 1B). The Postn+
(HBSS, Sigma H6648) containing 2 Wunsch units of Liberase                cells underwent re-normalization and re-clustering with similar
TM (Roche), and incubated at 37◦ C for 15 min. on a shaking              procedures as described, with the exception that “louvainCluster”
incubator (ThermomixerR, Eppendorf). DF cells or periodontal             was applied using a resolution of 0.90 and “runUMAP” using a
cells were obtained by rigorous pipetting and filtration through         minimum distance of 0.45.
a 70 µm cell strainer (BD) into a 50 ml tube on ice to make                  To identify the differentially expressed genes (DEGs) among
single cell suspension. Cells were pelleted and resuspended in           clusters, non-parametric Wilcoxon rank sum test was performed,
appropriate medium for subsequent purposes.                              with function “runWilcoxon”. We filtered statistically significant
                                                                         (adjusted p-value < 0.05) and highly differentially expressed
                                                                         (logFC > 3) genes for clusters, with the exception of cluster
Single Cell RNA Sequencing (scRNA-seq)                                   6, the DEGs of which were discovered by setting the logFC
Analysis of FACS-Sorted Periodontal Cells                                threshold to 1.5. The top 100 DEGs were selected for comparison
Dissociated periodontal cells harvested from P25 Col1(2.3kb)-            and were used for cluster annotation. Being distinguished as
GFP;PTHrP-creER;R26R-tdTomato molars were pooled. Cell                   macrophages (Cd86+ and Itgam+), cells in cluster 19 were
sorting was performed using a six-laser Sony Synergy SY3200              filtered. Characterized by known molecular markers, cells were
(Ex.350/405/488/561/594/685nm) high-speed cell sorter with a             assigned to DF cells, fibroblasts, PDL cells, transitional cells,
100-µm nozzle. Col1a1(2.3kb)-GFP+ cells including tdTomato+              cementoblasts, DP cells, osteoblasts, and marrow stromal cells
cells were directly sorted into ice-cold DPBS/1% FBS, pelleted           (Supplementary Figure 2). Cluster identities were demonstrated
by centrifugation and resuspended in 30 µl DPBS/1% FBS using             in Figure 2B. A total of 2,738 filtered cells were used for further
wide-bore pipettes. Cell numbers were quantified by Countless II         scRNA downstream analysis.
automated Cell Counter (ThermoFisher) before loading onto the
Chromium Single Cell 3’ microfluidics chip (10× Genomics Inc.,           RNA Velocity Analysis (velocyto and scVelo)
Pleasanton, CA). cDNA libraries were sequenced by Illumina               The two sample-specific aligned bam files were used as
HiSeq 4,000 using two lanes and 50 cycle paired-end read,                input for velocyto (13) to quantify the unspliced and spliced
generating a total of ∼ 770 million reads. The sequencing data           abundances in loom format, and subsequently were merged
was first pre-processed using the 10× Genomics Cell Ranger               with function “adata.concatenate”. To calculate the RNA
software. For alignment purposes, we generated and used a                velocities (rates of transcription, splicing and degradation)
custom genome fasta and index file by including the sequences of         of the single cells, we utilized scVelo (version 0.2.2) (14),
mCherry to the mouse genome (mm10). The scRNA-seq dataset                exploring future cell trajectories. The combined loom
presented herein have been deposited in the National Center for          file was normalized and log-transformed with function
Biotechnology Information (NCBI)’s Gene Expression Omnibus               scvelo.pp.filter_and_normalize(min_shared_counts          =    20,
(GEO) and are accessible through GEO Series accession number             n_top_genes = 5,500, flavor = “seurat”). The first and second
GSE120108 and GSE168450. The dataset GSE120108 has been                  order moments for each cell across its nearest neighbors were
published previously (2).                                                computed with function scvelo.pp.moments(method = ‘umap’,
                                                                         n_neighbors = 30, n_pcs = 30, knn = True). The velocities were
                                                                         estimated by running the likelihood-based dynamical model with
Integrative Single-Cell Computational                                    function scvelo.tl.velocity(mode = “dynamical”) and the velocity
Transcriptomic Analysis                                                  graph was constructed with scvelo.tl.velocity_graph(). To test for
We filtered out cells with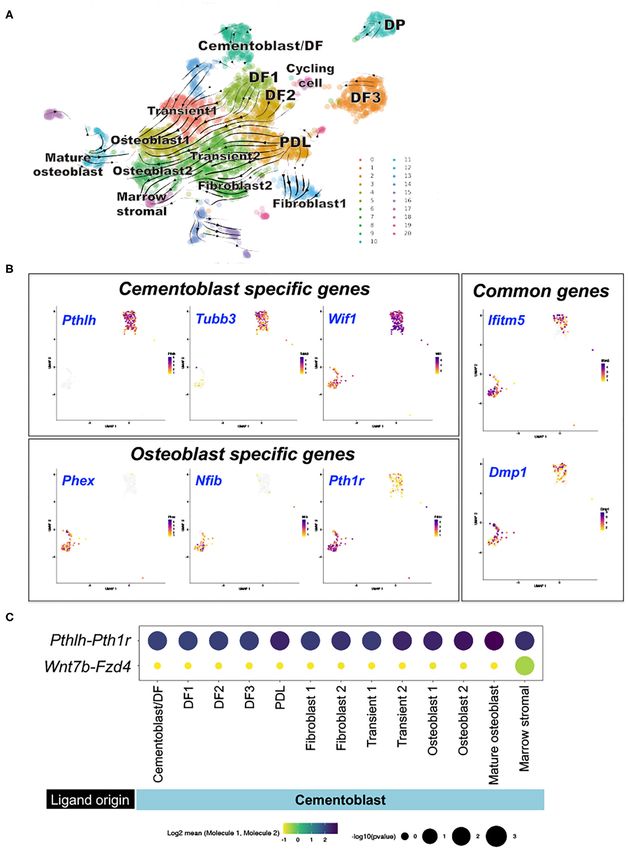
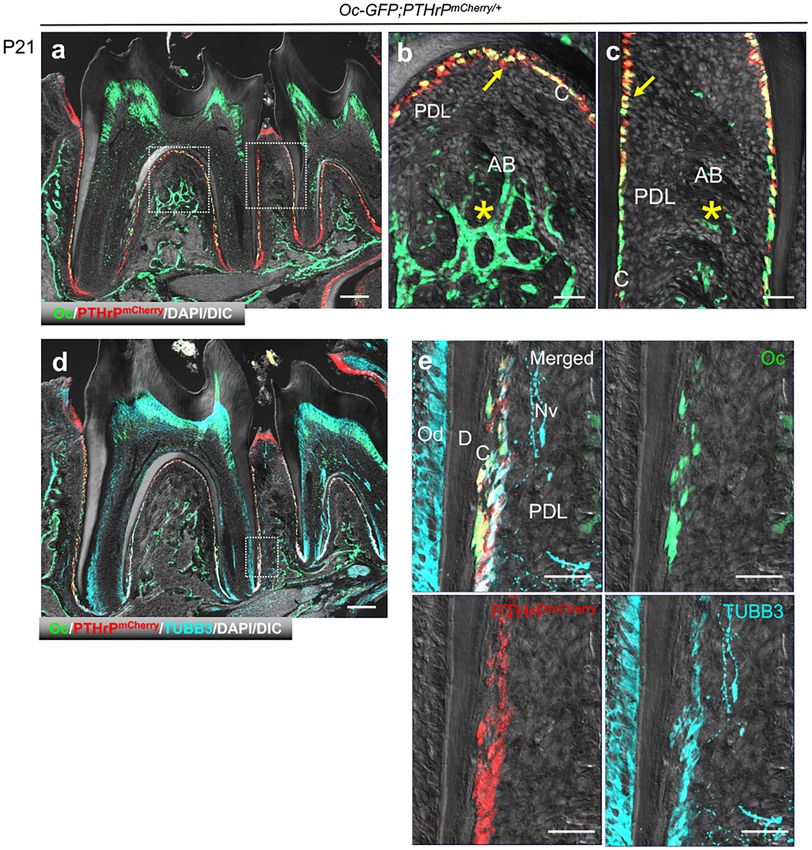
Nagata et al.                                                                                                 Single-Cell Analysis Reveals Markers of Periodontium

we applied the function scvelo.tl.differential_kinetic_test.                        velocities, the cluster assignments and UMAP coordinates
RNA velocities were then recomputed with functions                                  were extracted from the LIGER analysis output. Velocities
scvelo.pp.neighbors(method = ‘umap’, n_neighbors = 30,                              were projected onto the UMAP coordinates, using function
n_pcs = 30, knn = True), scvelo.tl.velocity(diff_kinetics =                         scvelo.tl.velocity_embedding_stream(basis = ‘umap’). The
True), and scvelo.tl.velocity_graph(). To visualize the RNA                         resulting visualization can be found in Figure 3A.

 FIGURE 1 | PTHrP+ DF mesenchymal progenitor cells differentiate into Col1a1-GFP+ periodontal cells during tooth root development. (a,b) Mandibular tooth bud of
 PTHrPmCherry/+ . DP: dental papilla, DF; dental follicle, HERS: Hertwig’s epithelial root sheath. (c,d) Mandibular molars of Col1a1(2.3kb)-GFP;
 PTHrP-creER;R26R-tdtomato. D: dentin, C: cementoblast, PDL: periodontal ligament, AB: alveolar bone. Arrow: Col1a1-GFP+ tdTomato+ cementoblasts on the root
 surface, Arrowhead: Col1a1-GFP+ tdTomato+ osteoblasts on the cryptal alveolar bone, *: Col1a1-GFP+ tdTomato+ PDL cells. Scale bars: 200 µm (a,c), 50 µm (b,d).

Frontiers in Dental Medicine | www.frontiersin.org                              4                                          August 2021 | Volume 2 | Article 679937
Nagata et al.                                                                                                     Single-Cell Analysis Reveals Markers of Periodontium

 FIGURE 2 | Characterization of PTHrP-mCherry+ DF cells and Col1a1-GFP+ periodontal cells. (A) Overview of the scRNA-seq analysis workflow. PTHrP-mCherry+
 cells at P6 and Col1a1-GFP+ periodontal cells at P25 were harvested, and LIGER takes two single-cell datasets, GSE120108 and GSE168450 as input. We
 integrated single-cell datasets using LIGER and performed RNA velocity analysis. (B) UMAP-based visualization of major classes of FACS-sorted cells; dots indicate
 individual cells. Left upper panel: cells colored by LIGER clustering. Right upper panel: cells colored by sample. Feature plot of cell-type specific markers. High
 expression: violet, Low expression: yellow, No expression: gray. A total of 2,738 filtered cells from two datasets, 1,210 PTHrP-mCherry+ cells and 1,528
 Col1a1-GFP+ cells. DF: dental follicle, DP: dental pulp, PDL: periodontal ligament.

Frontiers in Dental Medicine | www.frontiersin.org                                5                                            August 2021 | Volume 2 | Article 679937
Nagata et al.                                                                                                     Single-Cell Analysis Reveals Markers of Periodontium

 FIGURE 3 | Computational lineage inference and intercellular communications of subset of PTHrP-mCherry+ DF cells and Col1a1-GFP+ periodontal cells. (A) RNA
 velocity analysis. Left panel: Dynamic velocity vectors superimposed on UMAP plot. Arrows: dynamic velocity vectors predicted future cell states. Right panel: cells
 colored by sample, (B) Comparison DEGs between cluster 9 and 11. Wilcoxon signed-rank test was conducted to identify differentially expressed genes. High
                                                                                                                                                           (Continued)

Frontiers in Dental Medicine | www.frontiersin.org                                6                                            August 2021 | Volume 2 | Article 679937
Nagata et al. Single-Cell Analysis Reveals Markers of Periodontium
FIGURE 3 | expression: violet, Low expression: yellow, No expression: gray. (C) CellPhoneDB intercellular communication analysis. Split-dot-based visualization of
ligand-receptor interactions among cementoblast and other cell subsets. Top row: Pthlh-Pth1r, bottom row: Wnt7b-Fzd4 pairs. Columns: ligand-expressing (bottom)
and receptor- expressing (top) clusters. DEGs: differentially expressed genes, DF: dental follicle, DP: dental pulp, PDL: periodontal ligament.
CellPhoneDB, Intercellular Communication hematopoietic cells, endothelial cells, epithelial cells and other
Analysis cells (Supplementary Figure 1B). We subsequently focused on
To predict enriched ligand-receptor relationships between mesenchymal cell populations that highly expressed Postn
cementoblasts and other cell populations, we performed (Cluster 1–3, 5, 8, 14, 17, 19), by eliminating contaminating
CellPhoneDB analysis (15). CellPhoneDB v.2.0 was employed cells, and re-clustered these cells into 21 clusters (Figure 2B).
with default parameters. Interactions of Pthlh-Pth1r and Wnt7b- These clusters included cells expressing mCherry, eGFP and
Fzd4 were displayed in Figure 3C. tdTomato, wherein their expression patterns were consistent with
the distribution of these two datasets at two different time points
of P6 and P25 (Supplementary Figure 2). We manually defined
RESULTS
7 major cell populations, including DF cells expressing Bmp3
Fluorescent Transgenic Marking of PTHrP+ (16) and Spon1 (17) (Cluster 1, 3 and 5), PDL cells expressing
DF Cells and Col1a1+ Periodontal Cells Scx (18) and Postn (19) (Cluster 2), cementoblasts expressing
We first set out to define a fluorescent transgenic mouse Tubb3 (20) and Pthlh (encoding PTHrP) (2) (Cluster 9), DP
model that marks cells in the periodontium. We previously cells expressing Tac1 (5) (Cluster10), osteoblasts expressing Phex
reported an scRNA-seq dataset of PTHrP-mCherry+ DF cells (21) and Ifitm5 (22) (Cluster 4, 8 and 11), fibroblasts expressing
at P6 [GSE120108] that were harvested from PTHrP-mCherry S100a4 (23) (Cluster 7 and 12), marrow stromal cells expressing
knock-in mice using fluorescence activated cell sorting (FACS) Ebf3 (24) (Cluster 17) (Figure 2B, Supplementary Figure 2).
(2). Histologically, PTHrP-mCherry+ cells were predominantly Interestingly, cells in cluster 0 and 6 exhibited transitional
found in the DF surrounding the developing tooth at P6 states between PDL cells and osteoblasts. Subsequently, we
(Figures 1a,b). Subsequently, we analyzed Col1a1(2.3kb)-GFP; validated some of the identified marker genes in vivo. As
PTHrP-creER; R26R-tdTomato mice at P25 [GSE168450], which expected, Foxf1 was expressed by DF cells, Scx-GFP was
were treated with tamoxifen at P3, when the tooth root begins expressed by PDL cells, and DMP1 was expressed in the
to develop. In these compound transgenic mice, cells with 2.3kb alveolar cryptal bone osteoblasts (Supplementary Figures 3a–c).
Col1a1 promoter activities express GFP, whereas descendants Therefore, these scRNA-seq analyses reveal cellular heterogeneity
of PTHrP+ DF cells at P3 express tdTomato. At P25, when of Col1a1+ cells in the periodontium, and their relationships with
formation of the tooth root and the periodontium was complete, PTHrP+ DF cells.
Col1a1-GFP was broadly expressed by cells in the periodontium,
including those in the dentin, the cementum on the root Computational Analysis of RNA Velocity
surface, PDL, and the alveolar cryptal bone (Figures 1c,d). As and Intercellular Communications Among
we reported previously, tdTomato+ cells were localized at the Periodontal Cellular Subsets
acellular cementum, PDL and the alveolar cryptal bone; and To identify the developmental relationships among cells in the
a majority of tdTomato+ cells were also positive for Col1a1- periodontium, PTHrP+ DF cells and their descendants, we
GFP. Therefore, Col1a1-GFP marks diverse array of cells in the subsequently analyzed the integrated dataset with RNA velocity,
periodontium, including descendants of PTHrP+ DF cells. which is a computational approach that infers whether genes are
actively being up- or down-regulated in individual cells based on
scRNA-seq Analysis Reveals Fundamental the ratio of spliced to unspliced transcripts (13, 14). This analysis
Cellular Heterogeneity of the Mouse predicts the routes by which cell populations develop into each
Periodontium other. RNA velocity analysis predicted three putative points of
Next, we set out to define cellular heterogeneity of Col1a1- origins, including the two major subgroups of DF cells, DF1
GFP+ cells in the periodontium and their developmental and DF2, and Scx+ PDL cells (Figure 3A). DF1 and DF2 cells
relationships with PTHrP+ DF cells using integrative scRNA- developed into osteoblasts through transitional cell populations,
seq analyses. For this purpose, we isolated Col1a1-GFP+ cells by reflecting the expected differentiation cascade during formation
FACS-sorting from the periodontium of mandibular molars of of the periodontium (Figure 3A). In addition, Scx+ PDL cells
Col1a1(2.3kb)-GFP; PTHrP-creER; R26R-tdTomato at P25 after also developed into osteoblasts and marrow stromal cells through
a tamoxifen pulse at P3 (Supplementary Figure 1A). Total of transitional cell populations, indicating that Scx+ PDL cells may
4,578 cells were profiled by the 10X Chromium Single-Cell Gene contain a population of mesenchymal stem cells.
Expression Solution platform. Subsequently, this P25 Col1a1- We also found another major DF cell population, DF3, which
GFP+ periodontal dataset was integrated with the previously was not closely related to other periodontal cell populations,
published PTHrP+ DF dataset using LIGER (Figure 2A) (10). indicating this subset of PTHrP+ DF cells might not contribute
We discovered 24 clusters (Cluster 0–23) among total of 8,630 to development of periodontium. Interestingly, a group of
cells, which included mesenchymal cells as well as contaminating PTHrP+ DF cells overlapped extensively with a group of P25
Frontiers in Dental Medicine | www.frontiersin.org 7 August 2021 | Volume 2 | Article 679937Nagata et al. Single-Cell Analysis Reveals Markers of Periodontium
Col1a1+ cells (Cementoblast/DF); these cells simultaneously alveolar cryptal bone (Figures 4a–c). We further examined β3-
expressed mature osteoblast markers Ifitm5 and Dmp1 and tublin (TUBB3) expression in PTHrP-mCherry+ cementoblasts
cementoblast markers Tubb3 and Pthlh. These cementoblasts using immunohistochemistry. TUBB3 was expressed in a similar
did not interconvert with other cell populations, indicating that pattern with PTHrP-mCherry, while Oc-GFP was more restricted
cementoblasts diverge from other PTHrP+ DF cells early during to the cementoblast layer (Figures 4d,e). In addition, while
formation of the periodontium. PTHrP-mCherry was specifically expressed by cementoblasts,
We further capitalized on this integrated dataset and TUBB3 was also expressed by odontoblasts and the neural bundle
defined a cementoblast-specific “metagene”, some of which may in the PDL space. These findings indicate that PTHrP can serve
serve as cementoblast-specific marker genes. The cementum as a novel specific marker of cementoblasts.
and the bone are similar mineralized tissues; however, the
cementum has its unique anatomical feature and functionality
(25). Currently, no specific marker gene is available to DISCUSSION
distinguish cementoblasts from osteoblasts (8, 9). To identify
cementoblast-specific markers, we analyzed the top 20 genes Taken together, our findings provide insights into the
that are differentially expressed in cementoblasts (Cluster 9) lineage hierarchy and intercellular interactions of cells in
or mature osteoblasts (Cluster 11) (Supplementary Figure 4). the periodontium at a single-cell level, aiding to understand
We confirmed that several previously reported cementoblast cellular and molecular basis of periodontal tissue formation.
markers, such as Wif1 (9) and Tubb3 (20), were enriched Single-cell RNA-sequencing analysis is a powerful approach to
in cluster 9; we also confirmed that Pthlh (encoding PTHrP) unravel cellular heterogeneity of a target cell population, and has
was highly expressed in these cells. In contrast, Phex, Nfib been applied to dental cell types (2, 5). In this study, we revealed
and Pth1r were highly expressed in cluster 11 corresponding in-depth heterogeneity of cells in the periodontium and their
to mature osteoblasts (Figure 3B). We also confirmed that developmental relationships with PTHrP+ DF cells at a single-
the representative osteoblast marker genes, Ifitm5 and Dmp1, cell level, by integrative scRNA-seq analysis of fluorescently
were expressed in cells of both cluster 9 and 11, denoting isolated cells of interest. After eliminating contaminating cells
their fundamental characteristics as mineralizing cell types. such as hematopoietic, endothelial and epithelial cells from the
Therefore, these analyses successfully identified a panel of dataset, we found that PTHrP+ DF cells can be classified into
genes that could serve as novel specific marker metagene three subtypes in terms of their relationships with osteoblasts
for cementoblasts. and cementoblasts. Biological studies demonstrate that DF plays
We further analyzed the dataset with CellPhoneDB (15), a an important role for tooth eruption and tooth root formation
computational analysis that uses cell-type-specific expression of (2, 26). These results suggest that PTHrP+ DF cells are composed
annotated ligand-receptor gene pairs to quantify the evidence of distinct populations of precursor cells with pre-determined
for signaling interactions between cell types. We focused cell fates to osteoblasts and cementoblasts, which contribute
on the ligand-receptor pairs that involve cementoblasts, differentially to tooth root formation and tooth eruption. It is
particularly Pthlh (encoding PTHrP) and Wnt7b that interesting that PTHrP+ DF cells did not show a direct lineage
are abundantly expressed by cementoblasts. Pthlh-Pth1r contribution to Scx-expressing PDL cells in our dataset. PDL is a
interactions were evident across a broad range of cells, fibrous connective tissue that connects the tooth to the alveolar
including among cementoblasts and between cementoblasts bone and possesses the stem/progenitor cell populations for
and PDL cells, osteoblasts and marrow stromal cells periodontal wound healing and homeostasis (27–29). Scleraxis
(Figure 3C). In contrast, Wnt7b-Fzd4 interactions were (Scx) is a basic helix-loop-helix transcriptional factor that
only notable between cementoblasts and marrow stromal cells is abundantly expressed by tendons and ligaments (30), and
(Figure 3C). Therefore, these findings indicate that PTHrP also predominantly expressed in mature PDL fibroblasts and
secreted by cementoblasts interact with PTH/PTHrP receptor acts as a negative regulator of PDL mineralization (18). Based
expressed by cementoblasts and their surrounding cells, on RNA velocity analysis, Scx+ PDL cell population (Cluster
such as PDL cells and osteoblasts, both in an autocrine and 2) appears to provide a cellular origin for osteoblasts and
paracrine manner. other fibroblasts, indicating that Scx may serve as a marker of
periodontal ligament stem cells (PDLSCs). Men et al. recently
reported Gli1+ cells in periodontium function as PDLSCs
in vivo (31). Our computational analysis showed that Gli1 is
PTHrP Specifically Marks Cementoblasts, expressed by cells in DF, DP and transient state, but not in
but Not Alveolar Bone Osteoblasts cluster 2 (Supplementary Figure 2), suggesting Gli1+ cells may
Lastly, we set out to test the validity of the cementoblast-specific mark transitional mesenchymal precursors in PDL. However,
markers that we identified in our scRNA-seq analyses. First, we additional in vivo study will be needed to reveal the bona fide
examined the in vivo expression pattern of PTHrP using PTHrP- marker of PDLSC in vivo.
mCherry; Osteocalcin (Oc)-GFP mice. Osteocalcin (Oc)-GFP The cementum is a thin mineralized tissue that covers the
specifically labels cementoblasts and osteoblasts, but not PDL entire root surface, which is one of the three structures that
fibroblasts (9). At P21, PTHrP-mCherry was co-expressed by Oc- support the tooth in concert with the PDL and the alveolar
GFP+ cementoblasts, but not by Oc-GFP+ osteoblasts in the bone (25). Functional regeneration of the periodontium largely
Frontiers in Dental Medicine | www.frontiersin.org 8 August 2021 | Volume 2 | Article 679937Nagata et al. Single-Cell Analysis Reveals Markers of Periodontium FIGURE 4 | PTHrP is expressed by cementoblasts, but not osteoblasts. (a–e) Mandibular molars of Osteocalcin(Oc)-GFP;PTHrPmCherry . C: cementoblast, PDL: periodontal ligament, AB: alveolar bone, Nv: nerve, D: dentin, Od: odontoblast. Arrow: PTHrP-mCherry+ Oc-GFP + cementoblasts, *: Oc-GFP+ osteoblasts. Scale bars: 200 µm (a,d), 50 µm (b,c,e). depends on the regenerative potential of the cementum on the Scx+ PDL cells to osteoblasts, whereas cementoblasts appeared root surface; however, mechanisms of cementum development to constitute their own “mini-lineage” without interconverting are largely unknown (8). Importantly, our RNA velocity with other cell types, indicating precursor cells for cementoblasts analysis clearly predicted different routes for cementoblasts have distinct characteristics from those of osteoblasts. Recently, and osteoblasts. More specifically, we observed a continuous Zhao et al. also reported the single-cell computational analysis of predicted lineage hierarchy from PTHrP+ DF cell subsets or mesenchymal cell populations in the periodontium, and showed Frontiers in Dental Medicine | www.frontiersin.org 9 August 2021 | Volume 2 | Article 679937
Nagata et al. Single-Cell Analysis Reveals Markers of Periodontium
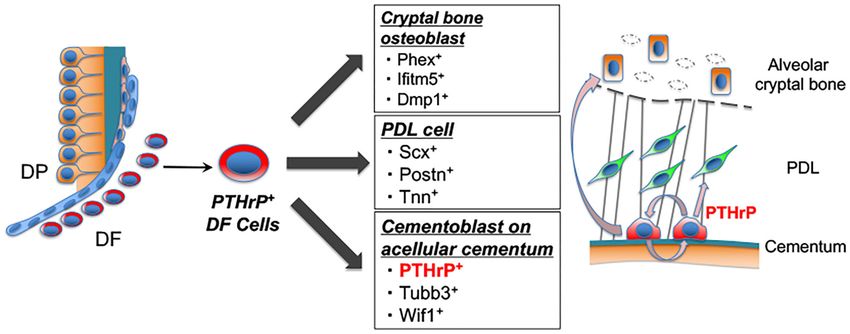
FIGURE 5 | PTHrP+ DF cells contribute to attachment apparatus formation and PTHrP is a specific marker for cementoblast. Shown is the concluding diagram of this
study. PTHrP+ DF cells give rise to osteoblasts, PDL cells, cementoblasts. After attachment apparatus formation, PTHrP is specifically expressed in cementoblasts.
Our computational analysis suggests that PTHrP secreted from cementoblasts is important for cementogenesis via PTH/PTHrP receptor signaling.
that CD90+ cells could differentiate into cementoblasts (32). In (Figures 4d,e). These findings indicate that PTHrP can serve as a
contrast, our computational analysis did not detect upregulation bona fide marker for cementoblasts that allows us to distinguish
of Axin2 or Thy1 (encoding CD90) in cementoblasts. Moreover, cementoblasts from alveolar bone osteoblasts, while serving as an
Zhao et al. predicted that cementoblast/osteoblast clusters appear important regulator of cementogenesis (Figure 5).
to contain less terminally differentiated cells as compared to In conclusion, our integrative scRNA-seq analyses provide
the mesenchymal cells expressing Postn, whereas our analysis insights into the lineage hierarchy and intercellular interactions
demonstrated that osteoblasts present as terminally differentiated of cells in the periodontium at a single-cell level, aiding to
cell populations. One possible reason for this discrepancy may understand cellular and molecular basis of periodontal tissue
be related to the difference in the experimental design. Zhao et formation. This knowledge may provide an important platform
al. isolated bulk periodontal cells from CD-1 mice after tooth to understand the mechanism of periodontal tissue development,
root formation prior to profiling. In contrast, we isolated Col1a1- and will be instrumental for effective stem-cell based regenerative
GFP+ periodontal cells by FACS-sorting prior to single-cell therapies in the future.
transcriptomic analysis, and further integrated the dataset with
that of PTHrP-mCherry+ DF cells. Further studies are needed to
define the lineage hierarchy of cells in the periodontium in a more DATA AVAILABILITY STATEMENT
definitive manner.
PTHrP is a locally acting autocrine/paracrine ligand, and The datasets presented in this study can be found in online
plays an important role in the formation of skeletal tissues repositories. The names of the repository/repositories
via signaling by its receptor, PTH/PTHrP receptor (33). In and accession number(s) can be found in the
postnatal growth plates, the resting zone harbors PTHrP+ article/Supplementary Material.
skeletal stem cells that maintain the integrity of the growth
plate (11). In tooth development, PTHrP is abundantly expressed
in DF surrounding the developing tooth. We found that
ETHICS STATEMENT
PTHrP is expressed in cementoblasts on the entire root surface The animal study was reviewed and approved by University
after tooth root formation. It has been reported that PTHrP of Michigan’s Institutional Animal Care and Use Committee
regulates cementogenesis by repressing mRNA expression of (IACUC), protocol 8944 and 9496 (Ono).
bone sialoprotein (Bsp) and Oc in vitro (34). Indeed, our
CellPhoneDB analysis predicted that PTHrP secreted from
cementoblasts interacts with PTH/PTHrP receptor expressed AUTHOR CONTRIBUTIONS
by diversity of other cell populations, whereas Wnt7b secreted
from cementoblasts interacts with Fzd4, a receptor of Wnt MN, NO, and WO study design & performance, data collection,
ligand, specifically on marrow stromal cells. Moreover, PTHrP analysis & interpretation, and drafting manuscript. NO and
is specifically expressed in cementoblasts, whereas TUBB3 is WO revising manuscript content. AC and JW single-cell
expressed not only in cementoblasts but also in the terminal computational analysis. All authors gave the final approval and
nerve in the PDL space and odontoblasts of the radicular dentin agreed to be accountable for all aspects of the work.
Frontiers in Dental Medicine | www.frontiersin.org 10 August 2021 | Volume 2 | Article 679937Nagata et al. Single-Cell Analysis Reveals Markers of Periodontium
FUNDING for Col1a1-GFP+ cells (purple box), cells isolated from molars of
Col1a1(2.3kb)-GFP; PTHrP-creER; R26R-tdTomato at P25 for scRNA-seq. (B)
This work was supported by National Institutes of Health Grants UMAP-based visualization of major classes of FACS-sorted cells. Feature plots of
cell-type specific markers. High expression: violet, Low expression: yellow, No
R01DE029181 (to WO), R01DE026666 (to NO), R01DE030630
expression: gray. n = 8,630 cells from two datasets, 4,052 PTHrP-mCherry+ cells
(to NO, WO, and JW), and R01HG010883 (to JW). and 4,578 Col1a1-GFP+ cells.
Supplementary Figure 2 | scRNA-seq analysis of PTHrP-mCherry+ DF cells and
ACKNOWLEDGMENTS Col1a1-GFP+ periodontal mesenchymal lineage cells after re-clustering.
UMAP-based visualization of major classes of FACS-sorted cells after re-clustering
in mesenchymal lineage cells. Feature plots of cell-type specific markers. High
We would like to thank M. Pihalja and K. Saiya-Cork (University
expression: violet, Low expression: yellow, No expression: gray.
of Michigan Flow Cytometry Core) for flow cytometry technical
Supplementary Figure 3 | In vivo validation of the expression of selected marker
assistance in this study.
genes in unbiasedly identified populations. (a) DF: RNAscope in situ hybridization
(brown) of Foxf1 of the mandibular molars at P3 for DF. (b) PDL: The mandibular
molars of Scx-GFP mice at P25. (c) Immunofluorescence of DMP1 of the
SUPPLEMENTARY MATERIAL mandibular molars at P25 for osteoblasts. DF: dental follicle, DP: dental pulp,
HERS: Hertwig’s epithelial root sheath, PDL: periodontal ligament, C: cementum,
The Supplementary Material for this article can be found AB: alveolar bone. Scale bars: 200 µm (a–c), 50 µm (a’-c’, c”).
online at: https://www.frontiersin.org/articles/10.3389/fdmed.
Supplementary Figure 4 | Gene expression of cementoblast and osteoblast.
2021.679937/full#supplementary-material UMAP-based visualization of top 20 genes in cementoblast (Cluster 9) and
Supplementary Figure 1 | scRNA-seq analysis of PTHrP-mCherry+ DF cells and osteoblast (Cluster 11). Feature plots of cell-type specific markers. High
Col1a1-GFP+ periodontal mesenchymal lineage cells. (A) FACS-sorting strategy expression: violet, Low expression: yellow, No expression: gray.
REFERENCES 13. La Manno G, Soldatov R, Zeisel A, Braun E, Hochgerner H,
Petukhov V, et al. RNA velocity of single cells. Nature. (2018)
1. Ten Cate AR. The development of the periodontium–a largely 560:494–8. doi: 10.1038/s41586-018-0414-6
ectomesenchymally derived unit. Periodontol 2000. (1997) 14. Bergen V, Lange M, Peidli S, Wolf FA, Theis FJ. Generalizing
13:9–19. doi: 10.1111/j.1600-0757.1997.tb00093.x RNA velocity to transient cell states through dynamical modeling.
2. Takahashi A, Nagata M, Gupta A, Matsushita Y, Yamaguchi T, Mizuhashi Nat Biotechnol. (2020) 38:1408–14. doi: 10.1038/s41587-020-0
K, et al. Autocrine regulation of mesenchymal progenitor cell fates 591-3
orchestrates tooth eruption. Proc Natl Acad Sci USA. (2019) 116:575– 15. Efremova M, Vento-Tormo M, Teichmann SA, Vento-Tormo R.
80. doi: 10.1073/pnas.1810200115 CellPhoneDB: inferring cell-cell communication from combined
3. Nagata M, Ono N, Ono W. Mesenchymal progenitor regulation of expression of multi-subunit ligand-receptor complexes. Nat Protoc. (2020)
tooth eruption: a view from PTHrP. J Dent Res. (2020) 99:133– 15:1484–506. doi: 10.1038/s41596-020-0292-x
42. doi: 10.1177/0022034519882692 16. Aberg T, Wozney J, Thesleff I. Expression patterns of bone
4. Tokavanich N, Gupta A, Nagata M, Takahashi A, Matsushita Y, Yatabe M, et morphogenetic proteins (Bmps) in the developing mouse tooth suggest
al. A three-dimensional analysis of primary failure of eruption in humans and roles in morphogenesis and cell differentiation. Dev Dyn. (1997)
mice. Oral Dis. (2020) 26:391–400. doi: 10.1111/odi.13249 210:383–96. doi: 10.1002/(SICI)1097-0177(199712)210:43.0.CO;2-C
AN, Petersen J, et al. Dental cell type atlas reveals stem and 17. Nishida E, Sasaki T, Ishikawa SK, Kosaka K, Aino M, Noguchi T, et al.
differentiated cell types in mouse and human teeth. Nat Commun. (2020) Transcriptome database KK-Periome for periodontal ligament development:
11:4816. doi: 10.1038/s41467-020-18512-7 expression profiles of the extracellular matrix genes. Gene. (2007) 404:70–
6. Chiba Y, Saito K, Martin D, Boger ET, Rhodes C, Yoshizaki K, et al. Single- 9. doi: 10.1016/j.gene.2007.09.009
cell RNA-sequencing from mouse incisor reveals dental epithelial cell-type 18. Takimoto A, Kawatsu M, Yoshimoto Y, Kawamoto T, Seiryu M, Takano-
specific genes. Front Cell Dev Biol. (2020) 8:841. doi: 10.3389/fcell.2020.00841 Yamamoto T, et al. Scleraxis and osterix antagonistically regulate tensile
7. Jones KB, Furukawa S, Marangoni P, Ma H, Pinkard H, D’Urso R, et al. force-responsive remodeling of the periodontal ligament and alveolar bone.
Quantitative clonal analysis and single-cell transcriptomics reveal division Development. (2015) 142:787–96. doi: 10.1242/dev.116228
kinetics, hierarchy, and fate of oral epithelial progenitor cells. Cell Stem Cell. 19. Kruzynska-Frejtag A, Wang J, Maeda M, Rogers R, Krug E, Hoffman
(2019) 24:183–92.e8. doi: 10.1016/j.stem.2018.10.015 S, et al. Periostin is expressed within the developing teeth at the
8. Bosshardt DD. Are cementoblasts a subpopulation of osteoblasts or a unique sites of epithelial-mesenchymal interaction. Dev Dyn. (2004) 229:857–
phenotype? J Dent Res. (2005) 84:390–406. doi: 10.1177/154405910508400501 68. doi: 10.1002/dvdy.10453
9. Matthews BG, Roguljic H, Franceschetti T, Roeder E, Matic I, Vidovic I, et al. 20. Oshima S YY. Class III β-tubulin expression during hard tissue
Gene-expression analysis of cementoblasts and osteoblasts. J Periodontal Res. formation in developing mouse teeth. Pediatric Dental J. (2020)
(2016) 51:304–12. doi: 10.1111/jre.12309 30:9–16. doi: 10.1016/j.pdj.2019.12.002
10. Welch JD, Kozareva V, Ferreira A, Vanderburg C, Martin C, Macosko EZ, et 21. Thompson DL, Sabbagh Y, Tenenhouse HS, Roche PC, Drezner MK, Salisbury
al. Single-cell multi-omic integration compares and contrasts features of brain JL, et al. Ontogeny of Phex/PHEX protein expression in mouse embryo
cell identity. Cell. (2019) 177:1873–87. doi: 10.1016/j.cell.2019.05.006 and subcellular localization in osteoblasts. J Bone Miner Res. (2002) 17:311–
11. Mizuhashi K, Ono W, Matsushita Y, Sakagami N, Takahashi A, Saunders 20. doi: 10.1359/jbmr.2002.17.2.311
TL, et al. Resting zone of the growth plate houses a unique class of 22. Moffatt P, Gaumond MH, Salois P, Sellin K, Bessette MC, Godin
skeletal stem cells. Nature. (2018) 563:254–8. doi: 10.1038/s41586-018- E, et al. Bril: a novel bone-specific modulator of mineralization.
0662-5 J Bone Miner Res. (2008) 23:1497–508. doi: 10.1359/jbmr.08
12. Liu J, Gao C, Sodicoff J, Kozareva V, Macosko EZ, Welch JD. 0412
Jointly defining cell types from multiple single-cell datasets using 23. Strutz F, Okada H, Lo CW, Danoff T, Carone RL, Tomaszewski JE, et al.
LIGER. Nat Protoc. (2020) 15:3632–62. doi: 10.1038/s41596-020- Identification and characterization of a fibroblast marker: FSP1. J Cell Biol.
0391-8 (1995) 130:393–405. doi: 10.1083/jcb.130.2.393
Frontiers in Dental Medicine | www.frontiersin.org 11 August 2021 | Volume 2 | Article 679937Nagata et al. Single-Cell Analysis Reveals Markers of Periodontium
24. Seike M, Omatsu Y, Watanabe H, Kondoh G, Nagasawa T. Stem cell niche- and periodontitis. Stem Cells. (2021) 39:92–102. doi: 10.1002/
specific Ebf3 maintains the bone marrow cavity. Genes Dev. (2018) 32:359– stem.3288
72. doi: 10.1101/gad.311068.117 33. Kronenberg HM. PTHrP and skeletal development. Ann N Y Acad Sci. (2006)
25. Bosshardt DD, Selvig KA. Dental cementum: the dynamic 1068:1–13. doi: 10.1196/annals.1346.002
tissue covering of the root. Periodontol 2000. (1997) 13:41– 34. Ouyang H, McCauley LK, Berry JE, Saygin NE, Tokiyasu Y,
75. doi: 10.1111/j.1600-0757.1997.tb00095.x Somerman MJ. Parathyroid hormone-related protein regulates
26. Cahill DR, Jr. Marks SC. Tooth eruption: evidence for the extracellular matrix gene expression in cementoblasts and inhibits
central role of the dental follicle. J Oral Pathol. (1980) 9:189– cementoblast-mediated mineralization in vitro. J Bone Miner Res. (2000)
200. doi: 10.1111/j.1600-0714.1980.tb00377.x 15:2140–53. doi: 10.1359/jbmr.2000.15.11.2140
27. Seo BM, Miura M, Gronthos S, Bartold PM, Batouli S, Brahim J, et al.
Investigation of multipotent postnatal stem cells from human periodontal Conflict of Interest: The authors declare that the research was conducted in the
ligament. Lancet. (2004) 364:149–55. doi: 10.1016/S0140-6736(04)16627-0 absence of any commercial or financial relationships that could be construed as a
28. Melcher AH. On the repair potential of periodontal tissues. J Periodontol. potential conflict of interest.
(1976) 47:256–60. doi: 10.1902/jop.1976.47.5.256
29. Nagata M, Iwasaki K, Akazawa K, Komaki M, Yokoyama N, Izumi
Publisher’s Note: All claims expressed in this article are solely those of the authors
Y, et al. Conditioned medium from periodontal ligament stem cells
enhances periodontal regeneration. Tissue Eng Part A. (2017) 23:367– and do not necessarily represent those of their affiliated organizations, or those of
77. doi: 10.1089/ten.tea.2016.0274 the publisher, the editors and the reviewers. Any product that may be evaluated in
30. Schweitzer R, Chyung JH, Murtaugh LC, Brent AE, Rosen V, this article, or claim that may be made by its manufacturer, is not guaranteed or
Olson EN, et al. Analysis of the tendon cell fate using Scleraxis, endorsed by the publisher.
a specific marker for tendons and ligaments. Development. (2001)
128:3855–66. doi: 10.1242/dev.128.19.3855 Copyright © 2021 Nagata, Chu, Ono, Welch and Ono. This is an open-access article
31. Men Y, Wang Y, Yi Y, Jing D, Luo W, Shen B, et al. Gli1+ distributed under the terms of the Creative Commons Attribution License (CC BY).
Periodontium stem cells are regulated by osteocytes and occlusal The use, distribution or reproduction in other forums is permitted, provided the
force. Dev Cell. (2020) 54:639–54.e6. doi: 10.1016/j.devcel.2020. original author(s) and the copyright owner(s) are credited and that the original
06.006 publication in this journal is cited, in accordance with accepted academic practice.
32. Zhao J, Faure L, Adameyko I, Sharpe PT. Stem cell contributions No use, distribution or reproduction is permitted which does not comply with these
to cementoblast differentiation in healthy periodontal ligament terms.
Frontiers in Dental Medicine | www.frontiersin.org 12 August 2021 | Volume 2 | Article 679937You can also read