Ship-Source Noise Modeling from 2015-2018 in the Kitikmeot Region and Lancaster Sound (Northwest Passage), Nunavut
←
→
Page content transcription
If your browser does not render page correctly, please read the page content below
Ship-Source Noise Modeling from 2015-2018 in
 the Kitikmeot Region and Lancaster Sound
 (Northwest Passage), Nunavut

 Photo Credit: Annika Ogilvie

Map Credit: William D. Halliday

 Prepared for the Nunavut General Monitoring Program
 March 2021
 Dr. William D. Halliday and Dr. Jackie Dawson

 i
RECOMMENDED CITATION

Halliday, W.D., and Dawson, J. (2021). Ship-Source Noise Modeling from 2015-2018 in the
Kitikmeot Region and Lancaster Sound (Northwest Passage), Nunavut. DOI: 10.20381/1yjdx-
yy69

NOTICES

This report reflects the views of the authors and not necessarily those of the Nunavut General
Monitoring Program. Intellectual Property of project results remain with the authors.

ACKNOWLEDGEMENTS

Thank you to A. Nicoll and Z. Kochanowicz for processing and preparing the ship tracks for this
analysis, and to M. Pine for assisting with noise propagation modeling. Vessel source levels were
provided by the ECHO program’s Underwater Listening Station project, which was sponsored by
Vancouver Fraser Port Authority, JASCO Applied Sciences, Ocean Networks Canada, and the
Government of Canada. Satellite AIS data were provided by exactEarth Ltd. (2019), and processed
courtesy of the MEOPAR (Marine Environmental Observation Prediction and Response) network.
Databases used for the analyses performed for the project have been supported by many grants and
organizations including: Canada Research Chairs Program, ArcticNet, MEOPAR, Irving
Shipbuilding, Clear Seas, Transport Canada, NSERC, SSHRC, University of Ottawa, and Canada
Foundation for Innovation. The main portion of the work was supported by the Nunavut General
Monitoring Plan.

PROJECT TEAM CONTRIBUTIONS

Dr. William D. Halliday, Associate Conservation Scientist, Wildlife Conservation Society Canada
and Adjunct Professor, School of Earth and Ocean Sciences, University of Victoria – conducted
the analysis and drafted the report.

Dr. Jackie Dawson, Associate Professor, University of Ottawa – project PI, advised on analysis
area, edited and contributed to report.

FUNDING PROVIDED BY

 ii
EXECUTIVE SUMMARY
Ship traffic has been increasing in the Canadian Arctic, and with it, underwater noise. Underwater
noise from ships is known to cause a number of impacts on marine animals, and is therefore an
important concern in the Arctic. This report is part of a larger study funded by the Nunavut General
Monitoring Plan. In the report, we examine ship traffic in the Kitikmeot Region and Lancaster
Sound, Nunavut (Northwest Passage – southern route), and model the noise levels caused by all
of the ship traffic between 2015 and 2018. Ship noise peaks in August and September of every
year analysed. Modeled ship noise was highest within Eclipse Sound due to the large volume of
traffic within that area, but was also high south of Victoria Island in Dease Strait where ships are
spatially constricted to following a relatively narrow route. Future work should be carried out to
validate these modeling results with acoustic measurements in different parts of this region. Future
work should also examine the overlap between ship noise and various marine animals, such as
narwhal and beluga, to estimate the exposure of these animals to ship noise.

 iii
ᐅᒥᐊᕐᔪᐊᒃᑯᑦ ᐃᖏᕐᕋᔪᑦ ᐊᒥᓱᕈᖅᐸᓪᓕᐊᒻᒪᑕ ᑲᓇᑕᑉ ᐅᑭᐅᖅᑕᖅᑐᖓᓂ, ᑕᐃᒪᐃᑦᑎᓪᓗᒋᓪᓗ, ᓂᐱᖃᕐᓂᖅᓴᐅᕙᓕᖅᑐᓂ
ᐃᖅᑲᒃᑯᑦ. ᐃᖅᑲᒥ ᓂᐱᖏᑦ ᐅᒥᐊᕐᔪᐊᕐᓃᙶᖅᑐᑦ ᐃᒪᕐᒥᐅᑕᑦ ᐆᒪᔪᖏᖕᓂ ᐊᑦᑐᐃᓂᖃᓲᖑᖕᒪᑕ, ᐊᒻᒪᓗ ᑕᐃᒪᐃᒻᒪᑦ
ᐱᒻᒪᕆᐅᔪᒃᑯᑦ ᐃᓱᒫᓘᑎᒋᔭᐅᕗᖅ ᐅᑭᐅᖅᑕᖅᑐᒥ. ᑖᓐᓇ ᐅᓂᒃᑳᖅ ᐃᓚᒋᔭᐅᕗᖅ ᐊᖏᓂᖅᓴᒥᒃ ᖃᐅᔨᓴᖅᑕᒥᓂᐅᔪᒧᑦ
ᑮᓇᐅᔭᖃᖅᑎᑕᐅᔪᖅ ᓄᓇᕗᒻᒥ ᑕᒪᐃᓐᓄᑦ ᐅᐊᑦᑎᓂᕐᒧᑦ ᐸᕐᓇᐅᑎᖓᓂᒃ. ᐅᓂᒃᑳᕐᒥ, ᖃᐅᔨᓴᖅᐳᒍᑦ ᐅᒥᐊᕐᔪᐊᒃᑯᑦ
ᐃᖏᕐᕋᖃᑦᑕᕐᓂᖏᑦ ᕿᑎᕐᒥᐅᒥ ᐊᒻᒪᓗ ᑕᓪᓗᕈᑎᑉ ᐃᒪᖓᓂ, ᓄᓇᕗ (ᐅᑭᐅᖅᑕᖅᑑᑉ ᓱᓪᓗᐊᓗᐊ − ᓂᒋᖅᐸᓯᖓᒍᑦ
ᐊᖅᑯᑎᖓ), ᐊᒻᒪᓗ ᑖᒃᑯᐊ ᓂᐱᖏᑕ ᓴᙱᓂᖏᑦ ᐋᖅᑭᓱᖅᑕᐅᓗᑎᑦ ᖃᓄᑎᒋ ᓂᐱᖃᕐᒪᖔᑕ ᑕᒪᐃᓐᓂ ᐅᒥᐊᕐᔪᐊᒃᑯᑦ
ᐃᖏᕐᕋᕙᑦᑐᒥᓃᑦ 2015 ᐊᒻᒪᓗ 2018 ᐊᑯᕐᖓᖓᓂ. ᐅᒥᐊᕐᔪᐊᒃᑯᑦ ᓂᐱᖃᕐᓂᖅᓴᐅᓕᓲᖅ ᐋᒡᒌᓯᒥ ᐊᒻᒪᓗ ᓯᑏᕝᕙ
ᓂᐊᕐᕌᒍᑕᒫᑦ ᖃᐅᔨᓴᖅᑕᒥᓂᐅᔪᑦ ᒪᓕᑦᑐᒋᑦ. ᐆᑦᑐᕋᖅᑕᐅᓯᒪᔪᑦ ᐋᖅᑭᓱᖅᑕᐅᓯᒪᓪᓗᑎᑦ ᐅᒥᐊᕐᔪᐊᕐᒦᙶᖅᑐᑦ ᓂᐱᖏᑦ
ᖁᑦᑎᓂᖅᐹᖑᓯᒪᕗᖅ ᑕᓯᐅᔭᕐᒥ ᐊᒥᓲᓂᖏᖕᓄᑦ ᐅᒥᐊᕐᔪᐊᑦ ᐃᖏᕐᕋᔪᑦ ᑕᐅᕘᓇ, ᑭᓯᐊᓂᓗ ᖁᑦᑎᓛᖑᓯᒪᒋᕗᑦ ᓂᒋᐊᓂ
ᐃᖃᓗᒃᑑᑦᓯᐊᑉ ᕿᑭᖅᑕᓂᖓᑕ ᐅᒥᐊᕐᔪᐊᑦ ᐊᑕᐅᑦᑎᒨᕐᓂᖅᓴᐅᓲᖑᓪᓗᑎᑦ ᑐᐊᓗᐊᕐᓂᖓᓄᑦ ᐊᖅᑯᑎᖓ. ᓯᕗᓂᒃᓴᒥ
ᐃᖅᑲᓇᐃᔮᕆᔭᐅᔭᕆᐊᓖᑦ ᑕᒪᒃᑯᐊ ᐋᖅᑭᓱᖅᑕᐅᓯᒪᙳᐊᖅᑐᑦ ᓇᓗᓇᐃᖅᑕᐅᖁᓪᓗᒋᑦ ᖃᐅᔨᓴᖅᑕᒥᓃᑦ ᖃᓄᑎᒋ
ᓂᐱᖃᖅᑎᒋᒻᒪᖔᑕ ᐊᔾᔨᒌᙱᑦᑐᓂᑦ ᐊᕕᑦᑐᖅᓯᒪᔪᓂ. ᓯᕗᓂᒃᓴᒥᓗ ᐃᖅᑲᓇᐃᔮᕆᔭᐅᔭᕆᐊᖃᕆᕗᑦ
ᖃᐅᔨᓴᕈᓐᓇᕋᔭᖅᑐᑎᑦ ᐅᒥᐊᕐᔪᐊᒦᙶᖅᑐᑦ ᓂᐱᖏᑦ ᐊᒻᒪᓗ ᐊᔾᔨᒌᙱᑦᑐᑦ ᐃᒪᕐᒥᐅᑕᐃᑦ ᐆᒪᔪᐃᑦ, ᓲᕐᓗᒃ ᑐᒑᓖᑦ ᐊᒻᒪᓗ
ᕿᓚᓗᒐᐃᑦ, ᓇᓚᐅᑦᑖᖅᑕᐅᖁᓪᓗᒋᑦ ᑕᒪᒃᑯᐊ ᐆᒪᔪᑦ ᐅᒥᐊᕐᔪᐊᑉ ᓂᐱᖏᖕᓄᑦ ᐊᑦᑐᖅᑕᐅᓂᖃᓲᖑᖕᒪᖔᑕ ᖃᓄᑎᒋ.

 iv
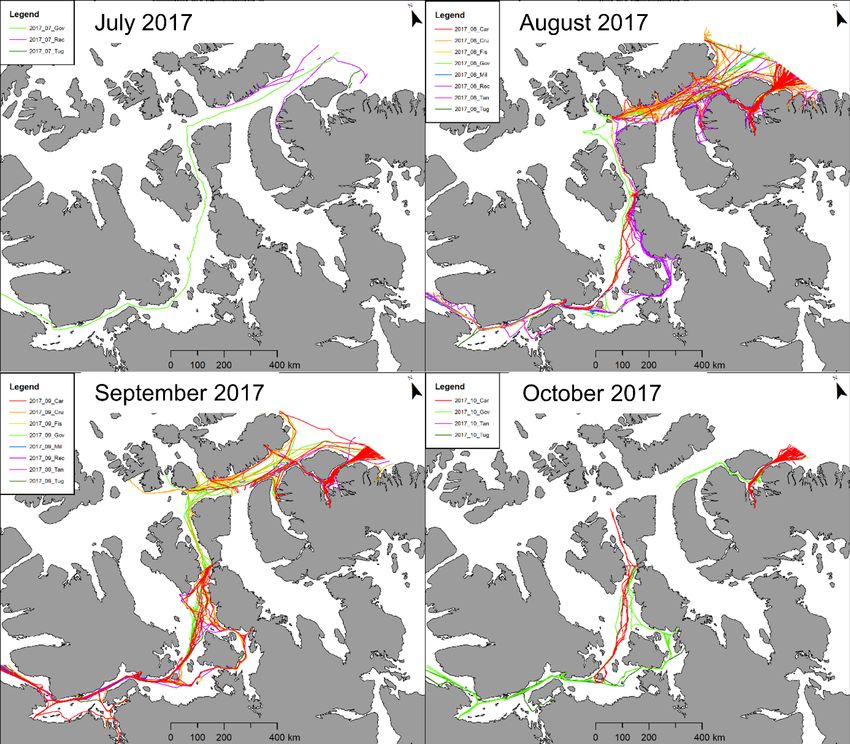
Table of Contents
EXECUTIVE SUMMARY .............................................................................................................. iii
List of Figures ............................................................................................................................ vi
1.0 Introduction ......................................................................................................................... 1
2.0 Methods ............................................................................................................................... 1
3.0 Results and Discussion ......................................................................................................... 2
 3.1 Trends in Ship Traffic .................................................................................................................... 2
 3.2 Modeled Underwater Noise ......................................................................................................... 9
4.0 Discussion ........................................................................................................................... 14
5.0 Future Work ....................................................................................................................... 14
5.0 References .......................................................................................................................... 16
Appendix - Detailed Methodology ........................................................................................... 18
 Estimating Propagation Loss ............................................................................................................ 18
 Monthly Ship Noise Footprints ......................................................................................................... 19

 v
LIST OF FIGURES
Figure 1. Ship tracks (satellite automatic identification system) in the Kitikmeot Region and
Lancaster Sound between July and October 2015, colour-coded by vessel category. ….…3
Figure 2. Ship tracks (satellite automatic identification system) in the Kitikmeot Region and
Lancaster Sound between July and October 2016, colour-coded by vessel category. ……4
Figure 3. Ship tracks (satellite automatic identification system) in the Kitikmeot Region and
Lancaster Sound between July and October 2017, colour-coded by vessel category ……5
Figure 4. Ship tracks (satellite automatic identification system) in the Kitikmeot Region and
Lancaster Sound between July and October 2018, colour-coded by vessel category. ……6
Figure 5. Total distance traveled by different vessel categories in the Kitikmeot Region and
Lancaster Sound between July and October 2015-2018. ……7
Figure 6. Total distance traveled by each vessel class within each month between July and October
In 2015-2018 within Dease Strait (top) and Eclipse Sound (bottom). ……8
Figure 7. Counts of the number of times that each 500 m cell in the study region exceeded 120 dB
in each month from July to October of 2015. ……10
Figure 8. Counts of the number of times that each 500 m cell in the study region exceeded 120 dB
in each month from July to October of 2016. ……11
Figure 9. Counts of the number of times that each 500 m cell in the study region exceeded 120 dB
in each month from July to October of 2017. ……12
Figure 10. Counts of the number of times that each 500 m cell in the study region exceeded 120
dB in each month from July to October of 2018. ……13
Figure 11. Total number of times per cell that the behavioural disturbance threshold was surpassed
in the Kitikmeot Region and Lancaster Sound between July and October 2015-2018. ……14
Figure 12. The total number of times per cell that the marine mammal behavioural disturbance
threshold was surpassed in each month between July and October of 2015-2018 in Dease Strait
and Eclipse Sound. ……14
Figure 13. Zones of propagation loss in the Kitikmeot Region and Lancaster Sound of Nunavut.
The propagation loss values are specific to bulk carriers. Different values were used for other
vessel classes, but the relative difference and delineation of the zones remains the same for all
vessel classes. ……20

 vi
1.0 INTRODUCTION
Nunavut waters attract the highest intensity of ship traffic compared to any other Canadian Arctic
regions (Dawson et al. 2018; Kochanowicz et al. 2020). Traffic volume in Nunavut doubled over
the past decade and further increases are expected given changes in climate, the allure of trade
through the Northwest Passage, the abundant fish and mining resources, and the growing
popularity of Arctic cruise tourism. The on-going and expected increases in shipping traffic in
Nunavut will create risks to the environment and to people and it has become increasingly urgent
to engage in monitoring activities that inform effective risk-mitigation decision-making for
shipping traffic risks in Nunavut. Underwater noise from ships is an important indicator of
shipping risk to monitor considering the potential impact of ship-source noise for marine mammals
and the cascading implications for subsistence hunting and ecosystem health. Compared to other
ocean regions globally, the Arctic has historically had low levels of ship traffic (Arctic Council,
2009; Dawson et al., 2018; Smith and Stephenson, 2013), and therefore lower levels of underwater
noise from ships (PAME, 2019). In fact, the Arctic has some of the lowest ambient noise levels in
the world under solid sea ice (Insley et al., 2017; PAME, 2019), making it prone to proportionately
large impacts caused by underwater noise from ships (Halliday et al., 2020).

Change is opening up the Arctic to increased ship traffic through the loss of summer sea ice
(Pizzolato et al., 2016) and it is vital that the associated increases in underwater water noise from
this increased ship traffic be quantified. However, there have been limited studies conducting
analysis of ship-source underwater noise in Arctic Canada or on the impact increased noise may
have for marine mammals, particularly in Nunavut. This three-year Nunavut General Monitoring
Plan project was established in direct response to the need to monitor shipping risks. The project
involves three major objectives including: 1) monitoring and analyzing risks to ships that are
changing because of altered sea and iceberg conditions as a result of climate change, 2) monitoring
and analyzing the risks from ships to marine mammals and to safe and sustainable subsistence
hunting activities, and 3) facilitation of Inuit and northern youth training workshops to be held in
communities where some of the greatest increases in ship traffic is occurring.

This report is related to objective 2 of the overall project by focusing specifically on understanding
the risk for ships to marine mammals from underwater noise. For this project, we modeled monthly
underwater noise from ship traffic in the Kitikmeot Region and Lancaster Sound (Tallurutiup
Imanga National Marine Conservation Area) between 2015 and 2018. The main goal of this
modeling work was to expand our understanding of the spatial and temporal extent of underwater
noise from ship traffic in these areas of Nunavut, providing information on hotspots for underwater
noise that deserve more focused attention.

2.0 METHODS
Here, we briefly describe the procedures for ship noise modeling. Full technical methodological
details can be viewed in the Appendix. The modeling methods involved three steps: 1) estimating
how sound propagates or travels through the water in different regions of the study area; 2)
modeling the “noise footprint” of individual vessels as they transited through the region; and 3)
compiling the noise footprints for every ship in each month and counting the number of times that
the behavioural disturbance threshold was surpassed.

 1
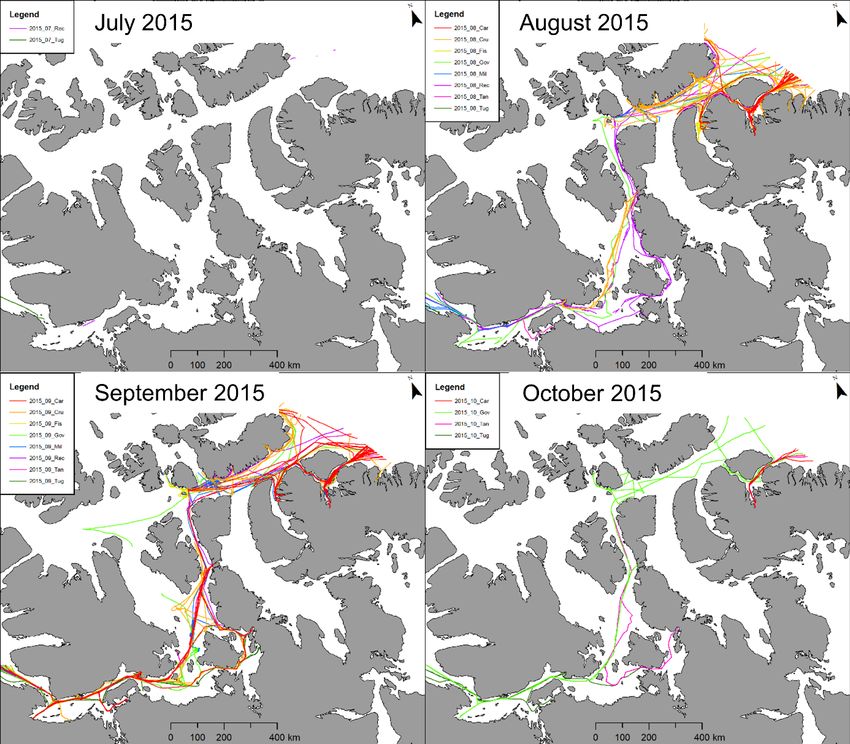
To estimate propagation loss, we used the software dBSea 2.0 to measure how sound travels
through the water in different areas of the study region. Effectively, areas with deep, open water
had further sound propagation compared to areas with shallower water or narrow channels. We
then split the study area into zones with different levels of propagation loss.
Following the estimation of propagation loss, vessel noise footprints were produced for each vessel
track for each ship within each month of each year from 2015 to 2018. Ships were only active
between mid July and mid October, so we focused on the four months between July and October.
We used satellite Automatic Identification System (AIS) data to derive ship tracks, and used a
standard geometric spreading equation, accounting for the propagation loss within different
regions, to estimate the spread of noise around each ship track for each ship within a month. We
then extracted the area of each noise footprint that surpassed the behavioural disturbance threshold
for marine mammals as defined by NOAA (National Marine Fisheries Service, 2016), which is
120 dB re 1 µPa. We combined all noise footprints for all ships within a month, and counted the
number of times that the behavioural disturbance threshold would be surpassed.

3.0 RESULTS AND DISCUSSION
3.1 Trends in Ship Traffic
Ship traffic is limited in the region in July, except for a few cargo ships, government vessels and
icebreakers, pleasure craft, tankers, and tugs that were variable between years (Figures 1-5). All
ships combined traveling in July traveled a maximum of 3,770 km in a given year, compared with
all other months in this study, where all ships combined traveled greater than 15,000 km per month
(Figure 5). August and September have much higher levels of traffic in all years, with September
being the peak month for every year except 2017, when it was in August. The unusual increase in
traffic observed in August 2017 seems to be driven by cruise ships and pleasure craft, which both
had higher distance traveled in August compared with September, as well as by cargo ship traffic
within Eclipse Sound. For the Kitikmeot Region in general, and Dease Strait specifically,
September is the peak month in every year, whereas for Eclipse Sound, August is the peak month
(Figure 6). Traffic then decreases in October, although not as low as in July, with ship tracks still
running mostly from east to west across the study area.

 2
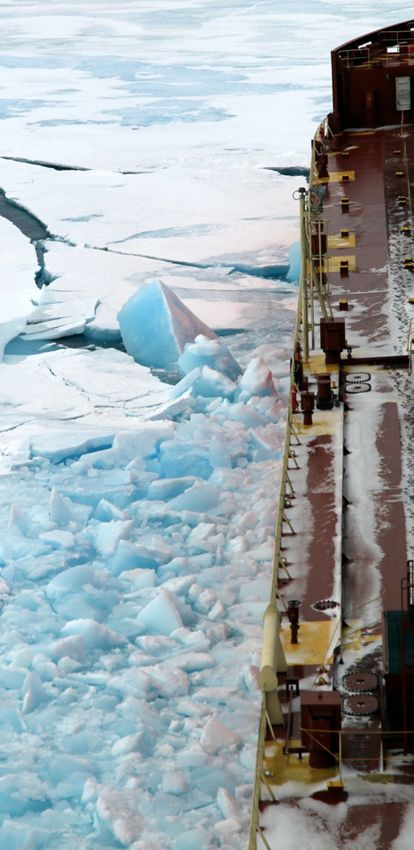
Figure 1. Ship tracks (satellite automatic identification system) in the Kitikmeot Region and
Lancaster Sound between July and October 2015, colour-coded by vessel category.

 3
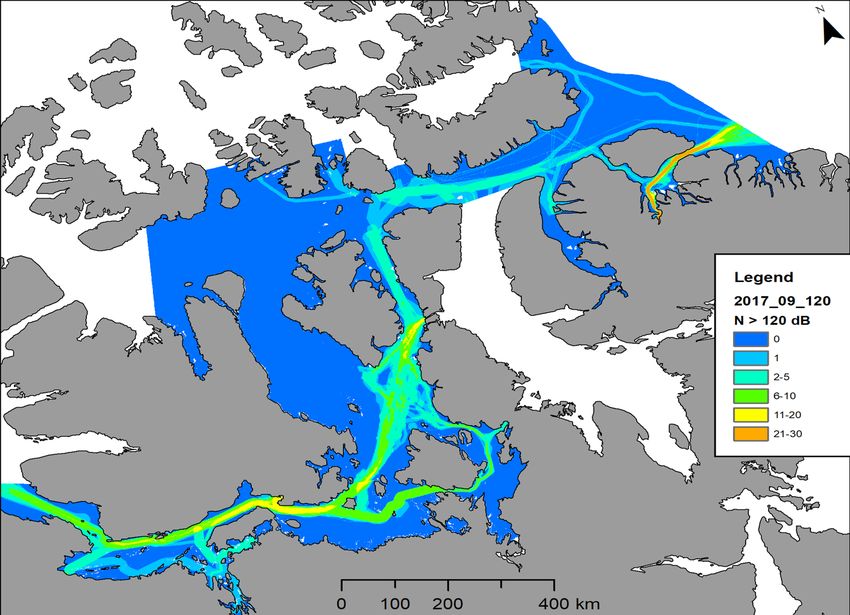
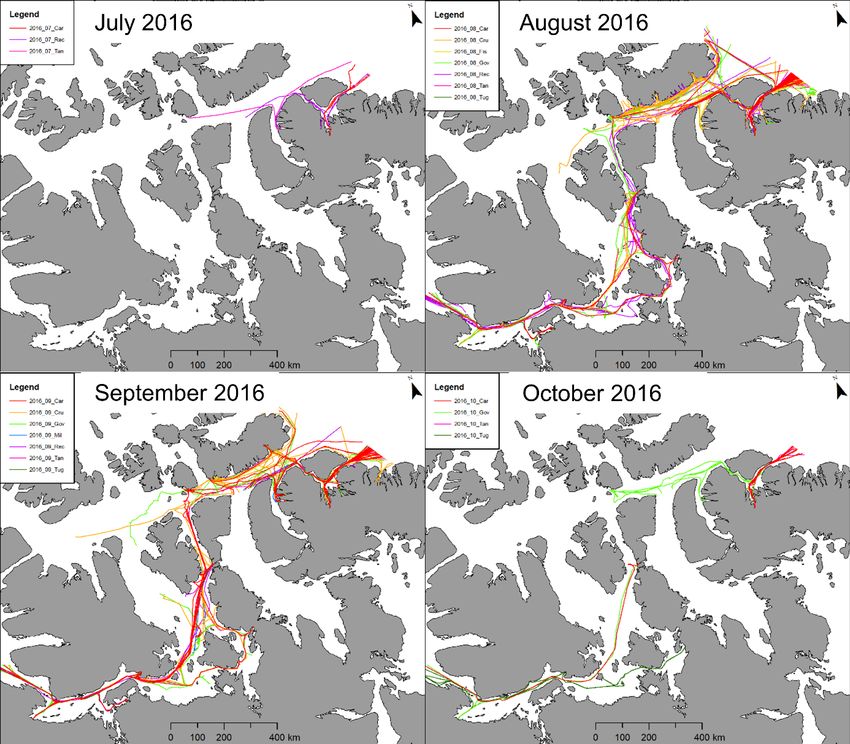
Figure 2. Ship tracks (satellite automatic identification system) in the Kitikmeot Region and
Lancaster Sound between July and October 2016, colour-coded by vessel category.

 4
Figure 3. Ship tracks (satellite automatic identification system) in the Kitikmeot Region and
Lancaster Sound between July and October 2017, colour-coded by vessel category.

 5
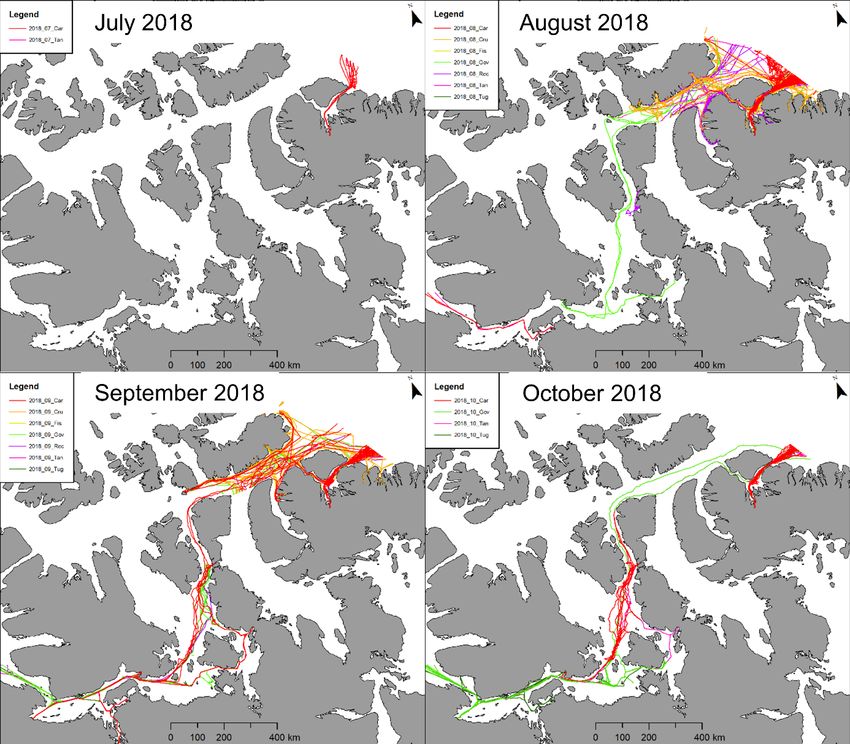
Figure 4. Ship tracks (satellite automatic identification system) in the Kitikmeot Region and
Lancaster Sound between July and October 2018, colour-coded by vessel category.

 6
Figure 5. Total distance traveled by different vessel categories in the Kitikmeot Region and
Lancaster Sound between July and October 2015-2018.

 7
Figure 6. Total distance traveled by each vessel class within each month between July and October
In 2015-2018 within Dease Strait (top) and Eclipse Sound (bottom).

 8
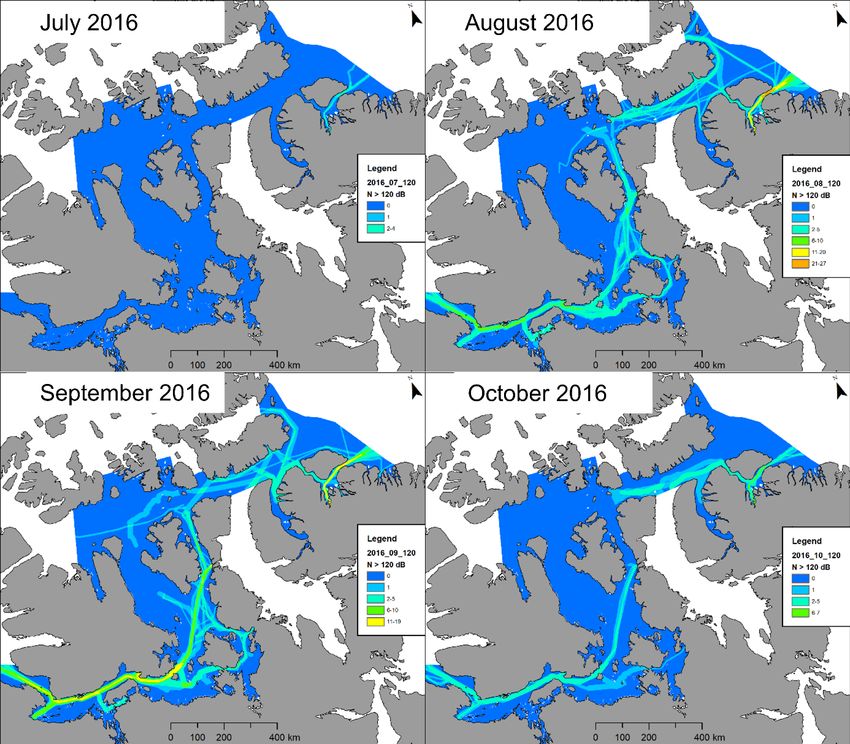
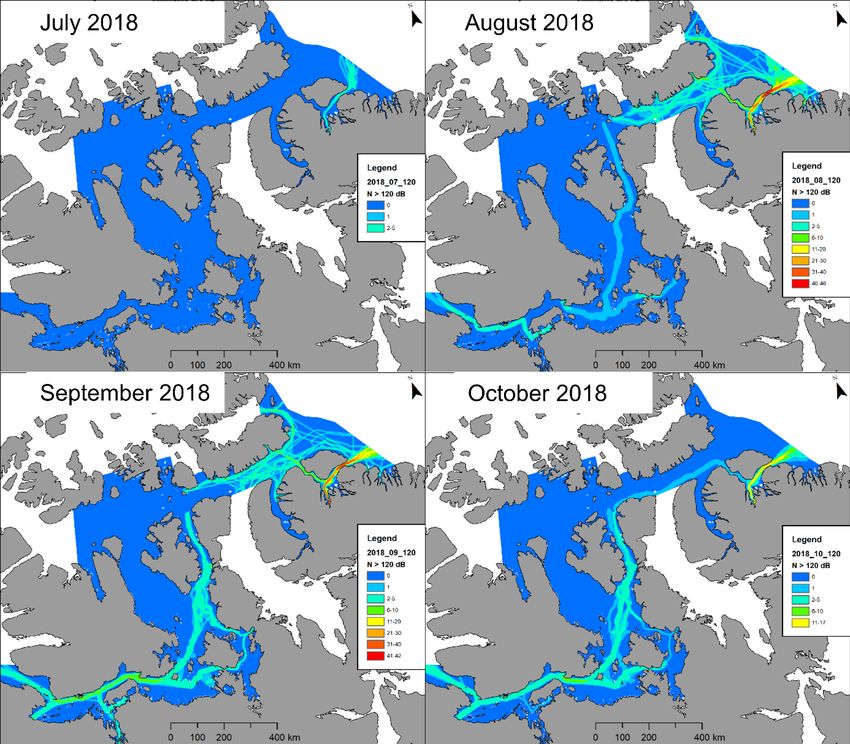
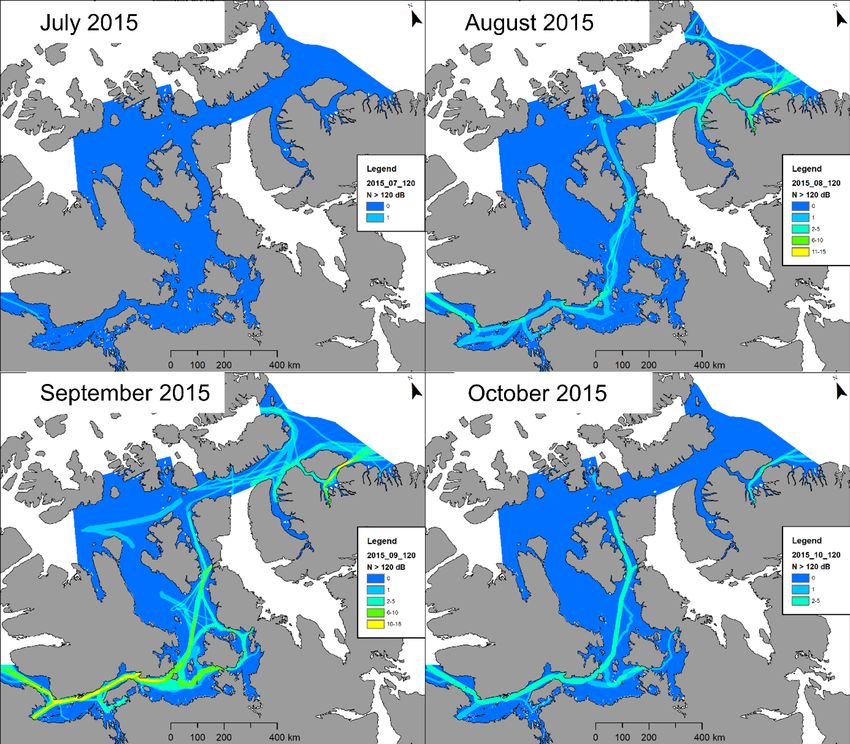
3.2 Modeled Underwater Noise
Underwater noise modeling outputs (Figures 7-12) showed a great deal of variability in ship noise
through time. In all four years, July only had a handful of vessel tracks, with the highest underwater
noise levels in 2018 when Baffinland expanded their shipping season more into July (Figures 7-
12). August and September have the highest underwater noise levels, and October is intermediate
(Figure 11). The majority of the study area has either no noise above 120 dB or noise from a single
ship track within a month. However, a few hotspots for vessel traffic existed in August and
September of every year: Eclipse Sound and Milne Inlet, the corridor south of Victoria Island near
Cambridge Bay and leading south of Prince of Wales and Somerset Islands, and generally through
the middle of the Parry Passage between Devon Island and northern Baffin Island (Figures 7-10).
Eclipse Sound and Milne Inlet have by far the most ship traffic and ship noise, and are the only
areas exceeding 20 noise disturbance events within a 500 m cell in a month (Figure 12). South of
Victoria Island near Cambridge Bay (Dease Strait) is the next highest hotspot for ship noise, simply
because the safe shipping corridor is quite narrow, so more ships are restricted in where they can
travel (Figure 12).
The year 2018 has lower noise levels than expected compared to other years, particularly in Dease
Strait (Figures 10, 12). This is because 2018 was a heavy sea ice year, which caused many cruise
ships and passenger vessels to change or cancel their trips, and these vessels completely avoided
the Kitikmeot Region.

 9
Figure 7. Counts of the number of times that each 500 m cell in the study region exceeded 120 dB
in each month from July to October of 2015.

 10
Figure 8. Counts of the number of times that each 500 m cell in the study region exceeded 120 dB
in each month from July to October of 2016.

 11
Figure 9. Counts of the number of times that each 500 m cell in the study region exceeded 120 dB
in each month from July to October of 2017.

 12
Figure 10. Counts of the number of times that each 500 m cell in the study region exceeded 120
dB in each month from July to October of 2018.

Figure 11. Total number of times per cell that the marine mammal behavioural disturbance
threshold was surpassed in the Kitikmeot Region and Lancaster Sound between July and October
2015-2018.

 13
Figure 12. The total number of times per cell that the marine mammal behavioural disturbance
threshold was surpassed in each month between July and October of 2015-2018 in Dease Strait
and Eclipse Sound.

4.0 DISCUSSION
As ship traffic in Kitikmeot and Lancaster Sound regions increases, concurrent ship-source noise
risk will also increase. Compared to other global Arctic regions ship traffic is low in Inuit
Nunangat, but it is the highest, and is growing the most rapidly, in Nunavut waters. It is expected
that climate change will facilitate increased shipping opportunities in the southern route of the
Northwest Passage over the medium to long term and that the northern route will remain choked
with ice at least until the end of the century (Laliberté et al. 2016; Howell and Brady 2019). These
observed and expected increases in shipping traffic is likely to intersect with key marine mammal
habitat regions that have been previously identified in scientific studies (Doniol-Valcroze et al.,
2020b, 2020a; Yurkowski et al., 2019) and through Inuit Knowledge (Dawson et al. 2020a; 2020b).
It is thus important to both model potential ship-source underwater noise risks for marine
mammals, such as has been conducted in this study, and to verify modelled impacts through
observational methods including through hydrophone data and Inuit knowledge. Benchmarking
historic and current noise impacts before the expected increases in shipping traffic through the
Northwest Passage will be very important in identifying policy measures to mitigate underwater
noise impacts for marine mammals in the future.

5.0 FUTURE WORK
This study has highlighted a number of future priorities for research on underwater noise in
Nunavut. These include: 1) examining the overlap between important areas for marine mammals

 14
and fish and underwater noise from ships to estimate the potential exposure of these species to
 noise; 2) forecast future shipping levels and estimate underwater noise levels in the future; 3)
 obtain better estimates of ship source levels for ships traveling in the Canadian Arctic; and 4)
 validate model results using passive acoustic data collected at key hotspots, such as in Eclipse
 Sound and Dease Strait.

 Photo Credit: Annika Ogilvie

Map Credit: William D. Halliday

 15
5.0 REFERENCES

Arctic Council, 2009. Arctic Marine Shipping Assessment 2009 Report.

Dawson, J., Carter, N., van Luijk N., Parker, C., Weber, M., Greydanus, K., and Provencher, J.
(2020a). Infusing local knowledge and community perspectives into the Low Impact Shipping
Corridors: an adaptation to increased shipping activity and climate change in Arctic Canada.
Environmental Science and Policy. 105, 19-36 https://doi.org/10.1016/j.envsci.2019.11.013

Dawson, J., Carter, N., van Luijk, N., Weber, M., and Cook, A. (2020b). Arctic Corridors and
Northern Voices: methods for community-based participatory mapping for low impact shipping
corridors in Arctic Canada. Submitted Methods X, June 30, 2020

Dawson, J., Pizzolato, L., Howell, S. EL, Copland, L., Johnston, M.E., 2018. Temporal and
Spatial Patterns of Ship Traffic in the Canadian Arctic from 1990 to 2015. Arctic 71, 15–26.

Doniol-Valcroze, T., Gosselin, J.-F., Pike, D., Lawson, J., Asselin, N., Hedges, K., Ferguson, S.,
2020a. Distribution and Abundance of the Eastern Canada – West Greenland Bowhead Whale
Population Based on the 2013 High Arctic Cetacean Survey. NAMMCO Sci. Publ. 11, v+27 p.
doi:10.7557/3.5315

Doniol-Valcroze, T., Gosselin, J.-F., Pike, D.G., Lawson, J.W., Asselin, N.C., Hedges, K.,
Ferguson, S.H., 2020b. Narwhal Abundance in the Eastern Canadian High Arctic in 2013.
NAMMCO Sci. Publ. 11. doi:10.7557/3.5100

Halliday, W.D., Pine, M.K., Insley, S.J., 2020. Underwater noise and Arctic marine mammals:
Review and policy recommendations. Environ. Rev. 28, 438–448. doi:10.1139/er-2019-0033

Howell, S. E. L., and Brady, M. (2019), The dynamic response of sea ice to warming in the
Canadian Arctic Archipelago. Geophysical Research Letters, 46, 13119– 13125.
https://doi.org/10.1029/2019GL085116.

Insley, S.J., Halliday, W.D., de Jong, T., 2017. Seasonal patterns in ocean ambient noise near
Sachs Harbour, Northwest Territories. Arctic 70, 239–248. doi:10.14430/arctic4662

Jakobsson, M., Mayer, L., Coakley, B., Dowdeswell, J.A., Forbes, S., Fridman, B., Hodnesdal,
H., Noormets, R., Pedersen, R., Rebesco, M., Schenke, H.W., Zarayskaya, Y., Accettella, D.,
Armstrong, A., Anderson, R.M., Bienhoff, P., Camerlenghi, A., Church, I., Edwards,
M.,Gardner, J. V., Hall, J.K., Hell, B., Hestvik, O., Kristoffersen, Y., Marcussen, C.,
Mohammad, R., Mosher, D., Nghiem, S. V., Pedrosa, M.T., Travaglini, P.G., Weatherall, P.,
2012. The International Bathymetric Chart of the Arctic Ocean (IBCAO) Version 3.0. Geophys.
Res. Lett. 39, 1–6. doi:10.1029/2012GL052219

Letaïef, S., 2019. Les processus sédimentaires durant le Petit âge glaciaire et l’actuel dans
l’Archipel arctique canadien. Université du Québec à Rimouski.

 16
Letaïef, S., St-Onge, G., Montero-Serrano, J.-C., 2018. Sedimentological , physical and magnetic
properties of surface sediments from the Canadian Arctic. EGU Gen. Assem. Conf. Abstr. 20.

Laliberté, F., S. E. L. Howell, and P. J. Kushner (2016), Regional variability of a projected sea
ice-free Arctic during the summer months, Geophys. Res. Lett., 43, 256–263,
doi:10.1002/2015GL066855

National Marine Fisheries Service, 2016. Technical Guidance for Assessing the Effects of
Anthropogenic Sound on Marine Mammal Hearing: Underwater Acoustic Thresholds for Onset
of Permanent and Temporary Threshold Shifts. U.S. Dept. of Commer., NOAA. NOAA
Technical Memorandum NMFS-OPR-55.

PAME, 2019. Underwater noise in the Arctic: a state of knowledge report. Rovaniemi, Finland.

Pizzolato, L., Howell, S., Dawson, J., Laliberté, F., Copland, L., 2016. The influence of declining
sea ice on shipping activity in the Canadian Arctic. Geophys. Res. Lett. 43.
doi:10.1002/2016GL071489

Smith, L.C., Stephenson, S.R., 2013. New Trans-Arctic shipping routes navigable by
midcentury. Proc. Natl. Acad. Sci. 110, E1191–E1195. doi:10.1073/pnas.1214212110

Southall, B.L., Bowles, A.E., Ellison, W.T., Finneran, J.J., Gentry, R.L., Jr., C.R.G., Kastak, D.,
Ketten, D.R., Miller, J.H., Nachtigall, P.E., Richardson, W.J., Thomas, J. a, Tyack, P.L., 2007.
Marine mammal noise exposure criteria: initial scientific recommendations. Aquat. Mamm. 33,
411–521. doi:10.1578/AM.33.4.2007.411

Veirs, S., Veirs, V., Wood, J., 2016. Ship noise extends to frequencies used for echolocation by
endangered killer whales. PeerJ 4, e1657. doi:10.7717/peerj.1657

Yurkowski, D.J., Auger-Méthé, M., Mallory, M.L., Wong, S.N.P., Gilchrist, G., Derocher, A.E.,
Richardson, E., Lunn, N.J., Hussey, N.E., Marcoux, M., Togunov, R.R., Fisk, A.T., Harwood,
L.A., Dietz, R., Rosing-Asvid, A., Born, E.W., Mosbech, A., Fort, J., Grémillet, D., Loseto, L.,
Richard, P.R., Iacozza, J., Jean-Gagnon, F., Brown, T.M., Westdal, K.H., Orr, J., LeBlanc, B.,
Hedges, K.J., Treble, M.A., Kessel, S.T., Blanchfield, P.J., Davis, S., Maftei, M., Spencer, N.,
McFarlane-Tranquilla, L., Montevecchi, W.A., Bartzen, B., Dickson, L., Anderson, C.,
Ferguson, S.H., 2019. Abundance and species diversity hotspots of tracked marine predators
across the North American Arctic. Divers. Distrib. 25, 328–345. doi:10.1111/ddi.12860

 17
APPENDIX - DETAILED METHODOLOGY
Estimating Propagation Loss
The propagation loss of sounds moving away from a source ship were modeling throughout the
Kitikmeot region and Lancaster Sound to identify how sound travels differently across this study
area. Of particular importance were sites differing in bathymetry or proximity to land. Propagation
loss of different classes of ships was calculated using the software dBSea 2.0 (Irwin Carr
Consulting, Northern Ireland). Propagation loss typically depends on four main factors: the source
level of the noise, the sound speed profile of the region, bottom sediment type, and bathymetry.
We accounted for all four of these variables when modeling (see below)
Median vessel source levels in 1/3 octave bands were obtained from the Port of Vancouver’s
listening station (ECHO Program) for the following ship categories: bulk carrier, cruise ship,
government research vessel, tanker, and tug (see Table 1). Average broadband source levels for
military, recreational, and fishing vessels were obtained from Veirs et al. (2016) (Table 1Error!
Reference source not found.), but were not used for the detailed acoustic propagation modeling
because they were not available as 1/3 octave levels.
Table 1. Median broadband vessel source levels from the Port of Vancouver’s ECHO program
and for additional vessel classes from Veirs et al. (2016).
 Source of data Vessel category N Source level
 (dB re 1 µPa @ 1 m)
 ECHO Program Bulk carriers 1728 188.3
 ECHO Program Cruise ships 81 179.5
 ECHO Program Government and icebreakers 12 192.6
 ECHO Program Tankers 292 187.4
 ECHO Program Tugs 582 180.8
 Veirs et al. 2016 Fishing 65 164
 Veirs et al. 2016 Military 113 161
 Veirs et al. 2016 Recreational 41 159

The average sound speed profile for the study region was calculated based on conductivity-
temperature-depth (CTD) measurements taken by the research vessel CCGS Amundsen. The mean
CTD and sound speed values at each metre of depth were calculated from the data from 22 different
CTD casts aboard the Amundsen in 2014.
For the bottom sediment type, one single sediment value was used for the entire region. Letaïef et
al. took sediment samples across the Canadian Arctic Archipelago, aboard the Amundsen in 2014.

 18
The samples were collected at specific spatial points and further interpolated; the average sediment
type for this region was identified as silt (Letaïef, 2019; Letaïef et al., 2018).
Bathymetric data was obtained from the International Bathymetric Chart of the Arctic Ocean at a
500 m spatial resolution (Jakobsson et al., 2012). These data are the most recent and most accurate
data currently available for the Arctic Ocean at a broad spatial scale.
Using the four inputs mentioned above, sound propagation was modelled using vessel positions
along major routes in the region, identified using satellite AIS data. Vessels positions were placed
between 20 and 50 km apart while also ensuring that the bathymetric characteristics were included.
The model estimates received levels every 500 m away from the source of noise along eight radial
slices (45° separation) and 10 metre depth increments. The modeling accounted for frequency-
dependent attenuation and propagation of sound by modelling each 1/3 octave band, and used two
different models to calculate propagation: normal modes for low frequency noise sources (12.5 Hz
to 1.2 kHz) and ray tracing for high frequencies (1.6 kHz to 32 kHz). Propagation loss values were
estimated by examining broadband received level by distance out to a maximum distance of 25
km across all radial slices, fitting a logarithmic line of best fit to the data, and estimating the slope
coefficient of the logarithmic line as the propagation loss value (see Table 3). This was done for
four different vessel classes: bulk carriers, cruise ships, government vessels, and tug boats; the
propagation loss estimates for bulk carriers were used for tankers, and the propagation loss
estimates for tug boats were used for fishing vessels, recreational vessels, and military vessels. The
different regions of propagation loss are shown in Figure 12.

Monthly Ship Noise Footprints
Following the estimation of each zone’s propagation loss, vessel noise footprints were produced
for each vessel track for each ship within each month of each year from 2015 to 2018 using
ArcMap 10.4 software (ESRI 2011. ArcGIS Desktop: Release 10. Redlands, CA: Environmental
Systems Research Institute); ship tracks were built from satellite AIS data (exactEarth, Cambridge,
ON). First, a grid of distance values was calculated around each vessel track using 500 m cell size
out to a 10 km radius from the ship track, and each cell was assigned a specific propagation loss
value depending on its location and the class of the vessel. The cell containing the ship track was
assigned a distance value of 1 m. The received level (dB re 1 µPa) in each cell was then calculated
using the standard received level equation:
 = – ∗
where RL is received level, SL is the broadband source level for a given vessel class, PL is the
propagation loss calculated for different areas in the study region, and Distance is the distance
grid.
The received level grid was then converted into a binary raster variable, with a one assigned to any
cell where received level was ≥ 120 dB re 1 µPa, and a zero assigned to all cells with received
level < 120 dB. 120 dB is the behavioural disturbance threshold for marine mammals as defined
by NOAA (National Marine Fisheries Service, 2016; Southall et al., 2007). Binary rasters were

 19
then summed for all vessels within a month to estimate the number of times that each 500 m cell
exceeded the 120 dB noise threshold within each month of each year. This count represents the
number of times within a month that a marine mammal in any given cell could have been exposed
to ship noise that exceeds the 120 dB behavioural disturbance threshold.

Figure 13. Zones of propagation loss in the Kitikmeot Region and Lancaster Sound of Nunavut.
The propagation loss values are specific to bulk carriers. Different values were used for other
vessel classes, but the relative difference and delineation of the zones remains the same for all
vessel classes.

 20
You can also read