Shifting sands: trade partner patterns since 2018 - ECOSCOPE
←
→
Page content transcription
If your browser does not render page correctly, please read the page content below

Shifting sands: trade partner
patterns since 2018
by Seung-Hee Koh, Catherine MacLeod and Elena Rusticelli

Global trade policy is undergoing a sea-change. The share of
global merchandise imports subject to trade restrictions has
risen particularly rapidly since 2018, initially due to a
sharp increase in tariffs on bilateral trade between the
United States and China. Since then, trade policy choices have
steadily become more harmful to global trade in goods (Figure
1, Panel A). Trade policy uncertainty has also increased,
alongside policy discussions about the re-location of value
chains and ongoing changes in the design of national
industrial policies. The latest OECD Economic Outlook (OECD,
2023) analyses trends in imports of manufactured goods across
major OECD economies to understand what impact this has had on
trade patterns.

So far, the increasing use of trade policies has coincided
with a period of subdued world trade growth, but has not
reduced global merchandise trade intensity (the ratio of trade
in manufactures and commodities to GDP in volume terms).
Nonetheless, since the global financial crisis, global trade
intensity has risen only marginally, following a period of
very sharp rises in the 1990s and early 2000s. The COVID
crisis saw a shallower decline and faster rebound in
merchandise trade intensity than the global financial crisis
(Figure 1, Panel B). In 2022, global trade in goods was 22% of
global GDP in volume terms, marginally higher than 2018.

The recent resilience of trade in volume terms may be linked
to the huge increase in demand for goods during the COVID
pandemic, as well as strong policy support during the pandemic
and energy crises. Merchandise trade as a share of GDP
generally rose in OECD countries between 2018 and 2022,
including in Europe and Japan, offsetting a decline in Chinese
merchandise trade intensity. However, merchandise trade
intensity was relatively unchanged in the United States, where
weak export growth offset a rise in import intensity.
Underneath the general rise in the value and volume of trade,
imported manufactured goods at a country-level reveal
important and differing shifts in the composition of
manufactured goods imports since 2018 in the major economies
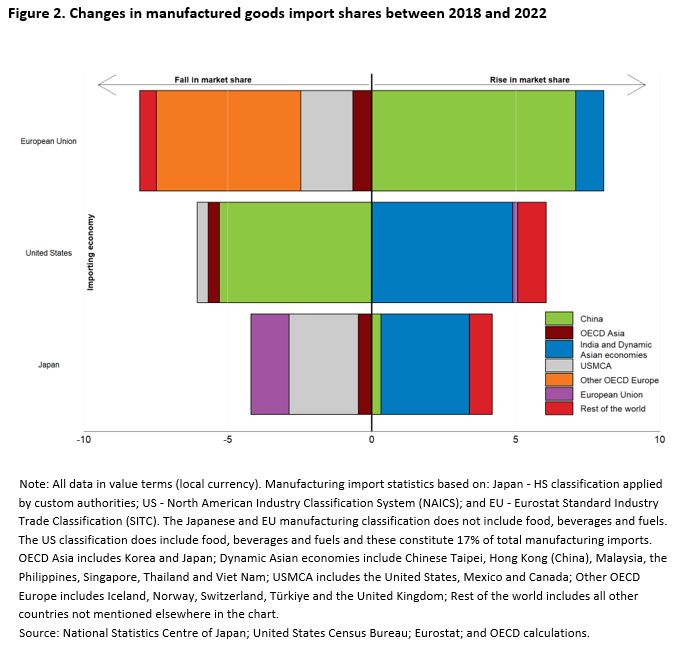
(Figure 2). A particular issue of policy interest is the
evolution of trade with geographically distant partners for
key inputs (far-shoring) compared to trade with geographically
closer trade partners (near-shoring).
Shifting far-shoring: In the US, there have been sharp
declines in China’s share of manufactured imports since
2018 – which have typically coincided with rising import
shares from dynamic Asian economies. This includes goods
where the 2018 tariffs are still applied. Evidence of
near-shoring is limited, with Mexico and Canada’s share
of imports rarely rising in the same categories where
China’s share has fallen.
Expanding far-shoring: in the EU, China’s weight in
     manufactured imports has continued to grow steadily. In
     contrast to the US, this has been alongside rising
     import shares for dynamic Asian economies. As for the
     US, there is limited evidence of near-shoring: the share
     of imports from other OECD countries in Europe has
     fallen, largely driven by changes in import shares from
     the United Kingdom.
     Changes at the margin: In Japan, the shifts in import
     shares have been much smaller than in the US or Europe.
     Its trade with the wider Asian region has increased
     steadily, although increases have been larger for
     dynamic Asia than China. As in Europe, this has been
     accompanied by a decline in the share of imports from
     other advanced economies.

So far, these shifts in trade patterns have occurred whilst
aggregate trade has continued to expand broadly in line with
global activity. However, in a global economy with slowing
long-term growth prospects the economic costs of more harmful
trade policies may become more evident over time.
References:

OECD (2023), OECD Economic Outlook, Volume 2023 Issue 1, OECD
Publishing, Paris, https://doi.org/10.1787/ce188438-en.
Monetary policy and credit
standards: this time it’s
different
by   Almira   Enders   and   Dennis   Dlugosch,   OECD   Economics
Department

The current monetary policy tightening cycle observed in many
countries stands out for several reasons. In particular, it is
rapid, globally synchronised and accompanied by an equally
rapid tightening of credit standards (OECD, 2022).

Since February 2022, the US Federal Funds Target Rate has
risen by 500 basis points (Figure 1 Panel A). No tightening
cycle since the mid-1980s has seen such a big increase in
policy rates in such a short period of time. Central banks in
other main advanced economies have acted comparably
aggressively in their fight against high inflation. The
European Central Bank, for example, has raised its policy
rates by 400 basis points since June 2022. The increase of
policy rates has been quickly transmitted to money market and
bank lending rates over the past year (OECD, 2023).

Figure 1. Policy rates and credit standards have tightened in
sync
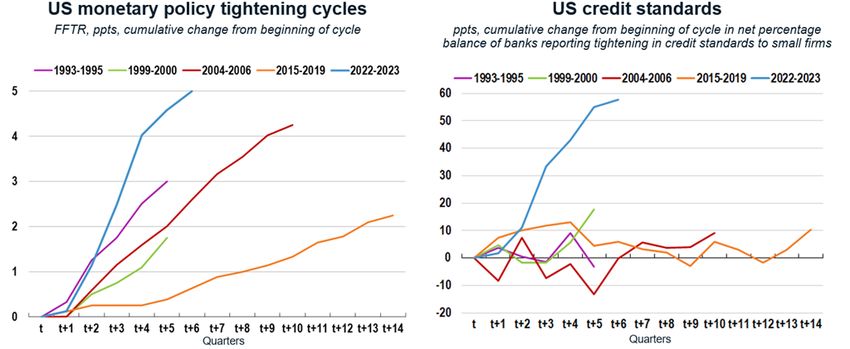
Note: Starting on Dec 16, 2008, the fed funds target rate
contains the average of the upper and lower limits of the
target range of the fed funds rate. Prior to Dec 16, 2008 the
fed funds target rate was a fixed rate. Credit standards refer
to net percentage of US domestic banks reporting tightening of
standards for commercial and industrial loans to small firms
(in percent, not seasonally adjusted).
Source: Federal Reserve Board; OECD calculations.

While the tightening of credit conditions is a standard
transmission channel of monetary policy, the synchronised
increase in interest rates and tightening of credit standards
is eye-catching in comparison to previous tightening cycles
(Figure 1 Panel B).[1]      Credit standards are non-price
measures that determine access to credit, such as collateral
requirements, employment status or income situation. Credit
standards can restrict access to credit in addition to sheer
the changes in lending rates which affect the supply and
demand for credit through their impact on cost of debt and
banks’ and borrowers’ balance sheets.

The net share of banks reporting tightened credit standards in
the current monetary policy tightening cycle has increased, in
step with the increase in policy rates. In March and April
2023, the net share of banks tightening lending standards to
small firms over the previous three months reached 47% in the
US.[2] While this share is still below the peaks reached
during the Covid-19 crisis (70%) and the Global Financial
Crisis (about 75%), the current rapid tightening of credit
standards is similar to the dynamics seen during the last two
severe economic downturns. In the euro area, as well, the
current monetary policy tightening was accompanied by the
tightening of credit standards, although less rapidly than in
the US. The corresponding net share of banks tightening credit
standards in the euro area increased to about 24% recently,
only a fraction below the last peak reached during the euro
area sovereign debt crisis at 28%. In the UK, the share of
lenders reporting worsened availability of unsecured credit to
households and small businesses widened rapidly to almost 40%,
approaching the peak reached during the Covid-19 crisis of
about 63%.[3]

Bank lending surveys also provide information on the reasons
behind changes in lending standards. In the US, most banks
have reported tighter lending standards because of a less
favourable or more uncertain economic outlook and a reduced
tolerance for risk. In the euro area, we observe similar
patterns, as higher risk perception and a lower tolerance for
risk of banks were the main reasons behind the recent
tightening of credit standards.

Focussing on small firms and households is interesting because
they are usually more exposed to tighter credit standards
given that they rely more on bank loans as external source of
finance. In the US and the euro area, the evolution of lending
standards to small firms appears representative for the
overall corporate sector. While in the US more banks have also
reported tighter standards for credit card loans; in the euro
area, the net share of banks reporting tighter credit
standards for households, which includes but is not limited to
credit card loans, has receded from their recent peaks over
the past two quarters. In the UK, credit availability remains
favourable for corporate sector and for secured lending for
households.

In the past, banks rapidly tightened credit standards during
severe economic downturns, mainly due to the expected
deterioration of borrower’s balance sheets (Ciccarelli et al.,
2015). In contrast to the current juncture, at that time
monetary policy accommodated these economic downturns, by
lowering interest rates in response to a slump in aggregate
demand and declining inflation. The combined tightening of
policy rates and credit standards has several implications for
policy makers. First, it adds to the uncertainty over the
impact of monetary policy on the real economy and thus makes
the transmission channel for monetary policy difficult to
gauge. Central banks will need to maintain restrictive
monetary policy to curb inflation durably. However, monitoring
financial stability and clear communication will be needed to
minimise uncertainty about apparent conflicts between the
pursuit of price stability and financial stability mandates.
Finally, keeping an eye on competition in financial services
will be critical to ensure that small business and households
continue to benefit from a vibrant financial sector.

References
Ciccarelli, M., A. Maddaloni and J.-L. Peydró (2015),”Trusting
the bankers: A new look at the credit channel of monetary
policy”, Review of Economic Dynamics, Vol. 18 (4).

OECD (2022), OECD Economic Outlook, Volume 2022 Issue 2, OECD
Publishing, Paris, https://doi.org/10.1787/16097408.

OECD (2023), OECD Economic Outlook, Volume 2023 Issue 1, OECD
Publishing, Paris, https://doi.org/10.1787/ce188438-en.

Footnotes
[1] The figure shows the synchronized tightening of policy
rates and credit standards in the US. The euro area bank
lending survey was launched in 2003. This limits a comparison
over several monetary policy tightening cycles.

[2] Based on a survey of lending practices of major US banks
conducted by the Federal Reserve Board System. The number
refers to the net percentage of banks that have tightened
lending standards over the previous three months. The net
percentage is equal to the difference between the sum of banks
answering “tightened considerably” and “tightened somewhat”
and the sum of banks answering “eased somewhat” and “eased
considerably” in percentage of the total number of banks.

[3] Based on the Bank Lending Survey conducted by the
Eurosystem of Central Banks for the euro area and based on the
Credit Conditions Survey conducted by the Bank of England for
the UK.

Do   central                     bank           losses
matter?
By Nobukazu Ono and Álvaro Pina, OECD Economics Department

                                                             Af
                                                             te
                                                             r
                                                             re
                                                             co
                                                             rd
                                                             in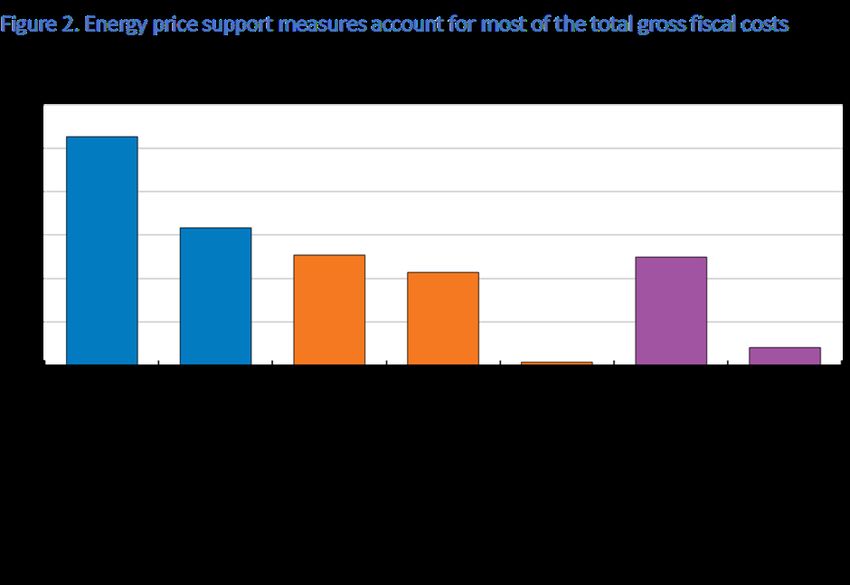
g
si
ze
ab
le
ga
in
s
fr
om
qu
an
ti
ta
ti
ve
ea
si
ng
(Q
E)
ov
er
mo
st
of
th
e
pa
st
de
ca
de
,
se
ve
ra
l
ce
nt
ra
l
ba
nk
s
ha
ve
re
ce
nt
ly
re
po
rt
ed
fi
na
nc
ia
l
lo
ss
es
.
Fu
rt
he
r
lo
ss
es
ar
e
li
ke
ly
in
th
e
co
mi
ng
ye
ar
s.
As
di
sc
us
se
d
in
th
e
la
te
st
OE
CD
Ec
on
om
ic
Ou
tl
oo
k
(O
EC
D,
20
23
),
th
es
e
lo
ss
es
ha
ve
lo
ng
be
en
an
ti
ci
pa
te
d,
as
pa
st
ga
in
s
an
d
cu
rr
en
t
lo
ss
es
ar
e
tw
o
si
de
s
of
th
e
sa
me
co
in
.
Th
is
is
al
so
th
e
ca
se
fo
r
th
e
ad
ve
rs
e
im
pa
ct
of
lo
ss
es
on
th
e
pu
bl
ic
fi
na
nc
es
,
wh
ic
h
co
me
s
af
te
r
se
ve
ra
l
ye
ar
s
of
si
gn
if
ic
an
t
ce
nt
ra
l
ba
nk
re
mi
tt
an
ce
s
to
Tr
ea
su
ri
es
.
No
ne
th
el
es
s,
lo
ss
es
an
d
th
e
po
te
nt
ia
l
ne
ed
fo
r
re
ca
pi
ta
li
sa
ti
on
fr
om
th
e
go
ve
rn
me
nt
ca
n
st
il
l
un
de
rm
in
e
th
e
cr
ed
ib
il
it
y
an
d
pe
rc
ei
ve
d
in
de
pe
nd
en
ce
of
ce
nt
ra
l
ba
nk
s.
Th
is
ca
ll
s
fo
r
tr
an
sp
ar
en
cy
an
d
cl
ea
r
co
mm
un
ic
at
io
n
in
th
e
pr
es
en
ta
ti
on
of
lo
ss
es
.
Why are central banks making losses?
Losses largely reflect the large balance sheets built up
during an extended period of QE and the effects of the recent
rises in policy interest rates. QE created a sizeable mismatch
in the maturity of central bank assets and liabilities. On the
liability side, central bank reserves (mainly commercial bank
deposits) rose sharply. The remuneration on these is closely
linked to policy interest rates, and has thus risen rapidly,
to the benefit of commercial banks. In contrast, on the asset
side, QE purchases were mostly long-term fixed-rate bonds that
generate a relatively stable stream of income. When policy
interest rates were at or close to the zero lower bound, the
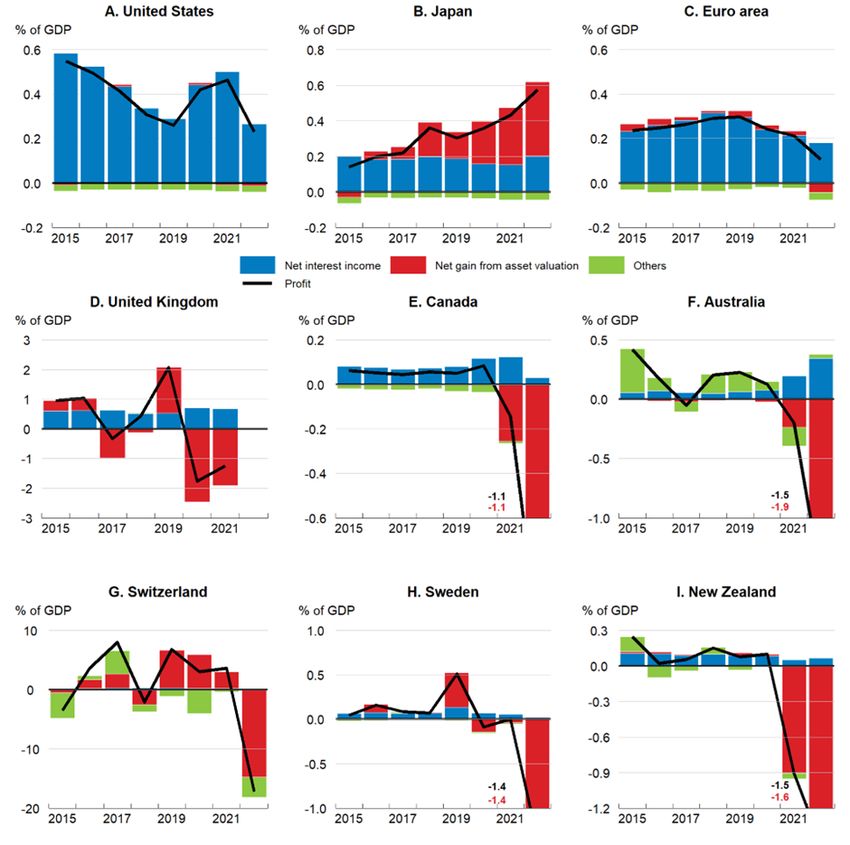
balance of these two sets of payments generated gains forcentral banks. Even as policy rates were raised through 2022, their impact on whole-year net interest income was still relatively mild (Figure 1), especially where most rate increases took place towards the end of the year, as in the euro area. However, larger impacts are likely in 2023 and 2024 (Anderson et al., 2022; De Nederlandsche Bank, 2022). Higher interest rates also reduce the market value of securities. Valuation losses may thus arise, though this depends on the accounting frameworks and asset sales decisions of central banks. For instance, the Federal Reserve and the Bank of Japan account for securities held for monetary policy purposes using amortised cost. This means that valuation changes do not affect profits unless securities are sold, which has not been the case so far. Eurosystem accounting guidelines, also followed by Sweden, allow central banks to value securities held for monetary policy purposes at either amortised cost or the current market price. While euro area national central banks have generally opted to use amortised cost, the Riksbank has adopted market pricing, making a significant loss apparent in 2022. Mark-to-market accounting brings forward loss recognition, as also illustrated by Australia, Canada, New Zealand, Switzerland and the United Kingdom. In Switzerland, the central bank loss was unusually large in 2022, at 17 per cent of GDP, but these losses stemmed largely from changes in the domestic currency value of foreign exchange reserves, including foreign securities. Do losses hamper fiscal or monetary policy? Central bank losses affect the public finances by reducing or ending central bank payments to the Treasury in the form of income taxes or remittances. Moreover, reverse cash flows (i.e., payments from the Treasury) may occur if central banks are entitled to be compensated by the government for certain losses, such as QE-related losses. For instance, in the United Kingdom, the Bank of England Asset Purchase Facility (APF), through which QE asset purchases were conducted, is fully
indemnified by the Treasury.

The annual impact on the general government fiscal balance
should in general be modest: over 2015-21, revenues from the
central banks considered in Figure 1 rarely exceeded, and were
often far below, 0.5% of GDP per year. However, even if small,
the negative effect on fiscal balances could be protracted, as
losses may persist for several years. Even after the central
bank returns to profit, some time may elapse before
remittances to the Treasury resume.

Central bank losses are not an indication of a policy error
and need not hamper the effectiveness of monetary and
financial policies. The policy mandates of central banks
include price stability and financial stability, but not
profit maximisation. Their current losses, as well as their
earlier gains from QE, are a by-product of policy actions
designed to help achieve their mandates. Moreover, central
banks are not subject to capital adequacy requirements or
bankruptcy procedures and can operate effectively even with
negative equity, as the central banks of Chile, the Czech
Republic, Israel and Mexico have done over several years (Bell
et al., 2023).

However, losses or negative equity can pose communication
challenges. For instance, some policy decisions, such as
retaining rather than selling government bonds, could be
misinterpreted as being motivated by a desire to contain
losses rather than as actions to pursue specific policy
mandates. This would reduce central bank credibility.
Likewise, financial flows from government, including actions
to strengthen central bank capital positions, could be
misperceived as being inconsistent with central bank
independence. This underscores the importance of clear
communication about the reasons for losses and of a
transparent framework for financial flows between the central
bank and the government.
Figure 1: Several central banks now report negative profits

Note: Accounting approaches and financial years differ across
countries and data should therefore be compared with caution.
‘Net gain from asset valuation’ includes realised gains/losses
and, in some countries, unrealised ones. For the euro area,
the chart shows the consolidated result of national central
banks. The euro area figure for 2022 is based on the 17 member
banks who had published results by 29 June 2023. For the
United Kingdom, the chart shows the consolidated result of the
Bank of England and the Asset Purchase Facility. See Box 1.3
in OECD (2023) for further details.
Source: Board of Governors of the Federal Reserve System; Bank
of Japan; national central banks in the euro area; Bank of
England; Bank of Canada; Reserve Bank of Australia; Swiss
National Bank; Sveriges Riksbank; Reserve Bank of New Zealand;
OECD Quarterly National Accounts database; and OECD
calculations.

References

Anderson, A., P. Marks, D. Na, B. Schlusche, and Z. Senyuz
(2022), “An Analysis of the Interest Rate Risk of the Federal
Reserve’s Balance Sheet, Part 2: Projections under Alternative
Interest Rate Paths,” FEDS Notes, Washington; Board of
Governors of the Federal Reserve System, 15 July,
https://doi.org/10.17016/2380-7172.3174.

Bell, S., M. Chui, T. Gomes, P. Moser-Boehm, and A. P. Tejada
(2023), “Why are Central Banks Reporting Losses? Does it
Matter?,”     BIS    Bulletin    No     68,        February,
https://www.bis.org/publ/bisbull68.pdf.

De Nederlandsche Bank (2022), “Letter regarding DNB’s capital
position     –    September      2022,”     9    September,
https://www.dnb.nl/media/p4igu5fc/letter-regarding-dnb-s-capit
al-position-september-2022.pdf.

OECD (2023), OECD Economic Outlook, Volume 2023 Issue 1, OECD
Publishing, Paris, https://doi.org/10.1787/ce188438-en.

Monetary policy pass-through
to bank credit conditions:
progressing fast
Ane Kathrine Christensen and Lucia Quaglietti, OECD Economics
Department

                                                          Po
                                                          li
                                                          cy
                                                          in
                                                          te
                                                          re
                                                          st
                                                          ra
                                                          te
                                                          s
                                                          ha
                                                          ve
                                                          ri
                                                          se
                                                          n
                                                          at
                                                          an
                                                          un
                                                          us
                                                          ua
                                                          ll
                                                          y
                                                          ra
                                                          pi
                                                          d
                                                          pa
                                                          ce
                                                          si
                                                          nc
e th e en d of 20 21 in ma ny co un tr ie s. Su ch po li cy ch an ge s af fe ct ec on om ic ac ti vi ty th
ro
ug
h
ma
ny
di
ff
er
en
t
ch
an
ne
ls
.
On
e
ke
y
ch
an
ne
l
is
th
e
sp
ee
d
an
d
ex
te
nt
to
wh
ic
h
ch
an
ge
s
in
po
li
cy
ra
te
s
ar
e
pa
ss
ed
th
ro
ug
h
to
fi
na
nc
in
g
co
nd
it
io
ns
an
d
cr
ed
it
gr
ow
th
,
an
d
th
us
to
pr
iv
at
e
co
ns
um
pt
io
n
an
d
in
ve
st
me
nt
(B
er
na
nk
e
an
d
Ge
rt
le
r
19
95
;
Mi
sh
ki
n
19
96
).
  A
na
ly
si
s
in
th
e
Ju
ne
20
23
OE
CD
Ec
on
om
ic
Ou
tl
oo
k,
su
gg
es
ts
th
at
ch
an
ge
s
in
po
li
cy
ra
te
s
in
OE
CD
ad
va
nc
ed
ec
on
om
ie
s
ar
e
be
in
g
qu
ic
kl
y
re
fl
ec
te
d
in
ba
nk
cr
ed
it
co
nd
it
io
ns
fa
ce
d
by
ho
us
eh
ol
ds
an
d
fi
rm
s,
wi
th
tr
an
sm
is
si
on
oc
cu
rr
in
                                                           g
                                                           at
                                                           a
                                                           br
                                                           oa
                                                           dl
                                                           y
                                                           si
                                                           mi
                                                           la
                                                           r
                                                           pa
                                                           ce
                                                           to
                                                           pa
                                                           st
                                                           ti
                                                           gh
                                                           te
                                                           ni
                                                           ng
                                                           cy
                                                           cl
                                                           es
                                                           .

One indicator is the extent to which increases in policy rates
have been transmitted into the interest rates on new bank
loans for households and firms. The evidence suggests that
transmission in the current cycle is similar to that in past
tightening cycles on average, but with significant variation
across countries (Figure 1, Panels A and B). In particular,
there have been strong increases in the cost of new bank loans
for non-financial corporations, where bank lending rates have
on average increased almost one‑to‑one with policy rates. The
largest relative increases in new bank lending rates have been
observed in Australia, Canada, New Zealand, Norway and Sweden, in some cases reflecting an earlier start to policy tightening. In the euro area, bank lending rates charged on short-term loans to non-financial corporations have generally increased faster than those on loans with longer maturities and lending rates on consumer loans to households have risen less than rates on loans for house purchases. Figure 1: Bank credit is slowing down and swiftly becoming more expensive Note: For the current tightening cycle, changes in policy rates, new lending rates and real credit growth are computed between the date of the first policy increase in each country and March 2023. Similarly, changes in bank lending rates across past tightening cycles are computed since the first rate increase and over a period matching the one elapsed since the first increase in the current cycle. Changes across past tightening cycles are computed as simple averages of individual country tightening cycles since 2000. “Average” is computed as a simple average across countries. Bank lending
rates and credit growth to households are for house purchases.
Real credit growth is obtained by deflating nominal credit
growth by national consumer prices.
Source: Central bank statistics; and OECD calculations.

Banks generally base the lending rates they charge to firms
and households on their own funding costs, plus a mark-up.
Rising policy rates have been quickly transmitted to interbank
lending rates, but transmission to deposit rates has been
sometimes slower. However, deposit rates have started to rise
more rapidly recently, with banks trying to counteract tighter
liquidity conditions and an acceleration in deposit outflows
by offering higher rates to their customers.

Fast-rising bank lending rates have been associated with a
slowdown in the pace of real credit growth (Figure 1, Panels C
and D). On average, the slowdown in real credit growth during
the current tightening cycle has been somewhat larger for
households than for companies, though credit to firms has
contracted sharply in a number of countries in the euro area
and in the United Kingdom, while it has remained comparatively
resilient in the United States and Canada. In the majority of
the countries considered, credit growth has been weaker than
at similar points in previous tightening cycles, and also
lower than on average over 2000-19, particularly for
households.

Monetary policy changes may also affect the willingness of
banks to make credit available to potential borrowers. Bank
lending surveys suggest that slowing credit growth and higher
lending rates observed in the major advanced economies reflect
a combination of tighter credit standards and falling credit
demand (Figure 2). Credit standards have often tightened
substantially in recent quarters, especially for mortgage
lending in the euro area and for lending to non-financial
corporations in the United States. Surveys point to a sharp
decline in credit demand as well, especially for house
purchase in the euro area and in the United Kingdom. In the
euro area, the decline in credit demand for house purchases is
similar to the fall seen during the global financial crisis.
Japan is an exception, with credit standards and demand being
little changed due to the continued accommodative monetary
policy stance.

Figure 2: Credit standards have tightened and demand has
declined sharply

Note: Net percentages are defined as the difference between
the sum of the share of banks reporting a tightening in credit
standards/rising credit demand and the sum of the share of
banks reporting a loosening of credit standards/falling credit
demand. Positive (negative) balances indicate tighter (easier)
credit standards and rising (falling) credit demand. For the
United Kingdom, credit standards are proxied by inverted loans
approved. For the United States, the United Kingdom and Japan,
credit standards to non-financial corporations are for large
firms
Source: Central bank statistics; and OECD calculations.

The pace of policy rate increases has now begun to slow in
many countries, but bank credit conditions could tighten
further in the coming quarters, with banks continuing to pass
through higher funding costs to households and corporates. As
a result, the full impact of policy tightening on activity is
likely to appear with a lag over the course of 2023 and early
2024.

References

Bernanke, B., and M. Gertler (1995). “Inside the Black Box:
The Credit Channel of Monetary Policy Transmission.” Journal
of Economic Perspectives, Vol. 9.

Mishkin F. (1996), “The Channels of Monetary Transmission:
Lessons for Monetary Policy,” NBER Working Papers 5464.

OECD (2023), OECD Economic Outlook, Volume 2023 Issue 1, OECD
Publishing, Paris.

Employment in Sweden: aiming
high
by Hyunjeong Hwang, OECD Economics Department

                                                          Sw
                                                          ed
                                                          en
                                                          ha
                                                          s
                                                          a
                                                          ve
                                                          ry
                                                          hi
                                                          gh
                                                          la
                                                          bo
                                                          ur
fo rc e pa rt ic ip at io n ra te an d on e of th e hi gh es t em pl oy me nt ra te s in th e OE CD ,
bu
t
ca
nn
ot
af
fo
rd
to
be
co
mp
la
ce
nt
.
Ma
in
ta
in
in
g
hi
gh
em
pl
oy
me
nt
is
a
pr
er
eq
ui
si
te
fo
r
th
e
su
st
ai
na
bi
li
ty
of
th
e
Sw
ed
is
h
we
lf
ar
e
st
at
e
an
d
to
co
un
te
r
th
e
ag
ei
ng
-
re
la
te
d
co
nt
ra
ct
io
n
of
th
e
la
bo
ur
fo
rc
e
an
d
it
s
ne
ga
ti
ve
fi
sc
al
im
pa
ct
s.
Th
e
20
23
OE
CD
Ec
on
om
ic
Su
rv
ey
of
Sw
ed
en
de
lv
es
in
to
so
me
ch
al
le
ng
es
ho
ld
in
g
ba
ck
la
bo
ur
su
pp
ly
an
d
pr
op
os
es
me
as
ur
es
to
ma
ke
th
e
Sw
ed
is
h
la
bo
ur
ma
rk
et
st
ro
ng
er
,
mo
re
in
cl
us
iv
                                                          e,
                                                          an
                                                          d
                                                          co
                                                          nd
                                                          uc
                                                          iv
                                                          e
                                                          to
                                                          su
                                                          st
                                                          ai
                                                          ne
                                                          d
                                                          ec
                                                          on
                                                          om
                                                          ic
                                                          gr
                                                          ow
                                                          th
                                                          .

Long-term unemployment, notably among the foreign-born,
remains a significant challenge. With lower educational
attainment and lower Swedish language skills than natives,
foreign-born people may struggle to get a job in a labour
market characterised by a compressed wage distribution that
demands high skills and productivity. Additionally, foreign-
born women often face strong gender and family norms. Re-
skilling and activation policies are key for these groups. A
recent reform of the Public Employment Service, introducing a
purchaser-provider model with outcome-based payments for
employment services could help, but needs to be carefully
monitored and calibrated to align providers’ incentives with
the objectives of the reform and to secure sufficient
competition. Carefully reviewing social assistance with the aim to strengthen work incentives while ensuring decent living standards for people in need could also help. Taxes on work are high, particularly among above-average income earners in Sweden (Figure 1). The top personal income tax rate is among the highest in the OECD and it applies from a low threshold. As a result, a relatively large share of taxpayers faces the top marginal tax rate. Meanwhile, tax rates on dividends and capital gains are relatively low. The large difference between taxes on labour income and capital income creates incentives for high-wage earners to reclassify their income as capital income in order to minimise their tax obligations. Furthermore, housing taxation is both low and regressive. Shifting taxation away from labour and towards property and capital income would thus help create a more balanced and equitable tax structure, promoting labour supply and inclusive growth while preserving fiscal sustainability. Lengthening working lives as life expectancy increases is essential to strengthen public finances and to ensure sufficient pension income. Reforms in the 1990s made Sweden’s pension system the envy of countries around the world, with in-built sustainability and incentives to lengthen working lives, and many policies have been put in place since to
extend working lives. However, recent reforms to boost basic
pensions and to introduce a new tax-funded income pension
supplement go in the direction of reducing incentives to
remain in work for many older workers and weaken the long-term
sustainability of the system. The stated purpose of these
changes was “to ensure a reasonable standard of living for
pensioners who receive a low level of earnings-related
pensions”. However, on average, Swedish pensioners are
relatively well-off compared internationally and compared to
younger generations in Sweden. Sweden should therefore change
direction by holding back the uprating of tax-funded pensions
for some time to come.

Relaxing strict rent controls, which would improve labour
mobility and increase the supply of rental dwellings, should
be considered. Waiting times for rental housing can stretch
from years to decades in major cities in Sweden, perpetuating
the scarcity of rental options. This pushes those with limited
queuing time and limited means to buy housing, particularly
youth and immigrants, into overcrowded housing, sublet or
black markets with significantly higher rents. Greater
flexibility in rental housing would facilitate the matching of
skills with job vacancies and boost productivity by more
efficiently allocating talent to where it is most needed.

Further reading:

OECD Economic Survey of Sweden (2023), OECD Economic Surveys:
Sweden 2023, OECD Publishing, Paris.

How Climate Policies Shape
Borrowing     Costs                                    and
Investment    through                                  the
Banking Channel
More   stringent   climate   policies   means   that   firms’
environmental performance affects their costs of debt as
(sophisticated) investors price transition risks

The  OECD   Energy                          Support
Measures Tracker:                           Looking
back to move ahead
By Cassandra Castle, Assia Elgouacem, Giuliana Sarcina, Enes
Sunel, and Jonas Teusch

                                                           In
                                                           th
                                                           e
                                                           pa
                                                           st
                                                           fe
                                                           w
                                                           ye
                                                           ar
                                                           s,
                                                           th
                                                           e
                                                           gl
                                                           ob
al ec on om y ha s ex pe ri en ce d tw o ma jo r cr is es : th e CO VI D- 19 pa nd em ic an d Ru ss ia
’s
wa
r
of
ag
gr
es
si
on
ag
ai
ns
t
Uk
ra
in
e.
Th
e
re
co
ve
ry
fr
om
th
e
pa
nd
em
ic
an
d
th
e
wa
r
ha
ve
bo
th
am
pl
if
ie
d
te
ns
io
ns
in
th
e
en
er
gy
se
ct
or
an
d
pr
ov
ok
ed
a
su
rg
e
in
en
er
gy
pr
ic
es
.
The fiscal response to the energy crisis has been large,
especially in Europe
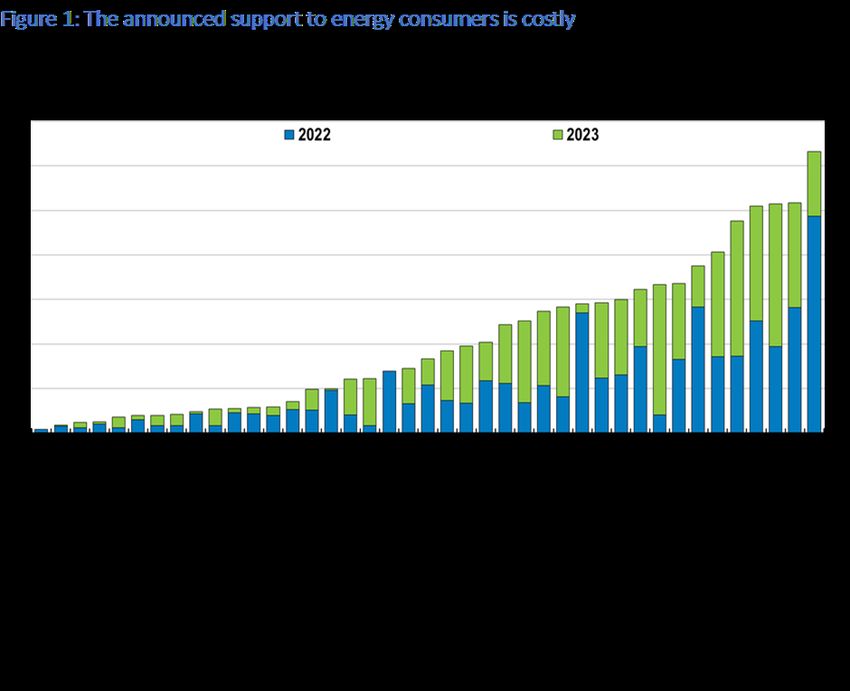
The OECD Energy Support Measures Tracker, released on 6 June
2023, shows that in 2022, support measures in response to
higher energy prices had a gross fiscal cost of 0.7% of GDP in
the median OECD economy, rising to over 2.5% of GDP in some
European countries (Figure 1). By way of comparison, these
costs exceed what the median OECD country spends on
unemployment benefits and are about half of the expenditure on
family and child benefits. Comparable levels of fiscal support
are foreseen for 2023 in the OECD as a whole. However, the
actual cost of support will heavily depend on the evolution of
energy prices.
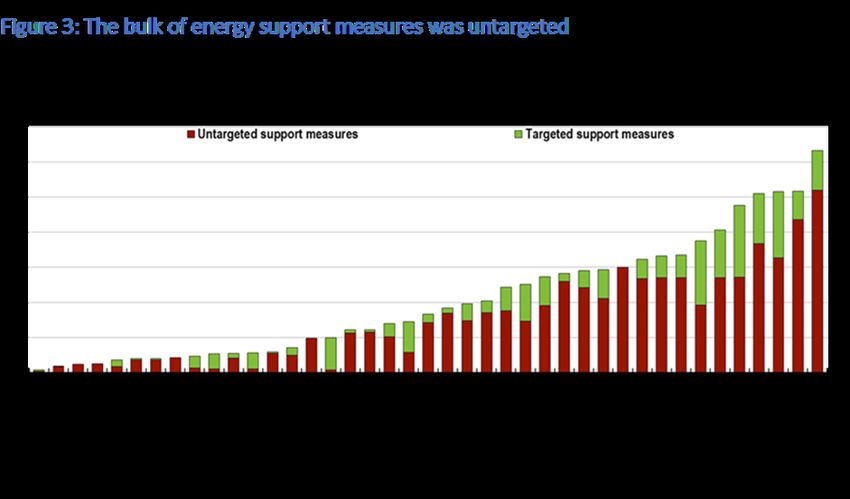
Click for Chart dataThe OECD Energy Support Measures Tracker provides comprehensive data and information on energy-crisis related fiscal support measures Documenting the measures governments have implemented to face the energy price shock and being able to compare them across countries, remains critical to improving support policies and building resilience against future crises. The Tracker systematically catalogues support measures in place from February 2021 to May 2023 in 41 countries – 35 OECD countries and 6 non-OECD economies (Brazil, Bulgaria, Croatia, India, Romania and South Africa).[1] The data have been collected and processed by OECD country, fiscal and energy policy experts and validated by national administrations. The new dataset provides granular information to comprehensively characterise individual support measures. These include start and end dates, gross fiscal costs, type of support and delivery mechanism, main beneficiaries of the measures (indicating whether vulnerable households or firms from specific sectors are targeted, and, where applicable, summary information on the differentiation of support between beneficiaries) and the impacted energy carriers (such as diesel, gasoline, electricity, natural gas). The sheer number and diversity of the measures makes classification challenging. The Tracker classifies more than 550 support measures into two main categories: (1) price measures (e.g. reduced energy taxes and energy price caps), estimated to cost USD 422 billion in 2022-23; and (2) income measures (e.g. transfers and tax credits to consumers), estimated to total USD 383 billion in 2022-23. Within income measures, a distinction is made between measures that reduce the average price of energy in consumers’ energy bills and measures that are unrelated to the level of energy consumption (Figure 2).
Click for Chart data

The   measures   –   which   were   implemented   swiftly   amidst
uncertainty, political economy constraints, and a focus on
administrative simplicity – affect the behaviour of firms and
people in different and significant ways, and may contribute
to or detract from important longer-term policy objectives.
Income support can maintain incentives to save energy whereas
price measures weaken them, propping up demand for fossil
fuels and effectively acting as a negative carbon price. Among
income measures, those that are unrelated to the level of
energy consumption tend better to preserve incentives for
energy efficiency improvements than those that reduce the
average price in the energy bill paid by consumers.

Measures were rarely targeted and increased the incentive to
consume fossil fuels

Untargeted support measures make up the majority of the
estimated total cost of support in 2022-23 (Figure 3). Among
these, energy price support measures account for over 50% of
total spending and carry substantial non-fiscal implications.
While price support measures are straightforward to design and
often politically popular, they weaken incentives to save
energy and are rarely targeted (over 92% of energy price
support measures are untargeted), meaning that they tend to
disproportionately support better-off households.

Click for Chart data

A clear taxonomy of measures and data can enable the design of
better energy support policieswhen they are needed

Energy prices are receding, but possible renewed tensions in
energy markets due to geopolitical developments and
bottlenecks along the energy transition may result in higher
energy price volatility in the future. Preparing government
policy for possible new energy price spikes requires data and
information on how support measures affect the behaviour of
households and firms, their impact on public finances and
their unintended consequences. The OECD Tracker is a resource
for policymakers to do just that.

More information

OECD (2023), OECD Energy Support Measures Tracker, OECD
database                 available                  at:
http://www.oecd.org/economy/oecd-energy-support-measures-track
er/OECD_Energy_Support_Measures_Tracker.xlsx

OECD (2023), “Aiming Better: Government Support for Households
and Firms During the Energy Crisis”, OECD Economic Policy
Papers      No.     32,     OECD     Publishing:       Paris,
https://doi.org/10.1787/839e3ae1-en

[1] The government of Iceland has not taken any energy support
measures. The Tracker also includes information on another
five countries, for which it was either not possible to
quantify the gross fiscal cost of the energy support measures
(Argentina, China, Hungary and Indonesia) or these were deemed
to have no impact on budget deficits, as is the case of
measures providing credit and equity support (Switzerland).

América Latina: Estabilidad
fiscal y equidad, un camino
compartido hacia el progreso.
Jens Arnold, Aida Caldera, Priscilla Fialho, Paula Garda,
Alberto González Pandiella, Michael Koelle, Alessandro
Maravalle, Adolfo Rodriguez-Vargas        and   Elena   Vidal,
Departamento de Economía, OCDE

Después de dos años con altos crecimientos, mejores de lo
esperado, América Latina está volviendo a la senda de bajo
crecimiento que tenía antes de la COVID-19. Para 2023 se
espera una fuerte ralentización económica, mayor que en el
resto del mundo. Esto se debe a una demanda externa que pierde
dinamismo y un consumo doméstico golpeado por la pérdida del
poder adquisitivo de los hogares, como consecuencia de
elevadas tasas de inflación y del endurecimiento de las
condiciones financieras entre otros. Mientras que las
economías OCDE crecerán un 1.4% en promedio en 2023, el PIB de
los siete países de América Latina aumentará un 1.5%. Para
2024 se prevé una mejora, las economías de América Latina
repuntaran ligeramente hasta un 1.7% en promedio, por encima
del crecimiento promedio de las economías de la OCDE (Cuadro
1), si bien este crecimiento no será suficiente para lograr la
convergencia en PIB per cápita con la OCDE. Por otro lado, la
inflación se ha ido moderando gradualmente en la mayoría de
los países después de alcanzar niveles históricos, gracias a
la rápida y fuerte subida de las tasas de política monetaria y
menores precios globales de combustibles y alimentos.

Este panorama, ya de si poco alentador, está acompañado de una
elevada incertidumbre y de riesgos domésticos y externos
inusualmente altos. Un crecimiento mundial menor de lo
previsto, especialmente en Estados Unidos y en China,
acompañados de una inflación más persistente de lo esperado
que implique una política monetaria más restrictiva en el
mundo y en la región, representan claros riesgos a la baja.
Aunque los buenos niveles de liquidez y capitalización en el
sector bancario permitieron que las recientes turbulencias
internacionales tuvieran un impacto mínimo en los países de la
región, el endurecimiento de las condiciones financieras a
nivel global, junto con los signos de inestabilidad en el
sector bancario internacional, podrían causar salidas de
capitales y un repunte de la aversión al riesgo, junto a
volatilidad de los tipos de cambio y del coste de
financiación. En términos domésticos, la frecuencia de eventos
climáticos severos se ha incrementado debido al cambio
climático. Lo mismo sucede con las tensiones sociales que
fueron exacerbadas por la pandemia y con las recientes
presiones inflacionarias.
A pesar de estas dificultades, un futuro próspero y equitativo
en América Latina es posible. Navegar los riesgos en el
horizonte requiere fortalecer las cuentas públicas al tiempo
que se atienden las crecientes demandas sociales y se mejora
el crecimiento de una forma duradera.

Cuadro 1. Perspectivas económicas de los países de América
Latina

Nota: América Latina (ALC) es la media ponderada por PIB a
paridad de poderes de compra de los 7 países en la tabla para
el PIB; y la media simple de los países incluidos en el cuadro
para la inflación.
Fuente: OCDE Perspectivas Económicas No. 113, junio de 2023.
Fortalecer las cuentas públicas y proteger a los más
vulnerables

La situación fiscal permanece frágil en la región. Si bien los
déficits fiscales disminuyeron en 2022, la deuda pública sigue
históricamente elevada y la carga de intereses ha aumentado,
siendo ésta muy sensible al endurecimiento de las condiciones
de financiación globales. Todo ello junto con un crecimiento
débil plantea riesgos para la sostenibilidad fiscal. Proseguir
la consolidación fiscal es crucial para restaurar la confianza
de los mercados y reducir los costes del servicio de la deuda
a la vez que se enfatiza el gasto social para apoyar a los
pobres y hacer frente a las necesidades crecientes en
educación, sanidad y protección social. Alcanzar estos
objetivos requerirá la movilización de ingresos de manera
progresiva, favorable al crecimiento y equitativa. Los
programas de transferencias de apoyo social en un contexto de
alta inflación deben ser temporales y focalizados hacia los
más vulnerables y reducir los incentivos a la informalidad.

Fomentar la participación laboral de las mujeres: clave para
impulsar el crecimiento inclusivo

Para impulsar el crecimiento potencial y reducir las
desigualdades en América Latina será clave una agenda de
reformas para mejorar el acceso y la calidad de la educación,
incrementar la competencia y reducir las brechas de
infraestructura (transporte y digital). Pero también
incrementar la participación laboral de las mujeres será un
ingrediente prioritario. La brecha en las tasas de
participación femenina en el mercado laboral respecto a los
hombres es grande, mayor que el promedio de la OCDE (Gráfico
1). Además, cuando las mujeres trabajan tienen más
probabilidades de tener trabajos informales con peores
condiciones laborales, reduciendo sus salarios. Cerrar estas
desigualdades de género impulsarían muy significativamente el
crecimiento en la región de una forma equitativa. No solo se
incrementaría el número de personas en la fuerza laboral, sino
que también se impulsaría la productividad, al mejorar la
adecuación entre trabajadores y empleos. A su vez, el mayor
crecimiento económico también tendría un impacto fiscal
positivo, ayudando en el reto de fortalecer las cuentas
públicas.

¿Como hacerlo? Promover el acceso a la educación inicial, que
a pesar del progreso reciente es insuficiente en la mayoría de
los países de América Latina, es clave para aumentar la
participación laboral de las mujeres. La tasa de participación
escolar de los niños menores de 6 años es a menudo más baja en
los hogares de menores ingresos, donde las necesidades de
cuidado impiden que las madres participen en el mercado
laboral. Deben incrementarse la oferta de plazas en las
guarderías y subsidios para los hogares con menos recursos.
Estas distorsiones de género en el mercado laboral están
también estrechamente relacionadas con las desigualdades en la
formación de las mujeres. Por tanto, es crucial seguir
invirtiendo en educación básica accesible y de calidad.
Finalmente, es necesario promover campañas de sensibilización
y educación para combatir estereotipos de género tan
arraigados en los países de América Latina.

Gráfico 1. La brecha de género en participación laboral en los
países de Latinoamérica está muy por encima del promedio de la
OCDE

Participación laboral, población 15-64 años de edad, por sexo,
2021

Fuente : OCDE, base de datos de estadísticas de población
activa; y Perú: INEI.
Más información:

OECD Economic Outlook, junio 2023– Reporte completo en inglés
con las proyecciones macroeconómicas, los principales desafíos
estructurales e información detallada por país.
Perspectivas económicas de la OCDE para países de América
Latina, junio 2023.

Información detallada para Argentina | Brasil | Chile |
Colombia | Costa Rica | México | Perú

A Long Unwinding Road
By Clare Lombardelli, OECD Chief Economist

The global economy is turning a corner but faces a long road
ahead to attain strong and sustainable growth. Global GDP
growth slowed substantially throughout 2022, but several of
the factors weighing negatively are now unwinding. Falling
energy prices and headline inflation, easing supply
bottlenecks and the reopening of China’s economy, coupled with
strong employment and relatively resilient household finances,
all contribute to a projected recovery. Nevertheless, the
recovery will be weak by past standards. We project global
growth to be 2.7% in 2023, with a modest pick-up to 2.9% in
2024 – both well below the average growth rate in the decade
preceding the COVID-19 pandemic.
Policymakers need to act decisively on macroeconomic and
structural policy to deliver stronger and more sustainable
growth. This is hard. Core inflation remains too persistent.
Debt levels are too high. And potential output is too low.

Monetary policymakers need to navigate a difficult road.
Although headline inflation is declining thanks to lower
energy prices, core inflation remains stubbornly high, more so
than previously expected. Central banks need to maintain
restrictive monetary policies until there are clear signs that
underlying inflationary pressures are abating. Some economies
grappling with stubbornly high core inflation may require
additional interest rate increases. However, policymakers must
keep a watchful eye, given the uncertainties around the exact
impact of the rapid and globally synchronised monetary policy
tightening following an extended period of low interest rates.
The tightening has already revealed some vulnerabilities in
financial markets. Should further financial market stress
arise, central banks should deploy financial policy
instruments to enhance liquidity and minimise contagion risks.
Clear communication will be crucial to avoid confusion about
the potential conflict between pursuing price stability and
financial stability mandates.
The choices for fiscal policymakers are clearer but no easier
to implement given the inherent political sensitivity of
policy choices with direct redistributive effects. Fiscal
policy played a vital role in supporting the global economy
through the shocks of the COVID-19 pandemic and Russia’s war
in Ukraine. However, in the aftermath, most countries are
grappling with higher budget deficits and higher public debt.
The burden of debt servicing is increasing and spending
pressures related to ageing and the climate transition are
building.

As the recovery takes hold, fiscal support should be scaled
back and better targeted. Energy price support should be
withdrawn as energy prices fall. Vulnerable households
inadequately covered by existing social protection systems,
will continue to need support, as still high food and energy
prices particularly burden the most disadvantaged. Limited
resources should be targeted only to those who really need it
and to high-priority productivity-enhancing investments,
including those driving the green transition and improving
labour supply and skills. Gradually unwinding fiscal support
will help reduce the burden on monetary policy, strengthen
buffers against future crises and prepare for longer-term
challenges

Emerging-market economies face challenges from tight global
financial conditions: higher debt servicing costs, capital
outflows, and reduced credit availability from foreign
lenders. Moreover, rising geopolitical tensions and concerns
about supply chain security have prompted several countries to
implement trade and investment restrictions. Increasingly
restrictive trade policies risk curtailing the gains from
global trade and harming the development prospects of low-
income countries.

Ultimately only ambitious structural policy reforms can
sustainably raise long-term economic growth and people’s
quality of life around the world. Revitalising labour and
product markets; removing barriers to cross-border trade;
promoting competition and adapting competition policies to the
digital era; and enhancing skill development are essential
elements of the structural reform agenda.

Private and public investment is needed in human, tangible and
intangible capital to enable people to make the most of their
skills and capabilities, and to harness the ever-increasing
opportunities from technological transformation. Investment in
education and skills is critical to enable people to flourish
in the future economy and reap the benefits of increased
productivity.

Policymakers need to unwind the impact of a sequence of
negative shocks to the global economy and face a complex set
of challenges in doing so. They need to calibrate monetary and
fiscal policies to curtail inflation and rebuild fiscal
buffers without overly reducing growth. Delivering sustainably
higher rates of growth will need bold and forward-thinking
structural policy reforms allowing us to harness the
opportunities of rapid technological advances, demographic
shifts, and the climate transition.

More information:

Editorial from the OECD Economic Outlook, June 2023

Clare Lombardelli’s Twitter
Clare Lombardelli’s LinkedIn

La route est encore longue
Clare Lombardelli, Cheffe économiste de l’OCDE

L’économie mondiale a amorcé un tournant, mais la route est
encore longue pour parvenir à une croissance forte et durable.
La croissance du PIB mondial a sensiblement ralenti tout au
long de 2022, mais plusieurs des facteurs qui la brident
encore commencent à s’estomper. Le recul des prix de l’énergie
et de l’inflation globale, l’atténuation des perturbations de
l’offre et la réouverture de l’économie chinoise sont autant
de facteurs qui, conjugués à la vigueur de l’emploi et à la
relative résilience des finances des ménages, contribuent à la
reprise prévue. Celle-ci sera néanmoins timide par rapport aux
rebonds observés dans le passé. D’après nos projections, la
croissance mondiale s’établira à 2.7 % en 2023, avant de se
redresser légèrement pour atteindre 2.9 % en 2024, soit bien
en deçà du taux de croissance moyen enregistré durant la
décennie qui a précédé la pandémie de COVID-19.

Les décideurs publics doivent agir avec détermination sur les
leviers macroéconomiques et structurels pour asseoir une
croissance plus forte et plus durable. La tâche est ardue :
l’inflation sous-jacente est trop persistante, les niveaux
d’endettement sont trop élevés et la production potentielle
est trop faible.

Les autorités monétaires doivent négocier un virage délicat.
Malgré la décrue de l’inflation globale due au recul des prix
de l’énergie, l’inflation sous-jacente reste obstinément
forte, en tout cas plus élevée qu’on ne l’avait anticipé. Les
politiques monétaires doivent rester restrictives tant
qu’aucun signe d’atténuation des tensions inflationnistes
sous-jacentes ne sera clairement confirmé. De nouveaux
relèvements des taux d’intérêt pourraient être nécessaires
dans certaines économies en proie à une inflation sous-jacente
résolument élevée. Les autorités doivent toutefois rester
vigilantes compte tenu des conséquences incertaines du
resserrement monétaire rapide et synchronisé opéré à l’échelle
mondiale après une longue période de faibles taux d’intérêt.
Ce changement de cap a déjà mis au jour certaines
vulnérabilités sur les marchés financiers. Si les tensions
devaient s’accentuer, les banques centrales devraient
mobiliser divers instruments de politique financière pour
accroître la liquidité et réduire autant que possible les
risques de contagion. Elles devront à tout prix communiquer
clairement pour éviter toute confusion quant au conflit
potentiel entre le double mandat de stabilité des prix et de
stabilité financière.

Les choix qui s’imposent aux autorités budgétaires sont plus
évidents, mais pas plus faciles à mettre en œuvre, les
décisions qui ont des effets redistributifs directs étant
toujours politiquement sensibles. La politique budgétaire a
joué un rôle essentiel en soutenant l’économie mondiale face
aux chocs provoqués par la pandémie de COVID-19 et la guerre
menée par la Russie en Ukraine. Cependant, la plupart des pays
sont aujourd’hui aux prises avec des déficits budgétaires plus
amples et un endettement public en hausse. La charge du
service de la dette s’alourdit tandis que les tensions sur les
dépenses liées au vieillissement démographique et à la
transition climatique s’accentuent.

Alors que la reprise va s’installer, il faudra réduire et
mieux cibler les mesures de soutien budgétaire. Les aides
liées aux prix de l’énergie devraient être démantelées à
mesure que ceux-ci diminueront. Les ménages vulnérables, dont
la protection sociale est actuellement insuffisante,
continueront d’avoir besoin d’aide, le niveau toujours élevé
des prix de l’alimentation et de l’énergie pesant
particulièrement sur les plus défavorisés. Les ressources
disponibles, limitées, devraient être consacrées à celles et
ceux qui en ont réellement besoin, ainsi qu’aux
investissements hautement prioritaires propices aux gains de
productivité, notamment ceux qui favorisent la transition
écologique et améliorent l’offre de main-d’œuvre et les
compétences. La suppression progressive des aides budgétaires
permettra de moins solliciter les instruments de politique
monétaire, de renforcer les marges de manœuvre pour affronter
les crises futures, et de se préparer à faire face aux enjeux
à plus long terme.

En raison du durcissement des conditions financières à
l’échelle mondiale, les économies de marché émergentes
traversent des difficultés, notamment un alourdissement du
service de la dette, des sorties de capitaux ou une réduction
de l’offre de crédit des prêteurs étrangers. Par ailleurs, la
montée des tensions géopolitiques et les préoccupations
grandissantes concernant la sécurité des chaînes
d’approvisionnement ont incité plusieurs pays à prendre des
mesures limitant les échanges et l’investissement. Des
politiques commerciales de plus en plus restrictives risquent
de réduire les gains tirés du commerce mondial et de
compromettre les perspectives de développement des pays à
faible revenu.

En définitive, seules des réformes structurelles ambitieuses
peuvent améliorer durablement la croissance économique à long
terme et la qualité de vie des populations partout dans le
monde. Tout train de réformes structurelles doit
impérativement viser à redynamiser les marchés du travail et
des produits, à lever les obstacles aux échanges
internationaux, à favoriser la concurrence et à adapter les
politiques en la matière à l’ère numérique, ainsi qu’à
renforcer les compétences.

Des investissements privés et publics dans le capital humain
et les actifs matériels et immatériels seront indispensables
pour permettre aux individus d’utiliser au mieux leurs
compétences et aptitudes, et tirer parti des perspectives
toujours plus nombreuses offertes par la transformation
technologique. Il est primordial d’investir dans l’éducation
et les compétences afin que chacun puisse s’épanouir dans
l’économie future et récolter les fruits d’une productivité
accrue.

Les décideurs publics vont devoir estomper les effets induits
par une succession de chocs négatifs sur l’économie mondiale,
et affronter pour cela une série de défis complexes. Il leur
faut notamment ajuster les politiques monétaires et
budgétaires de façon à réduire l’inflation et à reconstituer
des marges de manœuvre budgétaires sans trop freiner la
croissance. Pour améliorer durablement les taux de croissance,
ils ne pourront se dispenser de mener des réformes
structurelles audacieuses et novatrices qui nous permettront
de mettre à profit les perspectives ouvertes par les progrès
technologiques rapides, les évolutions démographiques et la
transition climatique.

Editorial des Perspectives économiques de l’OCDE
You can also read