Severe Acute Respiratory Syndrome Coronavirus 2 Serosurveillance in a Patient Population Reveals Differences in Virus Exposure and ...
←
→
Page content transcription
If your browser does not render page correctly, please read the page content below
The Journal of Infectious Diseases
    Major Article

Severe Acute Respiratory Syndrome Coronavirus
2 Serosurveillance in a Patient Population Reveals
Differences in Virus Exposure and Antibody-Mediated
Immunity According to Host Demography and Healthcare
Setting

                                                                                                                                                                                                  Downloaded from https://academic.oup.com/jid/article/223/6/971/6052401 by guest on 07 November 2021
Ellen C. Hughes,1,2,a, Julien A. R. Amat,1,3,a Joanne Haney,1 Yasmin A. Parr,1 Nicola Logan,1 Norah Palmateer,4,5 Sema Nickbakhsh,1, Antonia Ho,1,
Peter Cherepanov,6,7 Annachiara Rosa,6 Andrew McAuley,4,5 Alice Broos,1,2 Imogen Herbert,1 Ursula Arthur,1 Agnieszka M. Szemiel,1 Chloe Roustan,6
Elizabeth Dickson,4 Rory N. Gunson,8 Mafalda Viana,2,b Brian J. Willett,1,b and Pablo R. Murcia1,b,
1
 MRC–University of Glasgow Centre for Virus Research, Institute of Infection, Immunity and Inflammation, College of Medical, Veterinary and Life Sciences, University of Glasgow, Glasgow,
United Kingdom, 2Institute of Biodiversity, Animal Health and Comparative Medicine, College of Medical, Veterinary and Life Sciences, University of Glasgow, Glasgow, United Kingdom, 3School
of Veterinary Medicine, College of Medical, Veterinary and Life Sciences, University of Glasgow, Glasgow, United Kingdom, 4Public Health Scotland (Health Protection Scotland), Glasgow, United
Kingdom, 5School of Health & Life Sciences, Glasgow Caledonian University, Glasgow, United Kingdom, 6Chromatin Structure and Mobile DNA Laboratory, The Francis Crick Institute, London,
United Kingdom, 7Department of Medicine, Imperial College London, St Mary’s Campus, London, UK, and 8West of Scotland Specialist Virology Centre, NHS Greater Glasgow and Clyde, Glasgow,
United Kingdom

Identifying drivers of severe acute respiratory syndrome coronavirus 2 (SARS-CoV-2) exposure and quantifying population immu-
nity is crucial to prepare for future epidemics. We performed a serial cross-sectional serosurvey throughout the first pandemic wave
among patients from the largest health board in Scotland. Screening of 7480 patient serum samples showed a weekly seroprevalence
ranging from 0.10% to 8.23% in primary and 0.21% to 17.44% in secondary care, respectively. Neutralization assays showed that
highly neutralizing antibodies developed in about half of individuals who tested positive with enzyme-linked immunosorbent assay,
mainly among secondary care patients. We estimated the individual probability of SARS-CoV-2 exposure and quantified associated
risk factors. We show that secondary care patients, male patients, and 45–64-year-olds exhibit a higher probability of being sero-
positive. The identification of risk factors and the differences in virus neutralization activity between patient populations provided
insights into the patterns of virus exposure during the first pandemic wave and shed light on what to expect in future waves.
   Keywords. SARS-CoV-2; COVID-19; virus exposure, serology; virus neutralization; modelling; risk factors; seroprevalence.

Severe acute respiratory syndrome coronavirus 2 (SARS-                                               detectable 7–21 days after infection [3], can identify past viral
CoV-2) was first reported in China in December 2019 and                                              exposure even in asymptomatic individuals. In-house assays
spread rapidly across multiple countries. The first coronavirus                                      commonly use an indirect enzyme-linked immunosorbent
disease 2019 (COVID-19) case in Scotland was confirmed on                                            assay (ELISA) format, with recombinant S protein, S1 subunit
28 February 2020, the country entered lockdown on 23 March,                                          of the S protein, or the receptor-binding domain (RBD) used as
and restrictions were eased on 28 May [1]. Serological surveys                                       antigens. Virus neutralization assays provide insights into the
are instrumental in determining infection rates at the popu-                                         effectiveness of the humoral immune response. Neutralization
lation scale [2]. Assays based on the detection of anti-SARS-                                        titers obtained with pseudotype-based tests are similar to those
CoV-2 immunoglobulin (Ig) G antibodies, which are typically                                          obtained with live virus [4], and 2 pseudotype-based methods
                                                                                                     are commonly used: human immunodeficiency virus (HIV)–
                                                                                                     based and vesicular stomatitis virus–based pseudotypes. Both
   Received 21 October 2020; editorial decision 21 December 2020; accepted 21 December 2020;
                                                                                                     methods produce similar results [5].
published online December 26, 2020.
   a
    E. C. H. and J. A. R. A. contributed equally to this work.                                          Models that link patient information (eg, age, sex, and time
   b
    M. V., B. J. W., and P. R. M. contributed equally to this work.                                  of sampling) with exposure and immunity enable the identi-
   Correspondence: Pablo R. Murcia, MRC–University of Glasgow Centre for Virus Research,
Institute of Infection, Immunity and Inflammation, College of Medical, Veterinary and Life           fication of factors associated with SARS-CoV-2 infection [6].
Sciences, University of Glasgow, Glasgow G61 1QH, United Kingdom (pablo.murcia@glasgow.              NHS Greater Glasgow and Clyde (NHSGGC) is the largest
ac.uk).
                                                                                                     health board in Scotland and reported the most COVID-19
The Journal of Infectious Diseases®  2021;223:971–80
© The Author(s) 2020. Published by Oxford University Press for the Infectious Diseases Society       cases (n = 3876) and deaths (n = 1280) in the country between
of America. This is an Open Access article distributed under the terms of the Creative Commons       1 March and 24 May [7]. We performed a serial cross-sec-
Attribution License (http://creativecommons.org/licenses/by/4.0/), which permits unrestricted
reuse, distribution, and reproduction in any medium, provided the original work is properly cited.   tional study among primary and secondary care patients in
DOI: 10.1093/infdis/jiaa788                                                                          NHSGGC to estimate levels of exposure to SARS-CoV-2

                                                                                     SARS-CoV-2 Seroprevalence in a Patient Population • jid 2021:223 (15 March) • 971
since the introduction of the virus in Scotland and up to cal-       ine (Sigma-Aldrich/Merck) was added and incubated for 10
endar week 21 (starting on 18 May 2020). Using a bayesian            minutes in the dark.
framework, we combined serological and patient information              The reaction was stopped by adding an equal volume of
to estimate an individual’s probability of testing positive for      1-mol/L sulfuric acid. Absorbance was read immediately
SARS-CoV-2 across various age groups, time and healthcare            at 450 nm on a Labsystems Multiskan Ascent plate reader.
settings. We also performed neutralization assays to estimate        Duplicates of pooled known-positive and known-negative con-
the fraction of exposed individuals who developed an effec-          trols were included on each plate. Raw absorbance values were
tive antibody response. Finally, we combined serological data        corrected using the following equation: (sample absorbance
with publicly available information on deaths to estimate the        − negative control mean)/negative control mean. This value
case-fatality ratio.                                                 was used for downstream analysis. The cutoff between posi-
                                                                     tive and negative values was selected using receiver operating
METHODS                                                              characteristic (ROC) analysis undertaken with the corrected
Serum Samples                                                        absorbance values of positive and negative control samples

                                                                                                                                           Downloaded from https://academic.oup.com/jid/article/223/6/971/6052401 by guest on 07 November 2021
Ethical approval was provided by NHSGGC Biorepository (ap-           tested on the assay. A total of 320 serum samples collected be-
plication 550). Random residual biochemistry serum samples           fore December 2019, obtained from the National Institute for
(n = 7480) from primary (general practices) and secondary            Biological Standards and Control and the Scottish National
(hospitals) healthcare settings were collected by the NHSGGC         Blood Transfusion Service, were used as negative controls.
Biorepository between 16 March and 24 May 2020. Associated              Positive controls were defined as samples from patients with
metadata included date of collection, patient sex and age, partial   a positive reverse-transcription polymerase chain reaction re-
postal code of the patient, and sample origin (primary or sec-       sult, or those who had recent clinical symptoms consistent with
ondary care). All serum samples were inactivated at 56ºC for 30      COVID-19 and whose serum sample tested positive on all other
minutes before being tested.                                         serological platforms (EUROIMMUN-Anti-SARS-CoV-2
                                                                     ELISA [IgG], Abbott Architect SARS-CoV-2 IgG, or DiaSorin
ELISA Testing                                                        LIAISON SARS-CoV-2 S1/S2 IgG). A total of 128 samples were
S1 and RBD antigens were prepared as described elsewhere             used as positive controls. Cutoff values for individual antigens
[8]. The SARS-CoV-2 RBD and S1 constructs, spanning SARS-            were chosen to optimize for the specificity of each individual
CoV-2 S (UniProt ID P0DTC2) residues 319–541 (RVQPT…                 test, while maintaining a sensitivity >90%. All samples were
KCVNF) and 1–530 (MFVFL…GPKKS), respectively, were                   tested against both S1 and RBD antigens, and separate ROC
produced with C-terminal twin Strep tags. Proteins were pro-         analyses were undertaken for each antigen. ROC analyses were
duced by transient expression in Expi293F cells grown in             performed using GraphPad Prism software (v9.0.0) (GraphPad)
FreeStyle-293 medium (Thermo Fisher Scientific). Proteins            (Supplementary Figure 1). Final sensitivity and specificity
were harvested at 2 time points, 3–4 and 6–8 days after transfec-    values, and 95% confidence intervals (CIs), were calculated by
tion. Twin Strep-tagged proteins were captured on Streptactin        applying the individual cutoff values for S1 and RBD, derived
XT (IBA LifeSciences) and purified by size exclusion chro-           from the ROC analysis, to the control samples in parallel (ie, if
matography through Superdex 200 (GE Healthcare). Purified            a sample tested positive for either or both antigens, it was con-
SARS-CoV-2 antigens, concentrated to 1–5 mg/mL by ultrafil-          sidered positive). The resulting numbers of true-positives and
tration were aliquoted and snap-frozen in liquid nitrogen be-        true-negatives, and false-positives and false-negatives, were
fore storage at −80ºC.                                               then used to calculate the final sensitivity and specificity of the
   Assays to detect IgG antibodies against recombinant S1 and        combined assays.
RBD antigens of SARS-CoV-2 were performed as described
elsewhere [9]. First, 96-well plates (Immulon 2HB, Fisher            Neutralization Assays
Scientific) were coated overnight with S1 or RBD antigen             HEK293, HEK293T, and 293–angiotensin-converting en-
(50 ng per well). After being washed 3 times with phosphate-         zyme 2 (ACE2) cells were maintained in Dulbecco’s mod-
buffered saline (PBS)/0.05% Tween 20 (all subsequent wash            ified Eagle’s medium (DMEM) supplemented with 10%
steps followed the same protocol), serum samples were di-            fetal bovine serum, 2-mmol/L L-glutamine, 100-µg/mL
luted 1:100 in PBS/0.05% Tween 20 (vol/vol) supplemented             streptomycin and 100-IU/mL penicillin. HEK293T cells
with 10% (vol/vol) casein (Vector Laboratories; 2BScientific)        were transfected with the SARS-CoV-2 S (corresponding
and incubated for 1 hour at room temperature before a second         to Wuhan-Hu-1 strain; GenBank MN908947) gene expres-
wash. Anti-human IgG horseradish peroxidase–conjugated               sion vector pCDNA6-S (from N. Temperton, University
secondary antibody (Bethyl Laboratories) diluted 1:3000 in           of Kent), together with pNL4-3-Luc-E−R−luc [10] using
PBS/0.05% Tween 20/casein was then added and incubated for           polyethylenimine (Polysciences). HIV (SARS-CoV-2)–
1 hour before a third wash. Next, 3,3′,5,5′-tetramethylbenzid        containing supernatants were harvested 48 hours after

972 • jid 2021:223 (15 March) • Hughes et al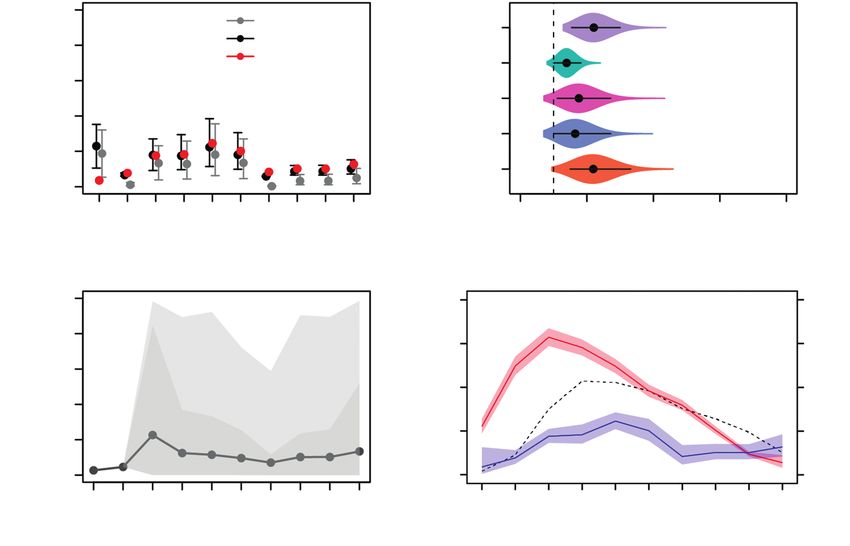
transfection, aliquoted and frozen at −80ºC before use. 293-          captured the weekly exposure dynamics through a linear pre-
ACE2 target cells were generated by stable transduction               dictor comprising a temporal trend and autocovariates (ie,
of HEK293 cells with pSCRPSY-human ACE2 (hACE2).                      first- and second-order autoregressive components capable
Selected 293-ACE2 cells were maintained in complete                   of reconstructing potential exposure cycles). This results in a
DMEM supplemented with 2-µg/mL puromycin.                             weekly probability of infection that reflects the average chance
   Neutralizing antibodies were measured using a fixed dilution       of being infected in a given week after adjustment for individual
screening. Duplicate serum samples were diluted 1:50 in com-          covariates in the observation process.
plete DMEM and incubated for 1 hour with an equal volume                 The observation process confronted the population probabil-
of HIV (SARS-CoV-2) pseudotypes. The serum-virus mix was              ities by using individual-level data (ie, binary observed serolog-
plated onto 293-ACE2 cells in 96-well white cell culture plates.      ical data from each patient) in a Bernoulli trial that adjusted
After 48–72 hours, luciferase activity was quantified by adding       seropositivity according to the sensitivity and specificity of the
Steadylite Plus chemiluminescence substrate (Perkin Elmer)            test and estimated an individual’s probability of infection based
and analyzed on a Perkin Elmer EnSight multimode plate                on the population-level dynamics but also through a series of

                                                                                                                                             Downloaded from https://academic.oup.com/jid/article/223/6/971/6052401 by guest on 07 November 2021
reader (Perkin Elmer). Serum samples were considered to have          individual covariates such as sex, age, care type and week of
high neutralizing activity if at a 1:50 dilution they reduced in-     sample collection. We noted that since further adjustment for
fection by HIV (SARS-CoV-2) pseudotypes by ≥90% [11].                 population size resulted in differences of approximately 0.1% in
                                                                      group-based seroprevalence estimates, for simplicity this was
COVID-19 Data                                                         omitted from the final state-space model. We ran the model
The number of laboratory-confirmed cases was obtained                 in JAGS for 100 000 iterations and 50 000–iteration burn-in to
from the Scottish government Web site (https://www.gov.scot/          achieve full convergence. Priors and the model code are pro-
coronavirus-covid-19/) and the West of Scotland Specialist            vided in the Supplementary Material.
Virology Centre. The number of COVID-19–associated deaths
was obtained from the National Records of Scotland Web site           Infection Fatality Ratio
(https://www.nrscotland.gov.uk/covid19stats).                         An infection fatality rate was calculated for each age group by
                                                                      estimating the fraction of SARS-CoV-2–confirmed deaths rel-
Statistical Analysis                                                  ative to the number of people exposed. The latter variable was
Multivariable logistic regression models were used to investi-        approximated using the adjusted seroprevalence, multiplied by
gate associations between neutralization at a 1:50 dilution and       the corresponding group population size (455 739, 310 813,
corrected optical density values, care type, age group, and sex in    106 435, and 80 745 for the 18–44-, 45–64-, 65–74-, and ≥75-
ELISA positive samples (n = 216). Separate models were run for        year age groups, respectively). Mid-2019 population estimates
samples positive to S1 and RBD (Supplementary Tables 2 and            were obtained from the National Records of Scotland (https://
3). Univariate analyses comparing the mean corrected optical          www.nrscotland.gov.uk).
density, or percentage neutralization, between ELISA-positive
samples from primary and secondary care types were under-             RESULTS
taken using Mann-Whitney U tests. To determine a sample size          A total of 7480 residual biochemistry serum samples from pa-
for estimating the prevalence of partial postal code districts,       tients living in NHSGGC were tested for the presence of IgG
we used a simple calculation, assuming a random sample from           antibodies against the S1 subunit of the SARS-CoV-2 spike
a large population. An assumed prevalence (p) of 10%, and a           protein and its RBD using 2 ELISA assays [9]. Of these, 6635
confidence of 95%, substituted into the equation n = 1.962p(1 −       met the inclusion criteria and were used for further analysis.
p)/d2 (where d = precision = 0.05), resulted in a sample size of      Samples spanned a 10-week period, starting on 16 March 2020
138. Statistical analyses and data visualization were undertaken      and covered all NHSGGC districts and all age groups, except
using R software [12], version 3.6.1. Models were run using           for children and young adults
Residual biochemistry serum
4.73%–7.63%] for men and 5.40% [4.29%–6.71%] for women)
samples (n = 8099) Figure 2C).
Patient seroprevalence was also calculated in a subset of
districts (20 of 61) in which sample numbers provided suffi-
NHSGGC (n = 7480)
cient power to estimate prevalence. Estimated seroprevalences
Primary/Secondary caretype
ranged from 3.83% (95% CI, 1.67%–7.40%) to 12.94% (8.29%–
sample orgin (n = 7271) 18.94%) (Supplementary Table 1) suggesting that there may be
geographically driven differences in infection risk. However,
Filtering
Age ≥18 y (n = 7246) sample size limitations prevented more detailed analysis. Our
bayesian state-space model [14] was used to adjust the crude
1 Sample per patient/wk patient seroprevalence rates for the sensitivity and specificity of
(n = 6672) the assays and to determine the factors associated with seropos-
itivity in the study population. The model converged well and
Downloaded from https://academic.oup.com/jid/article/223/6/971/6052401 by guest on 07 November 2021
Sampled from 16 March 2020
provided a good fit to the data (Figure 3A and Supplementary
to 18 May 2020 (n = 6635)
Figure 2). Although the test had high sensitivity (95.31%; 95%
CI, 90.08%–98.26%) and specificity (97.20%; 94.76%–98.71%),
the adjusted overall seroprevalence (5.29%; .13%–15.10%) was
S1 + RBD
ELISAs
approximately half the crude estimates (Figure 3A and Table 1).
The analysis indicated that patients receiving secondary care
were twice as likely (odds ratio, 2.2; 95% CI, 1.6–3.1) to be sero-
positive as those in primary care (Figure 3B).
Male patients were 1.39 (95% CI, 1.1–1.8) times more
S1 and RBD negative S1 and/or RBD positive likely to be seropositive, and individuals belonging to the
45–64-year age group were 2.2 (1.5–3.3) times more likely
to be seropositive than those in the 18–44-year age group.
However, belonging to the older age groups (≥65 years)
did not significantly increase the probability of being sero-
Seronegative sample Seropositive sample positive (Figure 3B). Nonetheless, considering the adjusted
seroprevalences per age group, and their associated popula-
tion size and SARS-CoV-2–related deaths, we estimated a
Figure 1. Diagram summarizing the flow of samples used in this study.
Abbreviations: ELISAs, enzyme-linked immunosorbent assays; NHSGGC, NHS higher infection fatality ratio in older age groups (Table 1),
Greater Glasgow and Clyde; RBD, receptor-binding domain; S1, spike glycoprotein. consistent with findings from a previous United Kingdom–
based study [18]. The probability of infection at the population
level (Figure 3C) peaked once during the week beginning 30
The overall unadjusted seroprevalence in our patient pop- March, 2 weeks before the week with highest seroprevalence
ulation was 7.81% (95% CI, 7.17%–8.48%) (Figure 2A). and coincided with the peak of polymerase chain reaction–
Seroprevalence was higher in 45–64-year-olds, in male patients, confirmed cases (Figure 3D). After this peak, there was a low
and in patients attending secondary care services (Figure 2A). and constant weekly probability of infection (median 10.2%;
A steady increase in seroprevalence was observed from the 95% CI, 3.1%–20.6%) (Figure 3C), likely reflecting the strict
week beginning 16 March up to the week beginning 13 April lockdown conditions of the study period. At the end of the
in both primary and secondary care settings. However, while study period, before lockdown was eased, we observed a slight
seroprevalence in the secondary care subpopulation was higher, increase in the probability of infection (Figure 3C), but fur-
and started to decrease from the week beginning 13 April, se- ther data would be required for confirmation. Together, these
roprevalence in primary care remained at a similar level after results suggest that while levels of infection by SARS-CoV-2
the week beginning 13 April to the end of our study period remained broadly constant from the introduction of the virus,
(Figure 2B). For some age groups (45–64 and 64–74 years) se- they were higher among men, 45–64-year-old patients, and
roprevalence was higher in men (Figure 2C), perhaps driven by those who attended secondary care.
a sex bias in SARS-CoV-2–associated hospitalization [17], since To determine whether exposure might elicit a protective im-
men admitted to secondary care services had a higher seroprev- mune response, HIV (SARS-CoV-2) pseudotypes were used to
alence (10.73%; 95% CI, 9.40%–12.17%) than women (7.60%; measure levels of neutralizing anti-SARS-CoV-2 antibodies in
6.51%–8.81%) (Figure 2C). This difference between sexes was samples collected between 24 March and 24 April (n = 1974;
not observed among primary care patients (6.06% [95% CI, 10.94% positive by ELISA). A total of 117 (54.17%) ELISA-positive
974 • jid 2021:223 (15 March) • Hughes et alA 15 15 15
Seroprevalence, %
Seroprevalence, %
Seroprevalence, %
10 10 10
5 5 5
0 0 0
Overall 18–44 45–64 65–74 ≥75 Overall Female Male Overall Primary Secondary
Age, y Sex Caretype
Downloaded from https://academic.oup.com/jid/article/223/6/971/6052401 by guest on 07 November 2021
B
20 Caretype
Primary
Secondary
15 Overall
Seroprevalence, %
10
5
0
ch
ch
ch
ril
ril
ril
ril
ril
ay
ay
Ap
Ap
Ap
Ap
Ap
M
M
ar
ar
ar
M
M
M
11
18
06
13
20
27
04
16
23
30
C
15 Sex 15 Caretype 15 Caretype
Female Primary Primary
Male Secondary Secondary
Seroprevalence, %
Seroprevalence, %
Seroprevalence, %
10 10 10
5 5 5
0 0 0
18–44 45–64 65–74 ≥75 Female Male 18–44 45–64 65–74 ≥75
Age, y Sex Age, y
Figure 2. Unadjusted severe acute respiratory syndrome coronavirus 2 (SARS-CoV-2) seroprevalence in NHS Greater Glasgow and Clyde, Scotland, United Kingdom,
patient population. A, B, Seroprevalence estimates and 95% confidence intervals are shown across age groups, sex. and healthcare setting (A), or date of sampling (B). C,
Seroprevalence estimates and 95% confidence intervals investigated in sequential combinations of age group, sex, and healthcare setting.
and 17 (0.97%) ELISA-negative samples exhibited high neutral- 1:50 dilution. Overall, our results suggest that approximately half
izing activity (Figure 4A). Serum samples were considered to have of those individuals who seroconverted elicited a highly neutral-
high neutralizing activity if they reduced infection by >90% at a izing response. Serum samples with higher absorbance levels in
SARS-CoV-2 Seroprevalence in a Patient Population • jid 2021:223 (15 March) • 975A B
0.5
Adjusted Secondary*
Weekly Seroprevalence No adjustment
0.4
COVID-19 deaths
Raw data Male*
0.3
≥75 y
0.2
65–74 y
0.1
45–64 y
0.0
16 March 06 April 27 April 18 May 0 2 4 6 8
Week (Start Date) OR Posterior Distribution
Downloaded from https://academic.oup.com/jid/article/223/6/971/6052401 by guest on 07 November 2021
C D
1.0
40 400
RT-PCR test
Weekly Probability of
0.8
COVID-19 Deaths
30 300
Infection
Positivity, %
0.6
20 200
0.4
Covid-19 Deaths
10 100
0.2
ELISA results
0 0
0.0
16 March 06 April 27 April 18 May 16 March 06 April 27 April 18 May
Week (Start Date) Week (start date)
Figure 3. Posterior estimates obtained from the bayesian state-space model. A, Model fit (observed data in red vs estimated unadjusted seroprevalence in black) and esti-
mated adjusted seroprevalence (gray). B, Odds ratios (ORs) of the effect sizes of age, sex and healthcare setting on the probability of a patient being seropositive for severe
acute respiratory syndrome coronavirus 2 (SARS-CoV-2) antibodies (95% confidence interval [CI] lines within violin). C, Estimated mean weekly probability of infection of the
studied population, and associated 75% and 95% CIs. D, Unadjusted SARS-CoV-2 seroprevalence (blue), reverse-transcription polymerase chain reaction (RT-PCR)–confirmed
coronavirus disease 2019 (COVID-19) cases (red), and COVID-19–related deaths (black) are shown. Abbreviation: ELISA, enzyme-linked immunosorbent assay.
ELISAs exhibited higher levels of virus neutralization (Figure 4A SARS-CoV-2 exposure during the first wave of the pandemic
and Supplementary Tables 2 and 3). remained broadly consistent over time (likely due to lockdown
In addition, serum samples derived from ELISA-positive pa- conditions), but heterogeneous among different groups of the
tients in secondary care displayed significantly higher mean Glasgow patient population. After adjustment for test sensi-
absorbance values (P = .004) (Figure 4B) and mean percentage tivity and specificity, the overall seroprevalence in the patient
neutralization than samples from antibody-positive patients in population of NHSGGC (5.29%) was similar to reports from
primary care (Figure 4C), implying that disease severity is as- community-based cross-sectional studies carried out during
sociated with a stronger and more effective antibody-mediated an equivalent period in other European cities, such as Geneva
response. Multivariable logistic regression models confirmed [19] and Madrid [20]. However, because our study relied on
that increasing absorbance values on ELISA were significantly analyses of residual biochemistry samples from a population
associated with neutralization (odds ratio, 1.15; 95% CI, 1.10– of individuals seeking healthcare including—but not exclu-
1.21; P ≤ .001), and that samples derived from secondary care sively—people who are more likely to be symptomatic with
had significantly higher odds of neutralizing ability than those SARS-CoV-2 infection than the general population, generali-
from primary care (6.77; 2.68–18.75; P ≤ .001) (Supplementary zation beyond the study population requires caution. For ex-
Tables 2 and 3). ample, male patients had a significantly higher risk of being
seropositive in our study, although this was not a feature of
DISCUSSION the previous community-based studies, likely reflecting a sex
Serological surveys are key to informing strategies aimed bias in COVID-19 presentation [21] or differences in social be-
at controlling the spread of disease. Our study showed that havior that led to increased exposure [22].
976 • jid 2021:223 (15 March) • Hughes et alTable 1. Observed and Adjusted Seroprevalences in the Different Demographic Groups of the Study Population
Seroprevalence, Mean (95% CI), %
Demographic Group Population Size Samples, No Unadjusted Adjusted COVID-19– Related Deaths, No. IFR, %
Sex
Male 459 189 3092 9.06 (8.07–10.12) 6.49 (.16–17.67) 606 NA
Female 494 556 3543 6.72 (5.92–7.59) 4.23 (.13–13.14) 627 NA
Care type
Primary NA 2531 5.69 (4.82–6.66) 2.95 (.10–8.23) NA NA
Secondary NA 4104 9.11 (8.25–10.04) 6.73 (.21–17.44) NA NA
Age group, y
18–44 455 739 1662 5.05 (4.05–6.22) 3.10 (.10–9.05) 8 0.06
45–64 310 813 2202 9.36 (8.17–10.65) 6.67 (.16–17.84) 103 0.50
65–74 106 435 1244 7.48 (6.08–9.08) 5.18 (.15–13.98) 164 2.97
>75 80 758 1527 8.84 (7.46–10.38) 5.78 (.17–14.96) 958 20.52
Downloaded from https://academic.oup.com/jid/article/223/6/971/6052401 by guest on 07 November 2021
Overall 953 745 6635 7.81 (7.17–8.48) 5.29 (.13–15.10) 1233 NA
Abbreviations: CI, confidence interval; COVID-19, coronavirus disease 2019; IFR, infection fatality rate; NA, not available.
It is important to note that 38% of samples were derived from secondary care patients showed both significantly higher
from patients attending primary care, and this proportion re- antibody levels and odds of neutralization capacity, our results
mained stable during the studied period. Under normal cir- suggest that disease severity may be associated with more effec-
cumstances, such samples would provide a cost-effective tive immune responses. However, antibody levels change over
method of obtaining samples for serosurveillance that are time and our results should be considered within this context.
broadly representative of the wider community [23]. However, Given the time frame of our study, our results are likely to rep-
the unprecedented changes to routine healthcare guidelines and resent the serological profiles of recent infections. Although our
health-seeking behavior [16] during the first wave of the pan- data set did not include clinical information on individual pa-
demic are likely to have altered the structure of this population tients, the emphasis on reduction of routine procedures and pri-
considerably. Patients in primary care were well enough to be oritization of patients with COVID-19 during lockdown makes
managed in the community and so might be subject to similar the secondary care population a suitable proxy for severe SARS-
exposure conditions as the general population. CoV-2 infections. Lower IgG and neutralizing responses in pri-
At the same time, groups that continued to be seen in primary mary care patients could also reflect sampling at earlier points
care for blood sampling, including pregnant women and those after infection. However, similar results linking disease severity
with chronic conditions, may have shielded during this period and immune response were reported [25–27].
and thus have had lower exposure than the general population. Neutralizing ability observed in a small number of ELISA-
The prevalence in this group may therefore be lower than the negative serum samples suggests that the presence of epitopes
expected community prevalence. Conversely, the probability of outside the SARS-CoV-2 S1 or RBDs may contribute to the
exposure for individuals from secondary care might be higher neutralizing response. We note that while there is evidence
than expected in the general population owing to the prioritiza- linking the presence of neutralizing antibodies with protection
tion of severe COVID-19 cases in hospital settings during this [28], any inferences between antibody levels and protective im-
period. In addition, some patients may have been in the early munity should be interpreted with caution. The determinants
stages of infection and may not have seroconverted at the time of a protective immune response to SARS-CoV-2 are unknown
of sampling, resulting in an underestimation of seroprevalence and recent studies have suggested that T-cell responses play an
in both healthcare settings. Overall, and with the aforemen- important role in SARS-CoV-2 immunity [29]. It has been pos-
tioned caveats, the seroprevalence observed in the primary care tulated that between 43% and 70% of the population needs to
subpopulation may be a better representation of the general be immune to SARS-CoV-2 to reach herd immunity [30, 31].
population than that observed in secondary care. Achieving such levels without vaccination is unlikely in the
Neutralization assays provided insight into postexposure short term, given that seroprevalence, even among secondary
antibody-mediated immunity. HIV (SARS-CoV-2) pseudotype- care patients who showed the highest seroprevalence, reached
based neutralization assays display a high correlation with live only 6.73% (95% CI, .21%–17.44%). The absence of a strong
virus-based assays [4]. Although we found a significant corre- neutralizing response in a large proportion of seropositive pa-
lation between antibody levels and neutralizing activity, we also tients raises questions regarding the protective nature of the
found, in agreement with other studies [24], that exposure to humoral immune response, highlighting the urgent need for
SARS-CoV-2 resulted in heterogenous responses. As samples further studies into the duration of neutralizing responses and
SARS-CoV-2 Seroprevalence in a Patient Population • jid 2021:223 (15 March) • 977A 50
54.17% 45.83%
40
Corrected Absorbance at 450 nm
30
20
Downloaded from https://academic.oup.com/jid/article/223/6/971/6052401 by guest on 07 November 2021
10
0.97% 99.03%
0
99.90 99.0 90 0
Neutralization, %
B Seropositive patients Seropositive patients
50 100
Corrected Absorbance at 450 nm
40
75
Neutralization, %
30
50
20
25
10
0 0
Primary Secondary Primary Secondary
C Seronegative patients Seronegative patients
8
Corrected Absorbance at 450 nm
100
6
75
Neutralization, %
4
50
2
25
0
0
Primary Secondary Primary Secondary
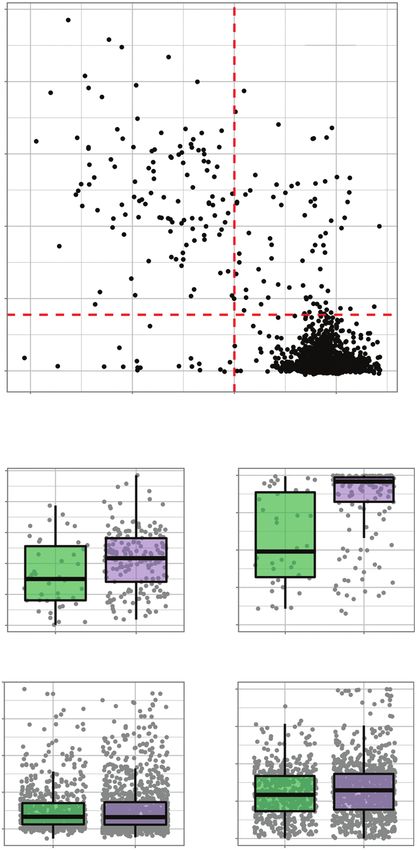
Figure 4. Antibody levels and subsequent virus neutralization activity suggest an association with disease severity. A, Correlation between virus neutralization and anti-
body production is shown as a scatterplot, where every sample is represented by a black dot. Percentages reflect the sample distribution among seropositive patients (green
numbers) and seronegative patients (red numbers), and between low (right) and high (left) virus neutralization. Enzyme-linked immunosorbent assay corrected-absorbance
(left) and virus neutralisation (right) values are shown in patients seropositive B or seronegative C for acute respiratory syndrome coronavirus 2.
978 • jid 2021:223 (15 March) • Hughes et althe relationship between IgG response, neutralizing antibody 4. Hyseni I, Molesti E, Benincasa L, et al. Characterisation of
levels, and protection from reinfection. SARS-CoV-2 lentiviral pseudotypes and correlation be-
Our study provides an insight into the demographic fac- tween pseudotype-based neutralisation assays and live
tors that influence SARS-CoV-2 exposure and immunity. virus-based micro neutralisation assays. Viruses 2020;
The low prevalence observed, combined with the hetero- 12:1011.
geneity of antibody-mediated neutralizing responses, sug- 5. World Health Organization. Establishment of the WHO
gests that in the absence of measures such as vaccination International Standard and Reference Panel for anti-SARS-
or nonpharmaceutical interventions, future waves of SARS- CoV-2 antibody. https://www.who.int/publications/m/
CoV-2 infection are likely to cause significant burden. Future item/WHO-BS-2020.2403. Accessed 18 November 2020.
developments in real-time community serological surveil- 6. Clapham H, Hay J, Routledge I, et al. Seroepidemiologic
lance systems linked with robust correlations of virus immu- study designs for determining SARS-COV-2 transmission
nity are necessary to design interventions and to prioritize and immunity. Emerg Infect Dis 2020; 26:1978–86.
those measures that safeguard public health at a minimal so- 7. Public Health Scotland. COVID-19 in Scotland. https://
Downloaded from https://academic.oup.com/jid/article/223/6/971/6052401 by guest on 07 November 2021
cietal and economic cost. public.tableau.com/profile/phs.covid.19#!/vizhome/COVID-
19DailyDashboard_15960160643010/Overview. Accessed 2
Supplementary Data July 2020.
Supplementary materials are available at The Journal of Infectious 8. Ng KW, Faulkner N, Cornish GH, et al. Preexisting and
Diseases online. Consisting of data provided by the authors to de novo humoral immunity to SARS-CoV-2 in humans.
benefit the reader, the posted materials are not copyedited and Science 2020; 370:1339–43.
are the sole responsibility of the authors, so questions or com- 9. Amanat F, Stadlbauer D, Strohmeier S, et al. A serological
ments should be addressed to the corresponding author. assay to detect SARS-CoV-2 seroconversion in humans. Nat
Med 2020; 26:1033–6.
Notes
10. Connor RI, Chen BK, Choe S, Landau NR. Vpr is required for
Acknowledgments. We thank Clare Orange, David Murray, efficient replication of human immunodeficiency virus type-1
Christine Willshire, Lisa Jarvis, and Giada Mattiuzzo for pro- in mononuclear phagocytes. Virology 1995; 206:935–44.
viding the serum samples required to carry out this work. We 11. Logan N, McMonagle E, Drew AA, et al. Efficient generation
also thank Matt Turnbull and Suzannah Rihn (MRC–University of vesicular stomatitis virus (VSV)-pseudotypes bearing
of Glasgow Centre for Virus Research) for providing the morbilliviral glycoproteins and their use in quantifying
pSCRPSY-hACE2 plasmid. virus neutralising antibodies. Vaccine 2016; 34:814–22.
Financial support. This work was supported by the Medical 12. R Core Team. R: a language and environment for statistical
Research Council of the United Kingdom (grant MC_ computing. Vienna, Austria: Statistical Software, 2013.
UU_12014/9), the Wellcome Trust (grant 217221/Z/19/Z), the 13. Bates D, Mächler M, Bolker B, Walker S. Fitting linear
Biotechnology and Biological Sciences Research Council (grant mixed-effects models using lme4. J Statistical Software
BB/R004250/1), the Francis Crick Institute (grant FC001061), 2015; 67.
Georgina Gardner Endowment (grant number 145813-01), 14. Viana M, Cleaveland S, Matthiopoulos J, et al. Dynamics
John Crawford endowment (grant number 123939-01), and the of a morbillivirus at the domestic-wildlife interface: canine
Department of Health and Social Care (grant BB/R019843/1). distemper virus in domestic dogs and lions. Proc Natl Acad
Potential conflicts of interest. All authors: No reported Sci U S A 2015; 112:1464–9.
conflicts. All authors have submitted the ICMJE Form for 15. Götzinger F, Santiago-García B, Noguera-Julián A, et al;
Disclosure of Potential Conflicts of Interest. Conflicts that the ptbnet COVID-19 Study Group. COVID-19 in children
editors consider relevant to the content of the manuscript have and adolescents in Europe: a multinational, multicentre co-
been disclosed. hort study. Lancet Child Adolesc Health 2020; 4:653–61.
16. Mulholland RH, Wood R, Stagg HR, et al. Impact of
References COVID-19 on accident and emergency attendances and
1. Coronavirus (COVID-19): Scotland’s route map. https:// emergency and planned hospital admissions in Scotland:
www.gov.scot/collections/coronavirus-covid-19-scotlands- an interrupted time-series analysis. J R Soc Med 2020;
route-map/. Accessed . 113:444–53.
2. Winter AK, Hegde ST. The important role of serology for 17. Docherty AB, Harrison EM, Green CA, et al; ISARIC4C
COVID-19 control. Lancet Infect Dis 2020; 20:758–9. investigators. Features of 20 133 UK patients in hos-
3. Zhao J, Yuan Q, Wang H, et al. Antibody responses to SARS- pital with COVID-19 using the ISARIC WHO Clinical
CoV-2 in patients with novel coronavirus disease 2019. Clin Characterisation Protocol: prospective observational co-
Infect Dis 2020; 71:2027–34. hort study. BMJ 2020; 369:m1985.
SARS-CoV-2 Seroprevalence in a Patient Population • jid 2021:223 (15 March) • 97918. Ward H, Atchison CJ, Whitaker M, et al. Antibody preva- activity in recovered COVID-19 patients. J Clin Microbiol
lence for SARS-CoV-2 in England following first peak of 2020; 58:e02005-20.
the pandemic: REACT2 study in 100 000 adults. medRxiv 25. Crawford KHD, Dingens AS, Eguia R, et al. Dynamics
[Preprint: not peer reviewed]. 21 August 2020. Available of neutralizing antibody titers in the months after SARS-
from https://www.medrxiv.org/content/10.1101/2020.08.1 CoV-2 infection. J Infect Dis 2020. Available from https://
2.20173690v2. doi.org/10.1093/infdis/jiaa618.
19. Stringhini S, Wisniak A, Piumatti G, et al. Seroprevalence 26. Guthmiller JJ, Stovicek O, Wang J, et al. SARS-CoV-2 in-
of anti-SARS-CoV-2 IgG antibodies in Geneva, Switzerland fection severity is linked to superior humoral immunity
(SEROCoV-POP): a population-based study. Lancet 2020; against the Spike. mBio 2020; 12:e02940–20.
396:313–9. 27. Roltgen K, Powell AE, Wirz OF, et al. Defining the fea-
20. Pollán M, Pérez-Gómez B, Pastor-Barriuso R, et al; ENE- tures and duration of antibody responses to SARS-CoV-2
COVID Study Group. Prevalence of SARS-CoV-2 in infection associated with disease severity and outcome. Sci
Spain (ENE-COVID): a nationwide, population-based Immunol 2020; 5:eabe0240.
Downloaded from https://academic.oup.com/jid/article/223/6/971/6052401 by guest on 07 November 2021
seroepidemiological study. Lancet 2020; 396:535–44. 28. Addetia A, Crawford KHD, Dingens A, et al. Neutralizing
21. Dudley JP, Lee NT. Disparities in age-specific morbidity antibodies correlate with protection from SARS-CoV-2 in
and mortality from SARS-CoV-2 in China and the Republic humans during a fishery vessel outbreak with high attack
of Korea. Clin Infect Dis 2020; 71:863–5. rate. J Clin Microbiol 2020; 58:e02107–20.
22. Bavel JJV, Baicker K, Boggio PS, et al. Using social and 29. Sekine T, Perez-Potti A, Rivera-Ballesteros O, et al.
behavioural science to support COVID-19 pandemic re- Robust T cell immunity in convalescent individuals with
sponse. Nat Hum Behav 2020; 4:460–71. asymptomatic or mild COVID-19. Cell 2020; 183:158–
23. Osborne K, Gay N, Hesketh L, Morgan-Capner P, Miller E. 168.e14.
Ten years of serological surveillance in England and Wales: 30. Britton T, Ball F, Trapman P. A mathematical model reveals
methods, results, implications and action. Int J Epidemiol the influence of population heterogeneity on herd immu-
2000; 29:362–8. nity to SARS-CoV-2. Science 2020; 369:846–9.
24. Luchsinger LL, Ransegnola B, Jin D, et al. Serological assays 31. Fontanet A, Cauchemez S. COVID-19 herd immunity:
estimate highly variable SARS-CoV-2 neutralizing antibody where are we? Nat Rev Immunol 2020; 20:583–4.
980 • jid 2021:223 (15 March) • Hughes et alYou can also read