SERIAL SYSTEM LTD 1H2021 RESULTS PRESENTATION - Friday, 13 August 2021
←
→
Page content transcription
If your browser does not render page correctly, please read the page content below

SERIAL SYSTEM LTD
1H2021 RESULTS PRESENTATION
                 Friday, 13 August 2021
FINANCIAL
  AGENDA                    RESULTS
By moving forward and
thinking forward,
Serial System helps its     OUTLOOK
partners to be more
competitive in the
marketplace, today and in   CORPORATE
the future                  OVERVIEW
FINANCIAL
RESULTS
Snapshot Of 1H2021
Performance
                    US$’000                                                                           1H2021                  1H2020                     Change (%)

                    Sales                                                                           438,288                  314,287                          39

                    Gross Profit                                                                     34,931                   19,280                          81

                    Gross Profit Margin (%)                                                             8.0                      6.1                      1.9 ppt
                    Net Profit/(Loss) After Tax                                                       5,837                   (4,483)                        NM
                    (Attributable to equity holders of the Company)

                    EPS/(LPS) - fully diluted (US cents)(1)                                            0.65                    (0.50)                        NM

                    NAV per share (US cents)(2)                                                     30/6/2021: 16.27                        31/12/2020: 15.81

 (1) Earnings/(loss) per ordinary share on a fully diluted basis are computed by dividing net profit attributable to equity holders of the Company by the weighted average number of shares in issue
     during the period of 895,841,914 after adjusting assumed conversion of all potential dilutive ordinary shares.

 (2) Net assets value per ordinary share as at 30 June 2021 and 31 December 2020 is calculated based on the net assets value attributable to the equity holders of the Company as at the end of the
     respective period and the respective aggregate number of ordinary shares of 895,841,914.
                                                                                                                                                                                                       4
1H2021 Highlights
Revenue of US$438.3M in 1H2021, lifted by recovery in all business segments
Revenue increased 39% y-o-y from US$314.3 million in 1H2020, when the initial outbreak of COVID-19 impacted demand for electronic components and
disrupted manufacturing activity in Asia, especially China
Sales for the electronic components distribution business increased 38% fuelled by increased global demand for semiconductors, particularly in Hong
Kong and China; improved business environment and global chip shortage playing out to the Group’s advantage in view of the Group’s extensive product
portfolio and strong presence in Asia, especially Hong Kong and China and the Group’s efforts to expand its base of suppliers and customers and its ability
to work closely with suppliers and customers for value creation
Turnover for consumer products distribution business sales rose 58%, as demand remains robust due to continued demand for computer peripherals in
Malaysia where new product launches from suppliers coincided with an increase in demand for desktop and portable computers and peripherals amid
adoption of work-from-home measures in compliance with the prolonged Movement Control Order
Turnover for other businesses increased to US$5.4 million from US$4.5 million a year ago, boosted by higher sales in the trading and distribution of fast-
moving consumer goods in Singapore and Malaysia, as well as higher sales in assembly and distribution of medical devices and hospitality and healthcare
solutions businesses driven by higher demand
Gross profit margin outpaced revenue growth, growing 81% to US$34.9M
Mainly due to higher margins achieved by the Group’s electronic components and consumer products distribution businesses with greater demand;
global chip shortage which resulted in many firms rushing to stockpile high demand chips also contributed to increased margin in the electronic
components distribution business
Net profit of US$5.8M in 1H2021, reversing loss of US$4.5M in 1H2020 5
Revenue Growth Trend
SERIAL SYSTEM GROUP

                                                            Revenue (US$' million)
1,600                                                                                                                                   1,527
                                                                                                                               1,492
                                                                                                                      1,403
1,400                                                                                                                              2%
                                                                                                              1,222
                                                                                                                          6%
1,200
                                                                                                      1,036       15%
1,000
                                                                                                          18%
                                                                                              817                                               792
 800                                                                                                27%                                                     731
                                                                                      658                                                   -48%
                                                                           616              24%
 600                                                               545                                                                                -8%
                                                                                 7%                                                                                       438.3
                                                354        382
 400                                      315                            13%                                                                                      314.3
                                    228
                  186   184   183                            43%
 200         92                                                                                                                                                       39%
        44                                            8%
   -

                                                                                                                                                                                  6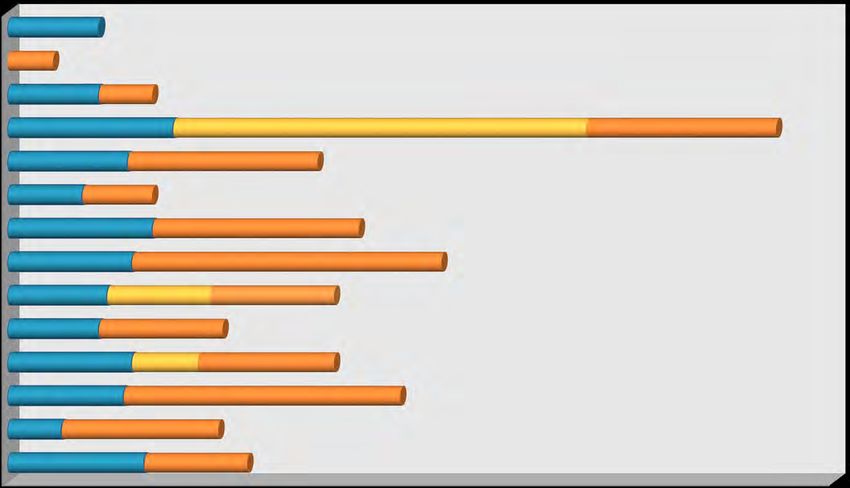
Profitability

                                                                      Gross Profit & Gross Profit Margin
                                                                                (US$' million)
    10.0%                          9.3%          9.5%                                                                                                                                    140.0
                          9.3%                               9.0%          8.7%
            8.7%
     9.0%                                                                                                                     7.8%
                                                                                                                                                                                  8.0%   120.0
                                                                                                                              118.6
     8.0%                                                                              7.5%               6.9%
                                                                                                                   7.0%
                                                                                                               105.1                         6.8%
     7.0%                                                                                          97.4                                                                                  100.0
                                                                                                                                                             6.3%
                                                                                                                        13%                                         6.1%
                                                                                      91.5
                                                                          90.4                            8%
     6.0%
                                                                                                                                                                                         80.0
                                                                                             6%
     5.0%
                                                             73.5                1%

                                                                    23%                                                                                                                  60.0
     4.0%                                       62.6
                                    57.5                                                                                                     54.2
                                                       17%
                          50.7
     3.0%                                                                                                                             -54%                 45.9                          40.0
                                           9%
                             13%                                                                                                                    -15%                          34.9
     2.0%    33.4
                    52%                                                                                                                                                     81%          20.0
     1.0%                                                                                                                                                            19.3

     0.0%                                                                                                                                                                                -
            FY09          FY10     FY11         FY12         FY13         FY14        FY15         FY16          FY17         FY18           FY19          FY20     1H20          1H21

                                                                                              GP                          GP%
                                                                                                                                                                                                 7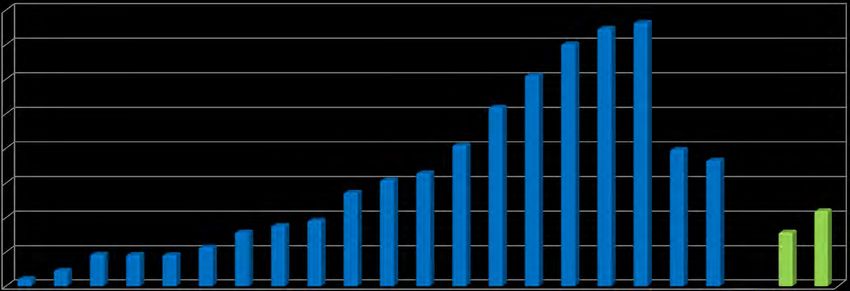
Profitability

                                                                  Net Profit & Net Profit Margin
                                                                          (US$' million)
    20.0              2.2%                                                                                                                                                                  2.5%
    18.0                                                                                                              17.7
                                                                                                                                                                                            2.0%
    16.0                        1.6%                               1.6%                                         85%
            1.3%                                        1.4%
    14.0                                      1.2%                                                                    1.2%                                                                  1.5%
                                                                                                                                                                               1.3%
                                                                   16.1          0.9%
    12.0
                      12.0                                                                               0.6%                             1.0%                                              1.0%
    10.0                                                       44%
                                10.1             41%                             11.0          0.3%                                 8.0                                                     0.5%
     8.0                                                11.2                                              9.6
                                              7.9                         -31%                                               -55%
     6.0                                                                                                                                                                              5.8
                                       -21%                                                       110%                                                  0.0%                                0.0%
     4.0    5.1          -16%                                                                   4.6
                                                                                                                                                 0.3                                        -0.5%
     2.0                                                                                -59%
               133%                                                                                                                   -97%
      -                                                                                                                                                                                     -1.0%
            FY09      FY10      FY11          FY12      FY13       FY14          FY15          FY16      FY17         FY18          FY19         FY20                  1H20       1H21
    (2.0)                                                                                                                                                      -1.4%
                                                                                                                                                                                            -1.5%
    (4.0)
                                                                                                                                                                       (4.5)
    (6.0)                                                                                                                                                                                   -2.0%

                                                     Net Profit                                Net Profit Margin (%)

                                                                                                                                                                                                    8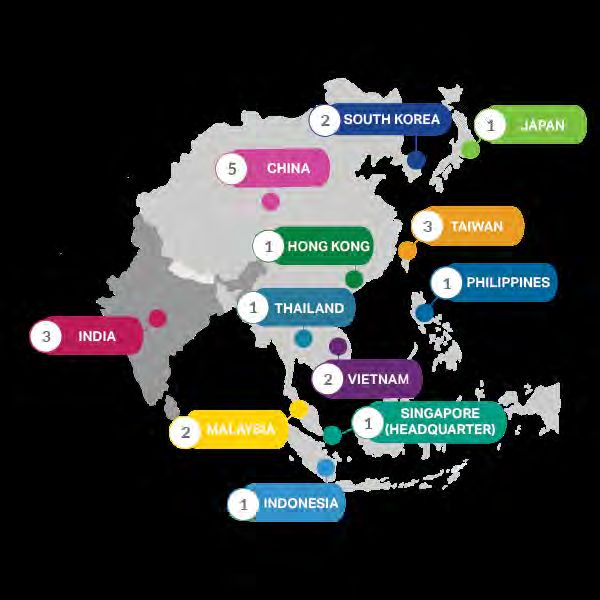
Profitability

                                                                                       EBITDA (US$' million)

      50.0

                                                                                                                            44.8
      45.0

      40.0

      35.0
                                                                                                                      64%
                                                                       30.8
      30.0
                                                                                                               27.4
                                                                                     26.0
                                                                                                  24.4                                    23.7
      25.0
                                                          22.0
                                                                              -15%                       12%
                       20.2     19.9
                                             18.9                                                                                  -47%
      20.0
                                                                 40%
                                                                                            -6%

      15.0                                          17%                                                                                                 13.2

                                       -5%                                                                                                                                10.3
      10.0   8.8                                                                                                                                 -44%
                          -2%                                                                                                                                    1,914%
       5.0
                130%
                                                                                                                                                                0.5
        -
             FY09      FY10     FY11         FY12         FY13         FY14          FY15         FY16         FY17         FY18          FY19          FY20   1H20       1H21

                                                                                                                                                                                 9
Financial Position
                                                           Maintaining Healthy Current Ratio
                                                                                                                                                                                          1.8
   500.0
                                                                                                                468.6
                                                                                                                                458.5
                                                                                                                                                                             1.5
                                                                                                                                                                                          1.6
                              1.5                                                               430.6
              1.4                         1.4                                                                                                   1.4          1.5
                                                                                                                        397.5
   400.0                                                                       382.6                                                                                                      1.4
                                                      1.3                                               372.0                         371.5
                                                               347.8                                               1.2          1.2                       340.8
                                                                       1.2        1.2              1.2                                        332.2                       330.6
                                                                                        324.1                                                                                             1.2
                                                                       295.6
   300.0
                                                   277.0                                                                                                                                  1.0

                                                                                                                                                  230.7           234.0
                           218.3       211.5           218.7                                                                                                                      214.9   0.8
   200.0
           173.8
                               147.5       147.0                                                                                                                                          0.6

                   120.7
                                                                                                                                                                                          0.4
   100.0

                                                                                                                                                                                          0.2

      -                                                                                                                                                                                   -
             FY10            FY11        FY12        FY13         FY14           FY15             FY16            FY17            FY18          FY19        FY20            1H21

                                                    Current Assets                               Current liabilities                            Current Ratio
                                                                                                                                                                                                10
Financial Position
Net Gearing Ratio
140%
180.0
166.5
116% 155.9 155.8 120%
160.0
112% 115% 151.7
147.2
108%
98% 138.0 139.3 145.0
140.0
144.5 100%
89% 122.2 124.8
120.2 119.4
120.0
104.5 110.0 105.8
80%
100.0 98.7 97.9
72%
86.5 68%
82.3
54% 60%
80.0 72.6
71.2 56%
60.0 56.3 48%
43% 40%
40.0 37.6
20%
20.0
- 0%
FY10 FY11 FY12 FY13 FY14 FY15 FY16 FY17 FY18 FY19 FY20 1H21
Shareholders' Equity Net Borrowings Net Gearing Ratio
11Financial Position
Cash Conversion Cycle (days)
125
113
115
105
96
95
87
85
84
72
75 69
70 67 66
66
62 67
65 58
58 56 61
66
55 55 61 60
51 51 54
51 41 53 49 46
45 42
44 38 37
36 33 41
38 32 40
35 40
35 29 29
25 31 33 32 33 33
30
FY10 FY11 FY12 FY13 FY14 FY15 FY16 FY17 FY18 FY19 FY20 1H21
Trade Receivable Turnover (days) Trade Payable Turnover (days) Inventory Turnover (days) Cash Conversion Cycle (days)
12Dividend Yield
1H21 0.22 1.6%
0.11 1.3% Total Dividend Payout (In Cent (SGD))
FY20
(Interim & Final) each year
FY19 0.22 0.13 4.3%
0.40 1.00 0.46 21.9%
FY18
FY17 0.29 0.46 4.6%
FY16 0.18 0.17 2.4%
0.35 0.50 6.3%
FY15
FY14 0.30 0.75 8.0%
FY13 0.24 0.25 0.30 6.3%
0.22 0.30 5.0%
FY12
FY11 0.30 0.16 0.33 7.9%
FY10 0.28 0.67 6.1%
FY09 0.13 0.38 8.5% Interim Special Final
0.33 0.25 8.9%
FY08
- 0.20 0.40 0.60 0.80 1.00 1.20 1.40 1.60 1.80 2.00
13OUTLOOK
Industry Outlook
Br igh t Spot s
Adoption of 5G, electric and autonomous vehicles and IoT
will increase demand for chip with more processing power
and memory storage
US-China ’tech war’ will drive demand for chips
Work-from-home measures in Malaysia expected to
continue, strengthening business momentum for consumer
products distribution segment
Un cer t ain t ies
Tension between China and the US
Global economy still volatile as countries struggle to
contain new COVID-19 variants
Rising shipping costs amid supply chain disruptionsGroup Outlook
• The Group will continue to focus efforts to expand
product portfolio, widen customer and supplier base
• Appointed as a distributor in Malaysia by Taiwan-
based Asrock, fortifying our position as the leading
motherboard and VGA distributor in Malaysia
• Added franchises for Singapore, Indonesia, China and
Taiwan with Netherlands-based Ultimaker, a 3D Printing
company
• Fortifying 3D printing segment through Asia-wide
franchise for Germany-based BASF to distribute 3D
printing filaments
• With continued focus on recovery strategies, 2H2021
expects to remain profitableCORPORATE OVERVIEW
Serial System At A Glance
                                                              Electronic
                                                             Components
                                       One of                   (91%)*

                                    Asia Pacific’s                      1H2021      1H2020

                                  largest electronic   Hong Kong
                                                       China
                                                                         51%
                                                                         16%
                                                                                       47%
                                                                                       14%
                               distribution networks   South East
                                                       Asia and India    19%           26%
                                                       South Korea       7%             4%
                                                       Taiwan            7%             9%
                                                                        100%           100%
                       Total Shares:
                        905 million

                       Free Float: 38%
                                               SERIAL                              Consumer Products
                                                                                         (8%)*
             Market Capitalisation: S$136M
             (As at 13 Aug 2021)
                                               SYSTEM
                                                                                              1H2021   1H2020
                                                  listed in                    South East
                                                                               Asia and
                 Dividend yield: 1-22% p.a.      Singapore                     India           96%     100%
                       over 14 years               in 1997                     Japan           4%       0%
                      (1H2021: 1.6%)

                                One of the largest          Wide product
                             electronic components       range and diversified                                  * Group Revenue
                                    distributor           customer portfolio
                                  listed on SGX

                                                                                                                                  18
Diversified Business
Supporting a network of global brands, Serial System is a leading distributor of electronic components in Asia and a dealer
for a variety of consumer products. It is also a strategic investor in businesses in healthcare, managed print services and
fast moving consumer products.
Electronic Components Consumer Products Managed Print
Distribution Distribution Services and 3D
Printing
Medical Devices Fast Moving
Hospitality and Assembly
Healthcare Solutions Consumer Products
and Distribution
19Strong Asia Pacific Presence
Extensive Distribution Network The Group’s offices and representations
CHINA JAPAN INDONESIA
23 Sales Offices North China Tokyo Jakarta
13 Warehouses Beijing
> 700 employees Qingdao MALAYSIA TAIWAN
in Asia Pacific Xi'an Penang Taipei
Kuala Lumpur Hsinchu
East China
Taichung
Shanghai PHILIPPINES
Manila THAILAND
South China
Bangkok
Shenzhen
SINGAPORE
HONG KONG (Headquarter)
VIETNAM
Ho Chi Minh
INDIA SOUTH KOREA Hanoi
Bangalore Seoul
New Delhi Daegu
Pune
One of the largest Asian geographical presence
(in terms of offices)
in the electronic distribution industry
20Group Structure
As at 31 July 2021
Note:
(1) Entities held by Serial System Ltd
(2) Entities held by SCE Enterprise Pte. Ltd.
(3) Entities held by Serial System International Pte. Ltd.
(4) Investment holding and trading, and rental of properties
(5) Excluded entities which are dormant, inactive or in process of liquidation
21Partnering Leading Suppliers
Electronic Components Distribution
… more than 90 Franchised Product Lines in Serial System Group
22Partnering Leading Suppliers
Consumer Products Distribution
23Consumer Products Distribution
Achieva Technology Group
The Group’s 100%-owned subsidiary: Achieva Technology Sdn. Bhd.
Major suppliers include AMD, AOC, Asrock, Gigabyte, Intel, MSI, Philips and ViewSonic
Achieva Technology works closely with partner brands to fulfil their distribution needs and provides a
onestop solution for their customers
In e-commerce, Achieva Technology maintains key channels on online platforms such as Qoo10 and Lazada,
giving them a strong presence in the region
Swift-Value Business Pte. Ltd.
The Group’s 100%-owned subsidiary: Swift-Value Business Pte. Ltd.
Major suppliers include Hewlett-Packard (HP), Epson and Canon products and also the authorized reseller of products from
major brands such as Fuji Xerox, Samsung and Panasonic
Swift-Value is the largest HP printer supplies distributor, having captured over 45% of the Singapore market.
They keep their top spot by maintaining close relationships with hundreds of customers, ranging from
heartland operators to large retail superstores such as Popular
Providing fast and value-added service and having the ability to retain customer loyalties help Swift-Value
offers an extensive and consistent network for their suppliers and partner brands
In 2020, Swift-Value has also partnered with Ultimaker, one of the leading 3D-Printer brands operating out of the Netherlands
to serve as their official logistics service provider in the Asia Pacific region and provide logistics distribution to partners and
resellers in countries including but not limited to Singapore, Australia, China and Indonesia
24Consumer Products Distribution
Managed Print Services and 3D Printing
Print-IQ Singapore Pte. Ltd.
Started in 2014, Singapore-based Print-IQ is 91.43% owned by Serial System
Provides managed print services and maintains and distributes copiers and printers
Premier partner for HP copiers
Partner for top Netherlands-based 3D printer brand, Ultimaker
Asia-wide partner for Germany-based BASF to distribute 3D printing filaments
Print IQ Co., Ltd
Set up in 2019, Print-IQ Thailand is 49% owned by Serial System since December 2019
Supplies Lexmark printers and toners and provides managed print services for their
customers
PT Sentral Mitra Informatika Tbk
Set up in 2008, PT SMI is 20% owned by Serial System since November 2018
Listed on Development Board of Indonesia Stock Exchange
Under the managed print services business model, companies outsource their printing,
scanning and copying functions, as well as the management of the equipment, to external
service providers like Print-IQ and PT SMI. This reduces their operating costs and wastage.0ther Businesses
Serial MultiVision Pte. Ltd. (100%-stake)
Core businesses: Hospitality and Healthcare solutions
Hospitality solutions: Build based on a core venue management application suite known as Venue360
Leading edge modules within Venue360: Electronic meal ordering system (eMOS), Intelligence Room
Infotainment Solution, Digital Media Content Management System, and Incident Tracking and Reporting System
Clients: Khoo Teck Puat Hospital, Ng Teng Fong General Hospital, Jurong Community Hospital, Changi General
Hospital, Institute of Mental Health, St Andrew’s Hospital, Gleneagles Hospital, Mount Elizabeth Orchard,
Parkway East Hospital, Parkway Mount Elizabeth Novena, Yishun Community Hospital, Sengkang Hospital,
Sengkang Community Hospital, Alexandra Integrated Health, Bright Vision Community Hospital, Ang Mo Kio
Thye Hwa Kwan Hospital and the new Woodlands Health Campus
Contract Sterilization Services Pte Ltd (100%-stake)
Assembly and distribution of medical devices
Offers full range of standard and customised perfusion tubing
packs marketed over the Asia-Pacific region:
Perfusion Tubing
ECMO Tubing Pack
Angio Pack
Procedural Pack
ISO 13485-certified and its perfusion products bear the coveted
CE certification mark.The presentation herein may contain forward-looking statements by the management of Serial System Ltd (“Serial System”) that pertain to expectations for financial performance of future periods versus past periods. Forward–looking statements involve certain risks and uncertainties because they relate to future events. Actual results may vary materially from those targeted, expected or projected due to several factors. Such factors are, among others, general economic conditions, foreign exchange fluctuations, competitive product and pricing pressures as well as changes in tax regimes and regulatory developments. Such statements are not and should not be construed as management’s representation on the future performance of Serial System. Therefore, the actual performance of Serial System may differ significantly from expressions provided herein. This presentation does not constitute an invitation or an offer to sell, or solicitation of an offer to buy any securities in connection with, any contract or commitment whatsoever. This presentation has been prepared exclusively for the parties presently being invited for the purposes of discussion. Information contained in this presentation does not constitute a prospectus or offering circular in whole or in part.
Thank You
Media and Investor Contact:

WeR1 Consultants Pte Ltd
1 Raffles Place #02-01 One Raffles Place Mall Suite 332
Singapore 048616
Tel: (65) 6721 7161
Isaac Tang, serialsystem@wer1.net

                                                          28
You can also read