SENTIMENT ANALYSIS ON ELECTRICITY TWITTER POSTS
←
→
Page content transcription
If your browser does not render page correctly, please read the page content below
S ENTIMENT A NALYSIS ON E LECTRICITY T WITTER P OSTS

                                                                                               A P REPRINT

                                                                                   Pardeep Kaur, Maryam Edalati
                                                                                   Department of Computer Science
                                                                            Norwegian University of Science and Technology
                                                                                          Gjøvik, Norway
arXiv:2206.05042v1 [cs.CL] 10 Jun 2022

                                                                            pardeeka@stud.ntnu.no, maryame@stud.ntnu.no

                                                                                              June 13, 2022

                                                                                              A BSTRACT

                                                  In today’s world, everyone is expressive in some way, and the focus of this project is on people’s
                                                  opinions about rising electricity prices in United Kingdom and India using data from Twitter, a
                                                  micro-blogging platform on which people post messages, known as tweets. Because many people’s
                                                  incomes are not good and they have to pay so many taxes and bills, maintaining a home has become a
                                                  disputed issue these days. Despite the fact that Government offered subsidy schemes to compensate
                                                  people electricity bills but it is not welcomed by people. In this project, the aim is to perform
                                                  sentiment analysis on people’s expressions and opinions expressed on Twitter. In order to grasp
                                                  the electricity prices opinion, it is necessary to carry out sentiment analysis for the government and
                                                  consumers in energy market. Furthermore, text present on these medias are unstructured in nature,
                                                  so to process them we firstly need to pre-process the data. There are so many feature extraction
                                                  techniques such as Bag of Words, TF-IDF (Term Frequency-Inverse Document Frequency), word
                                                  embedding, NLP based features like word count. In this project, we analysed the impact of feature
                                                  TF-IDF word level on electricity bills dataset of sentiment analysis. We found that by using TF-IDF
                                                  word level performance of sentiment analysis is 3-4 higher than using N-gram features. Analysis
                                                  is done using four classification algorithms including Naive Bayes, Decision Tree, Random Forest,
                                                  and Logistic Regression and considering F-Score, Accuracy, Precision, and Recall performance
                                                  parameters.

                                         Keywords Sentiment Analysis · Machine Learning · Electricity · opinion mining · polarity assessment

                                         1   Introduction

                                         Due to increase in contents over social media such as Twitter, Facebook and Trip advisor, expressing opinions about
                                         products, services and government policies among others has increased. Twitter has 336 million active users monthly
                                         and it is now a main source of feedback for government, private organizations and other service providers [1]. On
                                         Twitter around 500 millions tweets are produced per day with people sharing their joys and problems in their daily
                                         lives [1]. Twitter, a social media platform, has received a lot of attention from researchers in the recent times [2–5].
                                         Opinion mining and sentiment analysis domain has widely been studied extensively in many other fields including
                                         education [4, 6–12], movies [13–16], stock prediction [17–19], product reviews [20–22], tracking and understanding
                                         people’s reactions on pandemics on social media [23–25], etc. Many have started pivoting to social media to analyse
                                         emotions and collecting large twitter datasets [26]. Social media platforms play an essential role during the extreme
                                         crisis as individuals use these communication channels to share ideas, opinions, and reactions with others to cope
                                         with and react to crises [3]. The most common concern on Twitter these days is a rise in energy prices, such as
                                         electricity prices. Sharp spikes in electricity prices in recent times have been causing hardship for many households
                                         and businesses around the world and risk becoming a driver of social and political tensions,” said IEA Executive
                                         Director Fatih Birol. There are more people that are trying to figure out what to do as far as maintaining their household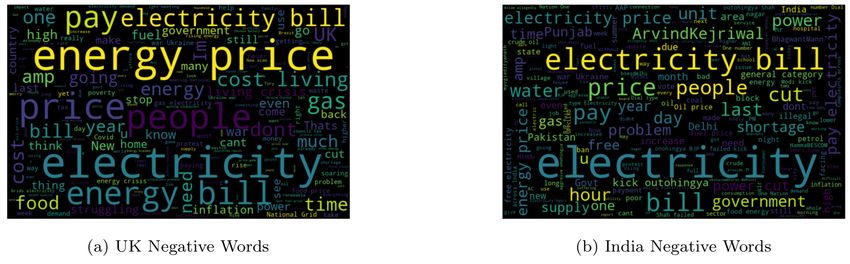
A PREPRINT - J UNE 13, 2022

and providing for their families, and so it’s really hard1 . With two thirds (66 percent) of adults in Britain reporting
their cost of living increased in the past month, rising energy prices are a growing factor in the squeeze on household
budgets2 .
Thousands of people have taken to the streets in the UK in protest against the sharp rise in energy prices, as a cab-
inet minister said the government could not “completely nullify” the increases. As a result, in this project, we will
investigate collective reactions to events expressed on social media. Because of its widespread popularity and ease of
access via the API, a special emphasis will be placed on analyzing people’s reactions to increases in electricity bills
expressed on Twitter’s social media platform. To that end, tweets from thousands of Twitter users were collected this
year after a sharp increase in energy prices in developed and developing countries to understand how different cultures
were reacting and responding to this situation.
The core contributions of this study are as following:

      1. Collecting a dataset composed of nearly 10000 tweets related to energy prices using Twitter API for academic
         research and the Python programming language.

      2. Selecting two different countries with various incomes, one developing country and one developed country.

      3. Using a lexicon-based sentiment analysis approach, i.e. TextBlob or Vader to calculate sentiment score and
         infer a sentiment polarity to each tweet (Positive, Neutral and Negative).

      4. Applying and comparing different machine and deep learning algorithms on the collected and curated dataset.

2   Related Work

Gas, coal and electricity prices have in recent weeks risen to their highest levels in decades [27]. The strong increases in
natural gas prices have prompted substantial switching to the use of coal rather than natural gas to generate electricity
in key markets, including the United States, Europe and Asia. The increased use of coal is in turn is driving up CO2
emissions from electricity generation globally [27].
The higher gas and coal prices, combined with rising European carbon prices, have resulted in higher electricity prices.
In Germany, electricity prices leaped last week to their highest level on record, up more than six times from a year
ago [28].
In India, the economic recovery and related increase in energy demand are causing a coal shortage. India’s domestic
coal mining, which accounts for 80% of the country’s supply, has been unable to keep pace with demand, and higher
international prices are making imports uneconomical. Power plants that rely on imported coal have slowed or even
halted operations, and some plants that rely on domestic coal are starting to run out. Despite government efforts
to address the shortages, several Indian states have suffered serious power shortages in recent days, affecting both
residential and industrial customers [27].
However Governments is coming up with interim solutions, such as lowering the tax rates and extra levies applied to
energy bills, which in some countries can make up half of the final price. The Spanish government has temporarily cut
the special electricity tax from 5.1% to 0.5% – the minimum under EU law [29].
Most empirical studies have used surveys and interviews to measure public opinion, sentiment, awareness and per-
ceptions of renewable energy. The literature finds broad public support for utility products across the United States,
Finland, Mexico, Spain, South Korea, Portugal, Greece and worldwide. Surveys and interviews have advantages in
gauging individual-level demographic information, such as gender, education, income, distance to energy facilities,
and previous experience with renewable energy such as electricity generation, technologies, which is one of the key
determinants of individuals’ preferences regarding utility bills [30].
However, surveys and interviews are limited in gauging temporal dynamics and geographical variations in public
opinions. Researchers are beginning to use social media, especially Twitter, to examine public sentiment toward
energy prices rising these days. Here, we compare four different machine learning techniques for sentiment analysis
and find that which model will achieve the higher accuracy than others for sentiment classification on electricity prices
related tweets.

                                                             2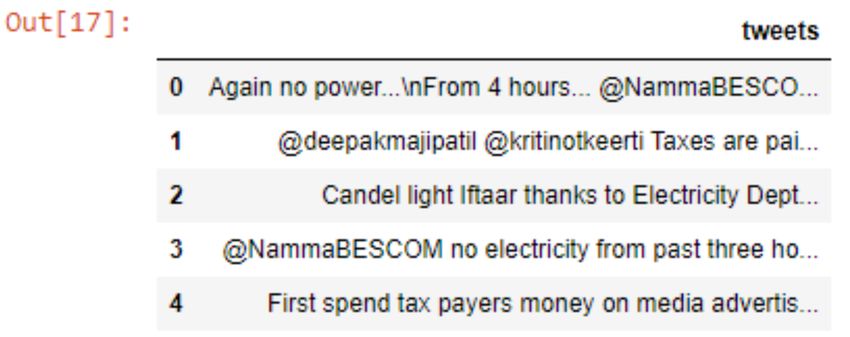
A PREPRINT - J UNE 13, 2022

                                         Figure 1: Evolution of energy prices, 2020-2021.

3         Twitter Sentiment Analysis Framework

3.1        Data collection

Data collection is the process of extracting tweets from social media, specifically Twitter, which is one of the most
popular social media platforms for sharing emotions and opinions. Using API provided by social media platform, ones
can collect data in a streaming fashion. An example is Twitter API that allows to extract tweets by hashtags, NewsAPI
to extract news by category from different news publishers.

3.2        Data processing

Data processing involves tokenization which is the process of splitting the tweets into individual words called tokens.
Tokens can be split using whitespace or punctuation characters. It can be unigram or bigram depending on the classi-
fication model used. The bag-of-words model is one of the most extensively used model for classification. It is based
on the fact of assuming text to be classified as a bag or collection of individual words with no link or interdependence.
      1
          https://www.nbcnews.com/news/us-news/-lot-people-need-help-soaring-electric-bills-leave-struggling-pay-rcna16347
      2
          https://www.bbc.com/news/business-60943192

                                                                   3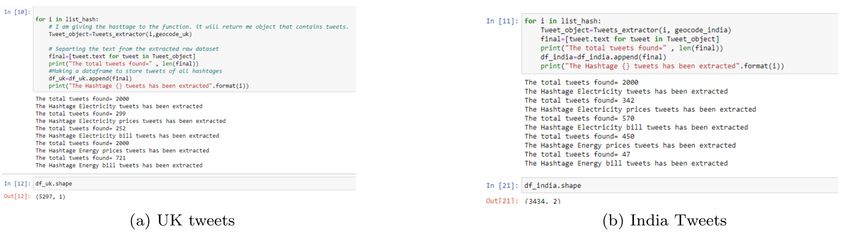
A PREPRINT - J UNE 13, 2022

                                 Figure 2: Framework for Twitter sentiment analysis.

The simplest way to incorporate this model in our project is by using unigrams as features. It is just a collection of
individual words in the text to be classified, so, we split each tweet using whitespace.

3.3   Data Filtering

The preprocessing of the data is a very important step as it decides the efficiency of the other steps down in line.
It involves syntactical correction of the tweets as desired. The steps involved should aim for making the data more
machine readable in order to reduce ambiguity in feature extraction [31]. Below are a few steps used for pre-processing
of tweets.

       • Converting upper case to lower case - In case we are using case sensitive analysis, we might take two oc-
         currence of same words as different due to their sentence case. It important for an effective analysis not to
         provide such misgivings to the model [31].
       • Stop word removal - Stop words that don’t affect the meaning of the tweet are removed (for example and, or,
         still etc.) [31].
       • Twitter feature removal - User names and URLs are not important from the perspective of future processing,
         hence their presence is futile. All usernames and URLs are converted to generic tags or removed.
       • Stemming - Replacing words with their roots, reducing different types of words with similar meanings. This
         helps in reducing the dimensionality of the feature set.
       • Special character and digit removal - Digits and special characters don’t convey any sentiment. Sometimes
         they are mixed with words, hence their removal can help in associating two words that were otherwise con-
         sidered different [31].

3.4   Feature Extraction

A feature is a piece of information that can be used as a characteristic which can assist in solving a problem (like
prediction). The quality and quantity of features is very important as they are important for the results generated by
the selected model [30]. Selection of useful words from tweets is feature extraction.

       • Unigram features – one word is considered at a time and decided whether it is capable of being a feature [31].
       • n-gram features – more than one word is considered at a time [31].
       • External lexicon – use of list of words with predefined positive or negative sentiment [31].

3.5   Sentiment Polarity

Each tweet is then labeled with a sentiment with two possible values: negative or positive. We used a list of English
positive and negative opinion words or sentiment words (around 7000 words). There exists a variety of sentiment
analysis algorithms able to capture positive and negative sentiment, some specifically designed for short, informal

                                                           4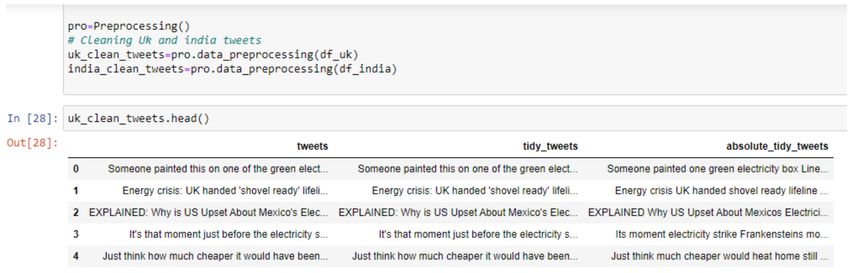
A PREPRINT - J UNE 13, 2022

texts. In this work, we first determined the sentiment polarity of each tweet where positive represents the positive
words count and negative the negative words count in the tweet. This variable captures well our assumptions about
the ordering of the sentiment values and the distances between them. In some cases, the measure polarity fails to
capture the degree of emotionality of the tweet because the positive and negative sentiment scores cancel out each
other (Sentiment score = 0, although the tweet is actually heavily emotional and not neutral as the measure might
indicate). Therefore, we used the following definition:
               T = 1 (positive tweet) if Sentiment score is greater than or equal to 0.1
               T = 0 (negative tweet) if Sentiment score is less than equal 0.1

4     Experimental Setup
The tools and libraries listed below were used to conduct this research work..

4.1   Python

Python is a high level, interpreted programming language which is very popular for its code readability and compact
line of codes. Python provides a large standard library which can be used for various applications for example natural
language processing, machine learning, data analysis etc. It is favored for complex projects, because of its simplicity,
diverse range of features and its dynamic nature [32].

4.2   NLTK

Natural Language toolkit (NLTK) is a library in python, which provides the base for text processing and classification.
Operations such as tokenization, tagging, filtering, text manipulation can be performed with the use of NLTK.
NLTK library is used for creating a bag-of words model, which is a type of unigram model for text. In this model,
the number of occurrences of each word is counted. The data acquired can be used for training classifier models. The
sentiment of the entire tweets is computed by assigning subjectivity score to each word using a sentiment lexicon.

4.3   Scikit learn

The Scikit-learn project started as scikits.learn, a Google Summer Code project by David Cournapeau. It is a powerful
library that provides many machine learning classification algorithms, efficient tools for data mining and data analysis.
Below are various functions that can be performed using this library [33]:

       • Classification - Identifying the category to which a particular object belongs.
       • Regression - Predicting a continuous-valued attribute associated with an object.
       • Clustering - Automatic grouping of similar objects into sets.
       • Dimension Reduction - Reducing the number of random variables under consideration.
       • Model selection - Comparing, validating and choosing parameters and models.
       • Preprocessing - Feature extraction and normalization in order to transform input data for use with machine
         learning algorithm.

In order to work with scikit-learn, it is required to install NumPy on the system.

4.4   Numpy

NumPy is the fundamental package for scientific computing with Python. It provides a high- performance multidi-
mensional array object, and tools for working with these arrays. It contains among other things [34]:

       • A powerful N-dimensional array object.
       • Sophisticated (broadcasting) functions
       • Tools for integrating C/C++ and Fortran code • Useful linear algebra, Fourier transform, and
       • Random number capabilities

                                                           5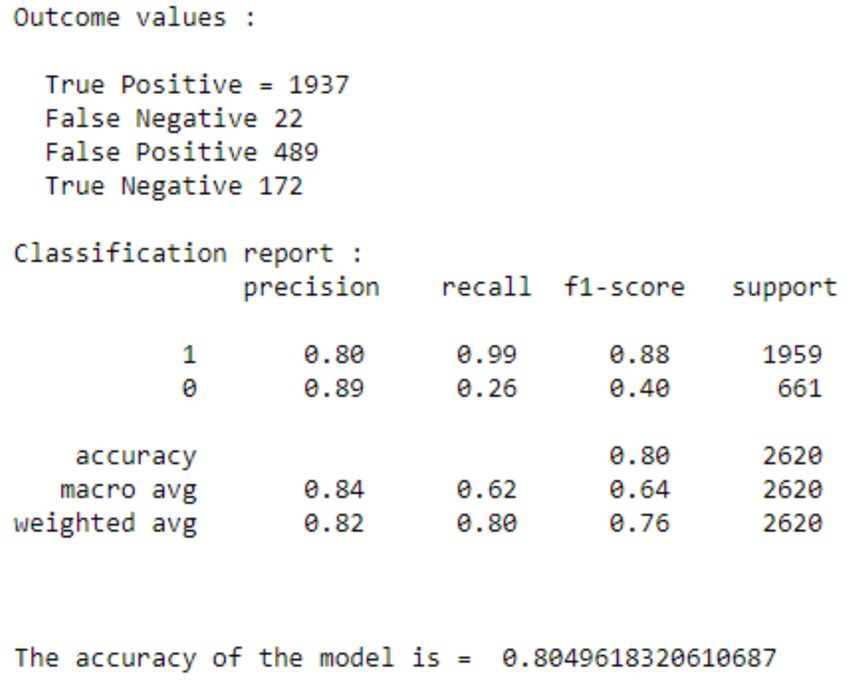
A PREPRINT - J UNE 13, 2022

5     Methodology

Data used in this study is from one main source - Twitter. Twitter has been a valuable source for opinion mining, but
the manual classification of a large number of tweets is difficult and time-consuming. Thus, we use NLP and ML
methods to automatically detect public opinion on raised electricity bills.

                            Figure 3: Electricity Tweets Sentiment Analysis Architecture.

Figure 3 shows the overall sentiment classification architecture of the lexicon based sentiment analysis that consist of
Tweets extractions or scraping from Twitter, the preprocessing of data, classifying sentiment using English, and the
evaluation of the model using the precision, recall, F-Score and the accuracy.

5.1   Tweets Extraction

The initial phase is the data gathering. The Twitter Application Program Interface (API) was used to collect tweets,
which are posts created by individuals on Twitter, specific to energy prices. Tweepy executes multiple queries contain-
ing trending keywords such as "Electricity tweets", "Electricity prices", "Electricity bill", "Energy bill", and "Energy
prices". The dataset comprises attributes like "the tweet’s text," "who sent the tweet," the date the tweet is created.
Total of 8731 tweets were collected from Twitter for this project using python programming in Jupyter Notebook from
two countries: United Kingdom and India.

                                            Country         Number of Tweets
                                        United Kingdom            5297
                                             India                3434
                                           Table 1: No. of tweets gathered

Table 1 shows the number of tweets for each country that includes UK and India tweets regarding electricity prices,
with 5297 and 3434 tweets for each country respectively. It is quite hard to extract data from twitter because of the
Twitter changes its API terms from time to time and you can only extract tweets for the last 7 days and you are only
allowed to scrape Twitter tweets every 15 minutes interval depending on your authentication method. We can use data
augmentation techniques to further generate more tweets globally [35–37], or to generate class-specific tweets [38].
We restricted the tweets limit to 2000 on each hashtag which we used in sentiment analysis. The tweets which contain
text, hyperlinks, different symbols, emoticons and short words like lol (laughing out loud) that makes a great challenge
when working with Twitter data. Here are the samples of the tweets we have extracted from Twitter using the above
mentioned keywords from both countries:

                                                           6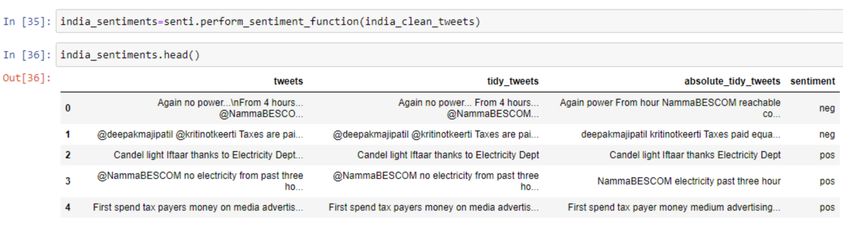
A PREPRINT - J UNE 13, 2022

                                            Figure 4: UK and India Tweets.

                                              Figure 5: Extracted tweets.

5.2   Text Preprocessing

The cleaning is quite complicated in Twitter tweets but in this project, we use some regular expression techniques to
clean our data. We have used findall() function finds *all* the matches and returns them as a list of strings, with each
string representing one match.

                                     Figure 6: Cleaned Tweets for UK and India.

5.3   Classify Sentiments

After the cleaning process, we can do the sentiment analysis. NLTK’s Sentiment Intensity Analyzer (VADER) is
used to know the sentiment type of every tweet. This is the lexicon based approach. Here, we used the function
sid.polarityscores(text) that takes text as an input and return the polarity score such as positive and negative.
Further, we saved the data in separate csv files for the UK and India with the polarity scores.

5.4   Story Generation and Visualization

Next, the csv file is read using python for both countries for the visualization of most common text posted on twitter
regarding electricity prices. WordCloud was used to generate a graphical representation of the most frequently appear-
ing words in the tweets such as positive and negative for both selected countries. WordCloud basically gave summary
of isolated words without knowing their linguistic meaning or relations.

                                                           7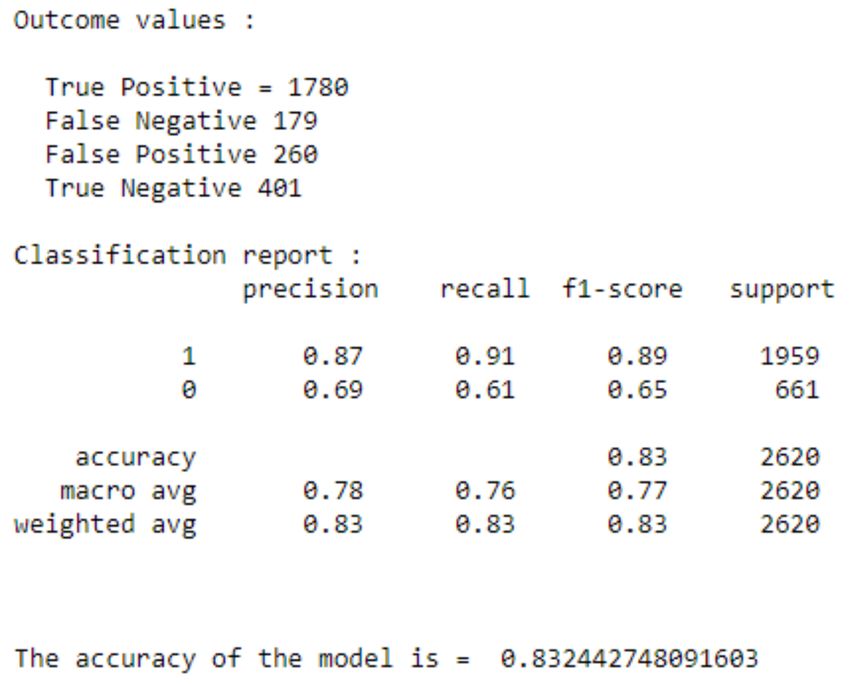
A PREPRINT - J UNE 13, 2022
Figure 7: Sentiment Analysis with two classes: Positive and Negative.
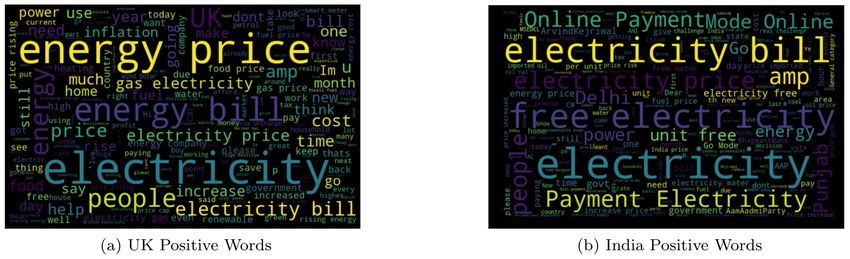
Figure 8: WordCloud of positive tweeets for UK and India.
In Figures 8 and 9 1959 tweets are classified as positive sentiment, and 661 tweets are classified as negative sentiment.
5.5 Feature Extraction
We need to convert textual representation in the form on numeric features. We have two popular techniques to perform
feature extraction:
• TF-IDF (Term Frequency - Inverse Document Frequency)
• N-Gram
In this study, we have used The term frequency- inverse document frequency (TF-IDF) which is a well-recognized
method to evaluate the importance of a word in a document. Term Frequency of a particular term (t) is calculated as
number of times a term occurs in a document to the total number of words in the document. IDF (Inverse Document
Frequency) is used to calculate the importance of a term. There are some terms like “is”, “an”, “and” etc. which occurs
frequently but don’t have importance. IDF is calculated as IDF (t) = log(N/DF), where N is the number of documents
and DF is the number of document containing term t. TF-IDF is a better way to convert the textual representation of
information into a Vector Space Model (VSM). Suppose there is a document which contains 200 words and out of these
200 words, like appears 10 times than term frequency will be 10/250=0.04 and suppose there are 50000 documents
and out of like. Than IDF (mouse) = 50000/500=100, and TF-IDF (like) will be 0.04*100=4.
We were limited to only bag of words. These features can further be incorporated with semantics [39–41] and vector
space representation models [42–46] to improve classification performance.
5.6 Model Building
Positive sentiments are labelled as 1 and negative sentiments are labelled as 0.
To validate the accuracy of the system, we used k-fold method and to measure the validity of the tweet confusion
matrix is used. In k-fold cross validation, the initial data is randomly partitioned into a subset (fold), each of the same
size. The training and testing process is done as many times as k. Figure 10 shows the confusion matrix which is used
to assist in calculation of the evaluation system [30].
Confusion Matrix is the visual representation of the Actual VS Predicted values. It measures the performance of our
Machine Learning classification model and looks like a table-like structure [27].
8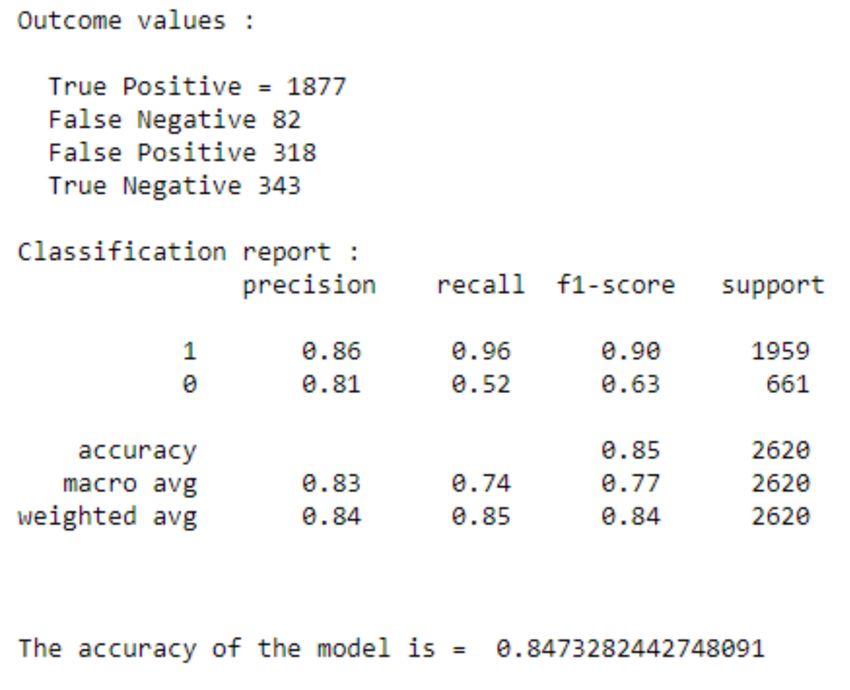
A PREPRINT - J UNE 13, 2022

                            Figure 9: WordCloud of negative tweeets for UK and India.

Elements of Confusion Matrix - It represents the different combinations of Actual VS Predicted values. Let’s define
them one by one.

      • TP: True Positive - The values which were actually positive and were predicted positive.
      • FP: False Positive - The values which were actually negative but falsely predicted as positive. Also known as
        Type I Error.
      • FN: False Negative - The values which were actually positive but falsely predicted as negative. Also known
        as Type II Error.
      • TN: True Negative - The values which were actually negative and were predicted negative. Next, once we
        know these values, we can calculate the precision and recall.

                                 Figure 10: Sentiment Analysis Confusion Matrix.

The metric that can be derived from the confusion matrix configuration:

      • Accuracy - The value of the entire true predicted against all predicted. The formula to obtain accuracy can be
        seen in equation.

                                                          TN + TP
                                      Accuracy =                                                                    (1)
                                                     TN + TP + FP + FN
      • Precision - The value of true positive prediction against all positive prediction. The formula to obtain preci-
        sion be seen in equation.

                                                                TP
                                             P recision =                                                           (2)
                                                              TP + FN

                                                          9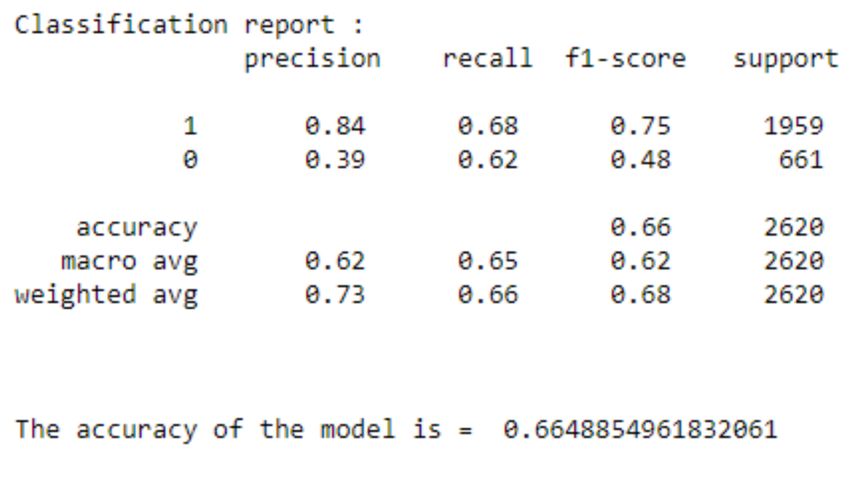
A PREPRINT - J UNE 13, 2022

       • Recall - The value of true positive prediction against all actual positive. The formula recall can be seen in
         equation.

                                                              TP
                                                 Recall =                                                            (3)
                                                            TP + FP

                                  Class         Precision Recall F1-score        Support
                                    1             0.87        0.91       0.89     1959
                                    0             0.69        0.61       0.65      661
                                Macro avg         0.78        0.76       0.77     2620
                               Weighted avg       0.83        0.83       0.83     2620
                                              Table 2: Classification report

6     Classifier
Majority of the algorithms for sentiment analysis are built from a classifier that was trained using a collection of
annotated text data. In this section, we presented the four classifiers used in this study for comparing the accuracy of
each model.

6.1   Naive Bayes Classifier

Naiıve Bayes (NB) classifier is a probabilistic classifier which is created based on Bayes theorem but with strong
assumptions regarding independence. It is used because of its simplicity aside from the fact that it is commonly used
for sentimental analysis application by predicting the words that belong to a class [47].

                                      Figure 11: Naive Bayes confusion matrix.

                                     Figure 12: Naive Bayes classification report.

                                                          10
A PREPRINT - J UNE 13, 2022
6.2 Decision Tree Classifier
Decision Tree (DT) classifier delivers a hierarchical decomposition of the training data space where the condition of
the attribute value is applied to for data division. It repetitively divides the working is plot into subpart by identifying
lines. It is a flowchart-like structure that is consists of an internal node that signifies a test on an attribute and branch
that signifies the test results and having the class labels or class distribution indicates the leaf nodes [47]. It is a
supervised classifier model which uses data with known labels to form the decision tree and then the model is applied
to the test data.
Figure 13: Decision Tree confusion matrix.
Figure 14: Decision Tree classification report.
6.3 Random Forest Classifier
Random forest, which were formally proposed in 2001 by Leo Breiman and Adele Cutler, are part of the automatic
learning techniques. This algorithm combines the concepts of random subspaces and ”bagging”. The decision tree
forest algorithm trains on multiple decision trees driven on slightly different subsets of data [48]. In random forest
classification method, many classifiers are generated from smaller subsets of the input data and later their individual
results are aggregated based on a voting mechanism to generate the desired output of the input data set [48].
6.4 Logistic Binary Classifier
Logistic Regression is a Machine Learning classification algorithm that is used to predict the probability of a cate-
gorical dependent variable [28]. It is used to determine the output or result when there are one or more than one
11A PREPRINT - J UNE 13, 2022
Figure 15: Random Forest confusion matrix.
Figure 16: Random Forest classification report.
independent variables. The output value can be in form of 0 or 1 i.e. in binary form [49]. This method is a generalized
linear regression method for learning a mapping from any number of numeric variables to a binary or probabilistic
variable [28].
6.5 ROC curve
AUC (Area Under The Curve) - ROC curve is a performance measurement for the classification problems at various
threshold settings. ROC is a probability curve and AUC represents the degree or measure of separability [50].
An excellent model has AUC near to the 1 which means it has a good measure of separability. A poor model has
an AUC near 0 which means it has the worst measure of separability. In fact, it means it is reciprocating the result.
It is predicting 0s as 1s and 1s as 0s. And when AUC is 0.5, it means the model has no class separation capacity
whatsoever.By analogy, the Higher the AUC, the better the model is at distinguishing [5]. When AUC is 0.7, it means
there is a 70% chance that the model will be able to distinguish between positive class and negative class such as we
can see in Figure 15 that decision tree and Random Forest are good in classification [50].
The worst case situation is when AUC is approximately 0.5, the model has no discrimination capacity to distinguish
between positive class and negative class. However all the classifier used in this research work are good to classify the
polarity of data that is negative and positive.
12A PREPRINT - J UNE 13, 2022
Figure 17: Logistic Binary confusion matrix.
Figure 18: Logistic Regression classification report.
7 Results
Table 3 shows the accuracy and runtime score of Dataset where Random forest and Decision Tree got the almost same
accuracy value i.e 0.84 and 0.83 with a little difference which means both classifiers can be used to attain a higher
percentage of accuracy while the Naive Bayes is only 0.66 and Logistic Regression 0.80
Model Accuracy
Naive Bayes 0.66
Decision Tree 0.83
Random Forest 0.84
Logistic Regression 0.80
Table 3: Accuracy obtained from different models
Figure 20 displays classification report for all models, where 1 represents positive sentiment and 0 represents negative
sentiment. It is clearly seen in the figure that Decision Tree and Random forest has the highest precision score whereas
Random Forest and Logistic Regression has the highest Recall value.
13A PREPRINT - J UNE 13, 2022
Figure 19: ROC Curve for all models.
Figure 20: Classification report for all models.
8 Limitations
Although we explored many machine learning models on analysing sentiments on the twitter data for electricity price
hikes, this study is limited due to the small number of available tweets. We only extracted tweets in English. If we are
to expand the search to other regions and to extract tweets in other languages for sentiment analysis [51–53], or use
multilingual translation approach [54], then we can increase more tweets.
We may further be able to improve upon the accuracy by balancing the dataset. Though, due limited number of
samples, we didn’t train and employ deep learning models, however, combining data augmentation techniques [38,55,
56] with data balancing [57–59], we can generate many more synthetic samples.
We have also only used bag of words. In latest techniques, word embeddings are widely used and employed [60].
With embedding-based models and a large corpora, we can easily employee deep learning models.
9 Conclusion
In this study, we discussed the sentiment analysis of public opinions towards hike in electricity prices, using tweet
data obtained from social media Twitter. In addition, we performed the text processing from data obtained and used
Naive Bayes, Decision Tree, Logistic Binary and Random Forest method to predict the class. From the results of our
experiments, it can be seen that the Random Forest model has a better accuracy level (i.e. 0.84) compared to using
other methods, such as Naive Bayes which only has an accuracy rate of 0.66 . Other models Decision tree and Logistic
Regression has good accuracy level to determine the negative sentient and positive sentiment achieving an accuracy of
0.83 and 0.80, respectively. For future work, we plan to analyze sentiment by incorporating the more complex models.
Further, would like to use advanced embedding models, take into account the semantics for improving the results.
14A PREPRINT - J UNE 13, 2022
Apart from data augmentation techniques, we will also include data from another social media, such as Facebook and
Instagram.
References
[1] R. Ahuja, A. Chug, S. Kohli, S. Gupta, and P. Ahuja, “The impact of features extraction on the sentiment
analysis,” Procedia Computer Science, vol. 152, pp. 341–348, 2019.
[2] V. S. Pagolu, K. N. Reddy, G. Panda, and B. Majhi, “Sentiment analysis of twitter data for predicting stock mar-
ket movements,” in 2016 international conference on signal processing, communication, power and embedded
system (SCOPES). IEEE, 2016, pp. 1345–1350.
[3] R. Batra, A. S. Imran, Z. Kastrati, A. Ghafoor, S. M. Daudpota, and S. Shaikh, “Evaluating polarity trend amidst
the coronavirus crisis in peoples’ attitudes toward the vaccination drive,” Sustainability, vol. 13, no. 10, p. 5344,
2021.
[4] B. Stamm and K. Loomis, “What does it mean to “engage” for learning on social media?: an analysis of global
read aloud twitter participation,” Journal of Research on Technology in Education, pp. 1–18, 2022.
[5] A. S. Imran, S. M. Daudpota, Z. Kastrati, and R. Batra, “Cross-cultural polarity and emotion detection using
sentiment analysis and deep learning on covid-19 related tweets,” Ieee Access, vol. 8, pp. 181 074–181 090,
2020.
[6] K. Zenun, A. Blend, A. Lubishtani, G. Fitim, and N. Engjéll, “Aspect-based opinion mining of students’ re-
views on online courses,” in Proceedings of the 2020 6th International Conference on Computing and Artificial
Intelligence. New York, NY, USA: ACM, 2020, p. 510–514.
[7] S. Sadriu, K. P. Nuci, A. S. Imran, I. Uddin, and M. Sajjad, “An automated approach for analysing students feed-
back using sentiment analysis techniques,” in Mediterranean Conference on Pattern Recognition and Artificial
Intelligence. Springer, 2022, pp. 228–239.
[8] M. Edalati, A. S. Imran, Z. Kastrati, and S. M. Daudpota, “The potential of machine learning algorithms for
sentiment classification of students’ feedback on mooc,” in Proceedings of SAI Intelligent Systems Conference.
Springer, 2021, pp. 11–22.
[9] L. Sandra, G. Gunarso, O. W. Riruma et al., “Are university students independent: Twitter sentiment analysis
of independent learning in independent campus using roberta base indolem sentiment classifier model,” in 2021
International Seminar on Machine Learning, Optimization, and Data Science (ISMODE). IEEE, 2022, pp.
249–253.
[10] Z. Kastrati, F. Dalipi, A. S. Imran, K. Pireva Nuci, and M. A. Wani, “Sentiment analysis of students’ feedback
with nlp and deep learning: A systematic mapping study,” Applied Sciences, vol. 11, no. 9, p. 3986, 2021.
[11] N. Altrabsheh, M. M. Gaber, and M. Cocea, “Sa-e: sentiment analysis for education,” in International conference
on intelligent decision technologies, vol. 255, 2013, pp. 353–362.
[12] Z. Kastrati, A. S. Imran, and A. Kurti, “Weakly supervised framework for aspect-based sentiment analysis on
students’ reviews of moocs,” IEEE Access, vol. 8, pp. 106 799–106 810, 2020.
[13] N. M. Ali, M. M. Abd El Hamid, and A. Youssif, “Sentiment analysis for movies reviews dataset using deep
learning models,” International Journal of Data Mining & Knowledge Management Process (IJDKP) Vol, vol. 9,
2019.
[14] M. Yasen and S. Tedmori, “Movies reviews sentiment analysis and classification,” in 2019 IEEE Jordan Inter-
national Joint Conference on Electrical Engineering and Information Technology (JEEIT). IEEE, 2019, pp.
860–865.
[15] M. Y. A. Salmony and A. R. Faridi, “Bert distillation to enhance the performance of machine learning models for
sentiment analysis on movie review data,” in 2022 9th International Conference on Computing for Sustainable
Global Development (INDIACom). IEEE, 2022, pp. 400–405.
[16] V. Jain et al., “Prediction of movie success using sentiment analysis of tweets,” The International Journal of Soft
Computing and Software Engineering, vol. 3, no. 3, pp. 308–313, 2013.
[17] T. H. Nguyen, K. Shirai, and J. Velcin, “Sentiment analysis on social media for stock movement prediction,”
Expert Systems with Applications, vol. 42, no. 24, pp. 9603–9611, 2015.
[18] R. Feldman, B. Rosenfeld, R. Bar-Haim, and M. Fresko, “The stock sonar—sentiment analysis of stocks based
on a hybrid approach,” in Proceedings of the AAAI Conference on Artificial Intelligence, vol. 25, no. 2, 2011, pp.
1642–1647.
15A PREPRINT - J UNE 13, 2022
[19] P. Bapat, “A comprehensive review of sentiment analysis of stocks,” International Journal of Computer Applica-
tions, vol. 106, no. 18, 2014.
[20] X. Fang and J. Zhan, “Sentiment analysis using product review data,” Journal of Big Data, vol. 2, no. 1, pp.
1–14, 2015.
[21] M. Bibi, W. A. Abbasi, W. Aziz, S. Khalil, M. Uddin, C. Iwendi, and T. R. Gadekallu, “A novel unsupervised en-
semble framework using concept-based linguistic methods and machine learning for twitter sentiment analysis,”
Pattern Recognition Letters, vol. 158, pp. 80–86, 2022.
[22] W. Zhao, Z. Guan, L. Chen, X. He, D. Cai, B. Wang, and Q. Wang, “Weakly-supervised deep embedding for
product review sentiment analysis,” IEEE Transactions on Knowledge and Data Engineering, vol. 30, no. 1, pp.
185–197, 2017.
[23] K.-W. Fu, H. Liang, N. Saroha, Z. T. H. Tse, P. Ip, and I. C.-H. Fung, “How people react to zika virus outbreaks
on twitter? a computational content analysis,” American Journal of Infection Control, vol. 44, no. 12, pp. 1700–
1702, 2016.
[24] Z. Kastrati, L. Ahmedi, A. Kurti, F. Kadriu, D. Murtezaj, and F. Gashi, “A deep learning sentiment analyser for
social media comments in low-resource languages,” Electronics, vol. 10, no. 10, 2021.
[25] Z. B. Nezhad and M. A. Deihimi, “Twitter sentiment analysis from iran about covid 19 vaccine,” Diabetes &
Metabolic Syndrome: Clinical Research & Reviews, vol. 16, no. 1, p. 102367, 2022.
[26] R. Batra, Z. Kastrati, A. S. Imran, S. M. Daudpota, and A. Ghafoor, “A large-scale tweet dataset for urdu text
sentiment analysis,” 2021.
[27] C. F. Alvarez and G. Molnar, “What is behind soaring energy prices and what happens next?” 2021.
[28] H. Hasanli and S. Rustamov, “Sentiment analysis of azerbaijani twits using logistic regression, naive bayes and
svm,” in 2019 IEEE 13th International Conference on Application of Information and Communication Technolo-
gies (AICT). IEEE, 2019, pp. 1–7.
[29] F. Heller. (2021) Spanish power companies clash with government over measures
to reduce electricity bill. [Online]. Available: https://www.euractiv.com/section/electricity/news/
spanish-power-companies-clash-with-government-over-measures-to-reduce-electricity-bill/
[30] S. Y. Kim, K. Ganesan, P. Dickens, and S. Panda, “Public sentiment toward solar energy—opinion mining of
twitter using a transformer-based language model,” Sustainability, vol. 13, no. 5, p. 2673, 2021.
[31] B. Gupta, M. Negi, K. Vishwakarma, G. Rawat, P. Badhani, and B. Tech, “Study of twitter sentiment analysis
using machine learning algorithms on python,” International Journal of Computer Applications, vol. 165, no. 9,
pp. 29–34, 2017.
[32] W. Ramadhan, S. A. Novianty, and S. C. Setianingsih, “Sentiment analysis using multinomial logistic regression,”
in 2017 International Conference on Control, Electronics, Renewable Energy and Communications (ICCREC).
IEEE, 2017, pp. 46–49.
[33] F. Pedregosa, G. Varoquaux, A. Gramfort, V. Michel, B. Thirion, O. Grisel, M. Blondel, P. Prettenhofer, R. Weiss,
V. Dubourg, J. Vanderplas, A. Passos, D. Cournapeau, M. Brucher, M. Perrot, and E. Duchesnay, “Scikit-learn:
Machine learning in Python,” Journal of Machine Learning Research, vol. 12, pp. 2825–2830, 2011.
[34] C. R. Harris, K. J. Millman, S. J. Van Der Walt, R. Gommers, P. Virtanen, D. Cournapeau, E. Wieser, J. Taylor,
S. Berg, N. J. Smith et al., “Array programming with numpy,” Nature, vol. 585, no. 7825, pp. 357–362, 2020.
[35] A. S. Imran, R. Yang, Z. Kastrati, S. M. Daudpota, and S. Shaikh, “The impact of synthetic text generation for
sentiment analysis using gan based models,” Egyptian Informatics Journal, 2022.
[36] J. Wei and K. Zou, “Eda: Easy data augmentation techniques for boosting performance on text classification
tasks,” arXiv preprint arXiv:1901.11196, 2019.
[37] C. Shorten, T. M. Khoshgoftaar, and B. Furht, “Text data augmentation for deep learning,” Journal of big Data,
vol. 8, no. 1, pp. 1–34, 2021.
[38] N. Fatima, A. S. Imran, Z. Kastrati, S. M. Daudpota, A. Soomro, and S. Shaikh, “A systematic literature review
on text generation using deep neural network models,” IEEE Access, 2022.
[39] Z. Kastrati, A. S. Imran, and S. Yildirim-Yayilgan, “Semcon: a semantic and contextual objective metric for
enriching domain ontology concepts,” International Journal on Semantic Web and Information Systems (IJSWIS),
vol. 12, no. 2, pp. 1–24, 2016.
16A PREPRINT - J UNE 13, 2022
[40] X. Lu, B. Zheng, A. Velivelli, and C. Zhai, “Enhancing text categorization with semantic-enriched representation
and training data augmentation,” Journal of the American Medical Informatics Association, vol. 13, no. 5, pp.
526–535, 2006.
[41] Z. Kastrati, A. S. Imran, and S. Y. Yayilgan, “Semcon: semantic and contextual objective metric,” in Proceedings
of the 2015 IEEE 9th International Conference on Semantic Computing (IEEE ICSC 2015). IEEE, 2015, pp.
65–68.
[42] Z. Kastrati and A. S. Imran, “Performance analysis of machine learning classifiers on improved concept vector
space models,” Future Generation Computer Systems, vol. 96, pp. 552–562, 2019.
[43] M. Parraguez and A. Oktaç, “Construction of the vector space concept from the viewpoint of apos theory,” Linear
algebra and its applications, vol. 432, no. 8, pp. 2112–2124, 2010.
[44] H. Guo, “Nonlinear mixup: Out-of-manifold data augmentation for text classification,” in Proceedings of the
AAAI Conference on Artificial Intelligence, vol. 34, no. 04, 2020, pp. 4044–4051.
[45] Z. Kastrati, A. S. Imran, and S. Y. Yayilgan, “An improved concept vector space model for ontology based
classification,” in 2015 11th International Conference on Signal-Image Technology & Internet-Based Systems
(SITIS). IEEE, 2015, pp. 240–245.
[46] K. Erk, “Vector space models of word meaning and phrase meaning: A survey,” Language and Linguistics
Compass, vol. 6, no. 10, pp. 635–653, 2012.
[47] J. O. Contreras, M. A. Ballera, A. C. Lagman, and J. G. Raviz, “Lexicon-based sentiment analysis with pattern
matching application using regular expression in automata,” in Proceedings of the 6th International Conference
on Information Technology: IoT and Smart City, 2018, pp. 31–36.
[48] Y. Al Amrani, M. Lazaar, and K. E. El Kadiri, “Random forest and support vector machine based hybrid approach
to sentiment analysis,” Procedia Computer Science, vol. 127, pp. 511–520, 2018.
[49] A. Tyagi and N. Sharma, “Sentiment analysis using logistic regression and effective word score heuristic,” Inter-
national Journal of Engineering and Technology (UAE), vol. 7, no. 2, pp. 20–23, 2018.
[50] G. A. Ruz, P. A. Henríquez, and A. Mascareño, “Sentiment analysis of twitter data during critical events through
bayesian networks classifiers,” Future Generation Computer Systems, vol. 106, pp. 92–104, 2020.
[51] B. A. Chandio, A. S. Imran, M. Bakhtyar, S. M. Daudpota, and J. Baber, “Attention-based ru-bilstm sentiment
analysis model for roman urdu,” Applied Sciences, vol. 12, no. 7, p. 3641, 2022.
[52] P. Arora et al., “Sentiment analysis for hindi language,” MS by Research in Computer Science, 2013.
[53] P. Pandey and S. Govilkar, “A framework for sentiment analysis in hindi using hswn,” International Journal of
Computer Applications, vol. 119, no. 19, 2015.
[54] A. Ghafoor, A. S. Imran, S. M. Daudpota, Z. Kastrati, R. Batra, M. A. Wani et al., “The impact of translating
resource-rich datasets to low-resource languages through multi-lingual text processing,” IEEE Access, vol. 9, pp.
124 478–124 490, 2021.
[55] P. Liu, X. Wang, C. Xiang, and W. Meng, “A survey of text data augmentation,” in 2020 International Conference
on Computer Communication and Network Security (CCNS). IEEE, 2020, pp. 191–195.
[56] S. Kobayashi, “Contextual augmentation: Data augmentation by words with paradigmatic relations,” arXiv
preprint arXiv:1805.06201, 2018.
[57] S. Shaikh, S. M. Daudpota, A. S. Imran, and Z. Kastrati, “Towards improved classification accuracy on highly
imbalanced text dataset using deep neural language models,” Applied Sciences, vol. 11, no. 2, p. 869, 2021.
[58] N. Tepper, E. Goldbraich, N. Zwerdling, G. Kour, A. A. Tavor, and B. Carmeli, “Balancing via generation
for multi-class text classification improvement,” in Findings of the Association for Computational Linguistics:
EMNLP 2020, 2020, pp. 1440–1452.
[59] M. Son, S. Jung, S. Jung, and E. Hwang, “Bcgan: A cgan-based over-sampling model using the boundary class
for data balancing,” The Journal of Supercomputing, vol. 77, no. 9, pp. 10 463–10 487, 2021.
[60] Z. Kastrati, A. Kurti, and A. S. Imran, “Wet: Word embedding-topic distribution vectors for mooc video lectures
dataset,” Data in brief, vol. 28, p. 105090, 2020.
17You can also read