Sensitivity analysis of input ground motion on surface motion parameters in high seismic regions: a case of Bhutan Himalaya - NHESS
←
→
Page content transcription
If your browser does not render page correctly, please read the page content below
Nat. Hazards Earth Syst. Sci., 22, 1893–1909, 2022
https://doi.org/10.5194/nhess-22-1893-2022
© Author(s) 2022. This work is distributed under
the Creative Commons Attribution 4.0 License.

Sensitivity analysis of input ground motion on surface motion
parameters in high seismic regions: a case of Bhutan Himalaya
Karma Tempa1 , Komal Raj Aryal2 , Nimesh Chettri1 , Giovanni Forte3 , and Dipendra Gautam4,5,6
1 Civil Engineering Department, College of Science and Technology, Royal University of Bhutan, Phuentsholing, Bhutan
2 Faculty of Resilience, Rabdan Academy, Abu Dhabi, United Arab Emirates
3 Department of Civil, Environmental and Architectural Engineering (DICEA), University of Naples Federico II, Naples, Italy
4 Department of Civil Engineering, Cosmos College of Management and Technology, Lalitpur, Nepal
5 Department of Civil Engineering, Institute of Engineering, Thapathali Campus, Tribhuvan University, Kathmandu, Nepal
6 Interdisciplinary Research Institute for Sustainability, Kathmandu, Nepal

Correspondence: Dipendra Gautam (dipendra01@tcioe.edu.np)

Received: 28 September 2021 – Discussion started: 22 October 2021
Revised: 7 May 2022 – Accepted: 19 May 2022 – Published: 7 June 2022

Abstract. Historical earthquakes demonstrate that strong            1   Introduction
motion characteristics and local soil condition, when cou-
pled, significantly influence seismic site response. Interest-
ingly, most of the Himalayan earthquakes depicted anoma-            Bhutan is located in the eastern fringe of the Hindu Kush
lous behavior per the site conditions historically. Being one       Himalaya. Historical earthquakes that occurred in the Hindu
of the most active seismic regions on earth, the eastern fringe     Kush Himalayan region have resulted in enormous losses and
of the Himalaya has observed many devastating earthquakes           damage (Gautam et al., 2016). Akin to the historical earth-
together with non-uniform damage scenarios. To quantify             quakes, the impending earthquakes are certain to strike the
such anomalies, we evaluate surface motion parameters for           region and result in detrimental consequences. The eastern
a soft soil deposit located in the city of Phuentsholing in         fringe of the Himalaya, i.e., Bhutan, and neighboring ar-
western Bhutan. Using one-dimensional site response anal-           eas were strongly shaken by significant earthquakes in the
ysis, the sensitivity of ground motion variation is estimated.      past; however, most of the earthquakes that occurred up to
This study accounts for the earthquakes of moment magni-            the 18th century are not well documented. The most re-
tudes 6.6 to 7.5 with a wide variation in peak ground accel-        cent events such as on 5 April 2021 (Mw = 5.0) in Samtse
eration (PGA). To dissect the characteristics of six inputted       (South Bhutan) and the September 2009 Mongar earthquake
ground motions on eight local ground conditions, a sensitiv-        (Mw = 6.7) in eastern Bhutan resulted in widespread dam-
ity analysis is performed statistically. The statistical correla-   age to Bhutan and neighboring regions. These earthquakes
tion of the response datasets and the linear regression model       caused major damage in the eastern parts of Bhutan and
of the bedrock outcrop and the surface motion spectral ac-          considerably affected the other parts of the country (Chet-
celeration along the stratified depth are examined to quantify      tri et al., 2021a, b). All the past earthquakes highlighted
the variation in surface motion parameters. The results high-       anomalous damage patterns to structures and infrastructures
light that the strong motions with PGA greater than 0.34 g          in various parts of the country, especially in the plain ar-
demonstrate greater sensitivity, leading to some anomalies in       eas. This evidence indicates the likely local site effect in
response parameters, especially amplification. Similar results      Bhutan. So far, few studies on local seismic response have
were obtained for the low PGA range (< 0.1 g).                      been in Bhutan, using a single strong motion record, but the
                                                                    reported studies mainly focus on the role of bedrock depth
                                                                    in ground response parameters (Tempa et al., 2020; Tempa et
                                                                    al., 2021a, b). The ground motion response analysis may not
                                                                    adequately address the accuracy in predicting the response

Published by Copernicus Publications on behalf of the European Geosciences Union.
1894                                                                 K. Tempa et al.: Sensitivity analysis of input ground motion

when the information is limited regarding site characteristics         Main Himalayan Thrust (MHT), which runs along the entire
and their variations within the same soil column (Stevens et           length of the Himalayan arc. A historical earthquake cata-
al., 2020). In the case of data-scarce regions such as Bhutan,         log (see Fig. 1a) indicates that Bhutan has experienced sev-
the variation in terms of material characteristics can be possi-       eral earthquakes of moment magnitude greater than 5 since
bly accounted for using sensitivity analysis. For this reason,         the early 1900s, among them, the 1915 Trashigang (Mw =
this study quantifies the characteristics and effects of sev-          6.6), 1954 Trashiyangtse (Mw = 6.4), and the 2009 Mon-
eral strong ground motions. Seismic ground response anal-              gar (Mw = 6.1) earthquakes are the most notable ones. The
ysis fall in the grade III approach of microzonation studies           2011 Sikkim–Nepal earthquake (Mw = 6.9) also caused no-
(e.g., ISSMGE, 1999; Licata et al., 2019). It is a widely used         ticeable damage to building stocks in Bhutan (Chettri et al.,
method by researchers for various applications in order to             2021a). The earthquakes in the vicinity of the study area
capture local ground effects or site conditions that can af-           (Phuentsholing) include the 1981 Dagana (Mw = 5.1) earth-
fect the estimate of ground motion characteristics (Chavez-            quake and the 2003 Haa earthquake (Mw = 5.5). The most
Garcia et al., 1990; Lopez-Caballero et al., 2012; Gautam              recent event occurred in Samtse in 2021 (Mw = 5.1), affect-
and Chamlagain, 2016; Sil and Haloi, 2018). The outcomes               ing Phuentsholing and the neighboring areas with an inten-
of such studies aim to provide local seismic (Gautam, 2017)            sity level of IV in the Modified Mercalli Intensity (MMI)
hazard parameters which can be adopted for the design of               scale (Gautam et al., 2022). The continuity of seismic activ-
structures and infrastructures (Douglas, 2006). Ground re-             ities in Bhutan is attributed to the presence of major shear
sponse parameters typically characterize the complex nature            zones such as the MHT, Main Boundary Thrust (MBT),
of strong motion accelerograms using a simple expansion of             Main Central Thrust (MCT), and the South Tibetan De-
predictive relationships. Two prominent approaches, deter-             tachment System (STDS) (Long and McQuarrie, 2010) as
ministic and probabilistic, are widely used for seismic hazard         shown in Fig. 1a. The study area is within the Phuentshol-
studies. Tempa et al. (2021a) recommended the use of the de-           ing Formation of the Buxa group of the Lesser Himalaya,
terministic approach that can estimate the parameters under            mainly characterized by highly weathered dark grey to
various earthquake occurrence scenarios. Notably, selecting            black slate and phyllite and thin interbedding of limestone
a single ground motion to consider amplitude for seismic site          with a substantial amount of cream-colored dolomite and
response analysis may not be a reliable approach to estimate           fine-medium quartzite, additionally consisting of fine- to
site amplification. The selection of a wide amplitude range            medium-grained conglomeratic quartzite interbedded with
and the assessment of likely fluctuation scenarios for Bhutan          phyllite and dolomite towards the Rinchending area of
is not done yet. Hence, ground motion parameters that are              Zone II. Hence, the lithological characteristic of the area
related to the amplitude are investigated to examine and pre-          indicates weak and highly unstable geology in the region.
dict the variability, often regarded as sensitivity, concerning        The presence of thrust faults in the proximity of the study
mean values and associated scatter.                                    area along the entire belt of the Lesser Himalayan units and
   In this paper, a sensitivity analysis of site response for spe-     the quaternary sediments in the south depict the area to be
cific soil conditions in Phuentsholing, Bhutan, is explored            seismically active with the majority of the historical earth-
by a statistical correlation function of the ground motion             quake events concentrated within these geological units. In
parameters for different earthquake shaking intensities. The           particular, this study focuses on the city of Phuentsholing in
study area is one of the major urban and commercial hubs in            the Chukha district in Bhutan (Fig. 1c). The city is one of
Bhutan Himalaya, and seismic site effects on existing struc-           the major commercial hubs for trade with India. The study
tures may have detrimental consequences due to inherent                area is undergoing rapid infrastructure development activ-
vulnerabilities of structures and infrastructures, as well as          ities and urban expansion for residential, commercial, and
due to likely phenomena such as amplification in loose soil            industrial purposes. Phuentsholing city covers an area of
deposits. To quantify the seismic site effects in terms of am-         15.6 km2 and is located at 89.39◦ N and 26.86◦ E. The city
plification of amplitude parameters, a range of time histories         has a population of 27 658, mostly distributed towards the
is selected, and site response parameters are estimated.               peripheral international border area with a total of 2263 res-
                                                                       idential and commercial buildings per the 2020 statistics
                                                                       (http://www.pcc.bt/index.php/, last access: 15 June 2021).
2   Seismicity and geology of the study area                           The seismic site characterization includes eight locations
                                                                       in the regions of Dhamdhara, Toorsa, and Rinchending in
The Himalaya is one of the most seismically active re-                 Phuentsholing, Bhutan. In this study, the sites are grouped
gions on earth, which observes both large- and moderate-               into two main zones based on the geographical location and
sized events frequently (Drukpa et al., 2006). Bhutan is lo-           immediate availability of survey locations. These two zones
cated in the eastern Himalaya formed due to the subduc-                also refer to the local area plan (LAP) of Phuentsholing. The
tion of the Indian Plate beneath the Eurasian Plate and spans          zones are Zone I: Dhamdhara I, Dhamdhara II, Toorsa I,
from the low-lying Brahmaputra Plain to the high Tibetan               and Toorsa II; and Zone II: College of Science and Tech-
Plateau. Most of the land area of Bhutan is underlain by the           nology (CST) football ground, CST hostel, Phajoding, and

Nat. Hazards Earth Syst. Sci., 22, 1893–1909, 2022                                    https://doi.org/10.5194/nhess-22-1893-2022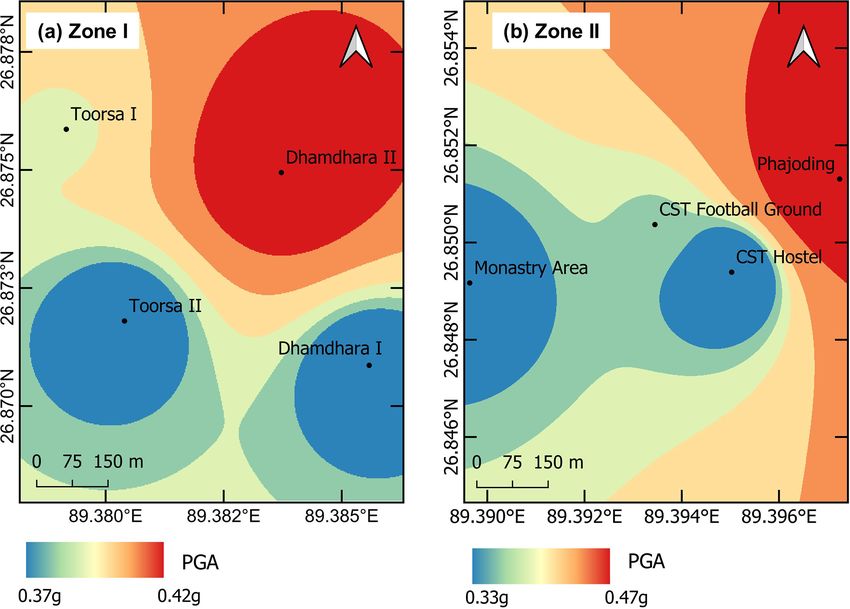
K. Tempa et al.: Sensitivity analysis of input ground motion                                                                       1895

Figure 1. Geology and seismicity and the study area: (a) geological map of Bhutan reproduced from McQuarrie et al. (2013) and seismicity,
(b) location of Phuentsholing and geology of the area, and (c) study area showing surveyed site using MASW (modified from © Google
Earth Pro 2021).

https://doi.org/10.5194/nhess-22-1893-2022                                    Nat. Hazards Earth Syst. Sci., 22, 1893–1909, 2022
1896                                                              K. Tempa et al.: Sensitivity analysis of input ground motion

Figure 2. Typical borehole stratigraphy in Toorsa and Dhamdhara (Zone I) and Rinchending (Zone II).

the Monastery area. Among the eight LAPs, Dhamdhara and              berg limits, grain size distribution, and direct shear testing.
Toorsa (Zone I) are in the same region in the western part of        Field tests such as standard penetration resistance (SPT) and
the city, and Rinchending (Zone II) is in the east.                  core cutter test were performed to determine resistance to
                                                                     penetration (SPT-N) and field density, respectively.
                                                                        As shown in the stratigraphic logs, the upper stratum com-
3     Materials and method                                           prises predominantly mixed coarse-grained soils character-
                                                                     ized by a considerable fraction of sand. The soil classifi-
3.1    Geotechnical site characterization                            cation of the Phuentsholing area carried out by sieve anal-
                                                                     ysis highlighted that most soils consist of 22.74 % gravel,
The geotechnical reports collected by Phuentsholing mu-              74.89 % sand, and 2.37 % silt and clay. The sieve analysis
nicipality have 29 stratigraphic logs. From these records,           results for the respective zones are shown in Fig. 3. The soils
the depth of the water table (GWT) was demarcated first.             in Toorsa are non-plastic, as coarse-grained soils dominate
Drilling log data showed the highest depth of the water table        the particle distribution, while the soils in Rinchending and
in the Dhamdhara area at 12.5 to 16 m, whereas the ground-           Dhamdhara have low plasticity with a plasticity index (PI)
water table in the Rinchending area is at 5 m, followed by the       of 6.5 and 10, respectively. The bulk density is 1.8 g cm−3
Toorsa area at 0.5 and 3 m, which is located near the riverbed.      in Toorsa, 1.64 g cm−3 in Dhamdhara, and 1.33 g cm−3 in
The depth of the water table is one of the essential input pa-       Rinchending. The shear strength parameter, cohesion (c),
rameters used for one-dimensional ground response analy-             ranges between 0 and 0.18 kg cm−2 , while the angle of in-
sis. Three drill holes are presented to illustrate the typical       ternal friction (φ) in the study area is up to 35◦ .
underground stratigraphy (Fig. 2). Table 1 presents a sum-              Shear wave velocity profiles from eight locations in the
mary of soil properties from laboratory testing of in situ sam-      study area based on the multispectral surface wave analy-
ples collected from the drill holes. The number of samples in        sis (MASW) and empirical correlation developed by Tempa
each zone represents the total number of samples collected           et al. (2021a) are used for input parameters. According to
from all drill logs at various stratigraphic depths. All labo-       the shear wave velocity profile, engineered bedrock (Vs >
ratory tests have been verified according to the Indian stan-        800 m s−1 ) lies at a depth of 150 to 400 m as shown in Fig. 4.
dard codes. Testing included physical identification, Atter-

Nat. Hazards Earth Syst. Sci., 22, 1893–1909, 2022                                   https://doi.org/10.5194/nhess-22-1893-2022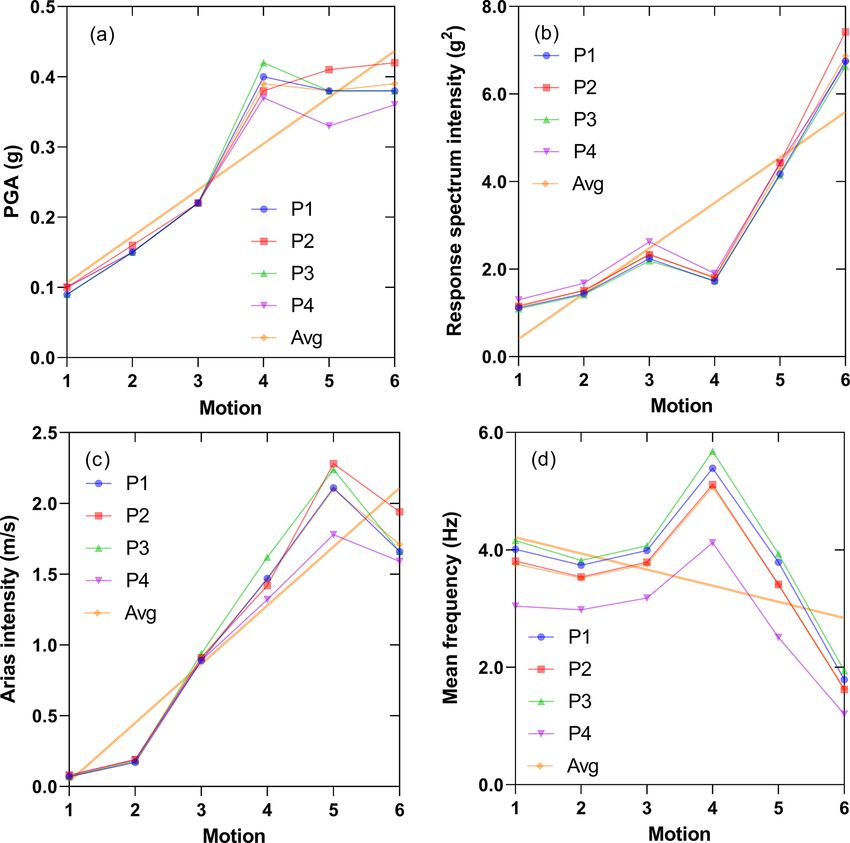
K. Tempa et al.: Sensitivity analysis of input ground motion                                                                        1897

Table 1. Average soil parameters in the study area.

          Location        Testing methods      Soil parameters                                   No. of   Reference
                                                                                                samples
          Toorsa          Atterberg’s limit    Non-plastic                                                IS: 2720 (Part 5)-1995
          (Zone I)                             Bulk density, γt = 1.8 g per centimeter cube
                          Core cutter                                                                     IS: 2720 (Part 29)-1975
                                               Dry density, γd = 1.64 g per centimeter cube       86
                                               c=0
                          Direct shear                                                                    IS: 2720 (Part 13)-1997
                                               φ = 35◦
                          SPT                  N value = 25 to 50                                         IS: 2131–1981
          Dhamdhara                                                                                       IS: 2720 (Part 5)-1995
                          Atterberg’s limit    Low plasticity (PI = 6.5)
                                                                                                          IS: 2720 (Part 29)-1975
          (Zone I)                             Bulk density, γt = 1.64 g per centimeter cube
                          Core cutter                                                             28      IS: 2720 (Part 29)-1975
                                               Dry density, γd = 1.51 g per centimeter cube
                                               c = 0.073 kg cm−2
                          Direct shear                                                                    IS: 2720 (Part 13)-1997
                                               φ = 31.44◦
                          SPT                  N value = 19 to 37                                         IS: 2131–1981
          Rinchending                                                                                     IS: 2720 (Part 5)-1995
                          Atterberg’s limit    Low plasticity (PI = 10)
                                                                                                          IS: 2720 (Part 29)-1975
          (Zone II)                            Bulk density, γt = 1.83 g per centimeter cube
                          Core cutter                                                             26      IS: 2720 (Part 29)-1975
                                               Dry density, γd = 1.70 g per centimeter cube
                                               c = 0.18 kg cm−2
                          Direct shear                                                                    IS: 2720 (Part 13)-1997
                                               φ = 20–30◦
                          SPT                  N value = 21 to < 100                                      IS: 2131–1981

Figure 3. Representative grain size distribution curve for the study area.

According to the parametric analysis carried out by Tempa                    and 470 m s−1 , except for Phajoding, which has shear wave
et al. (2020), the site condition in the study area is classi-               velocity of 584.76 m s−1 (Table 2).
fied as ground type B per Eurocode EC-08 and the National                       Dynamic properties of soils are influenced by shear mod-
Earthquake Hazards Reduction Program (NEHRP) with the                        ulus and damping and are defined by the respective degrada-
majority of shear velocity (Vs,30 ) values falling between 380               tion models, regarded as the backbone curves. Figure 5 rep-
                                                                             resents the dynamic soil model for sand used in this study.

https://doi.org/10.5194/nhess-22-1893-2022                                         Nat. Hazards Earth Syst. Sci., 22, 1893–1909, 2022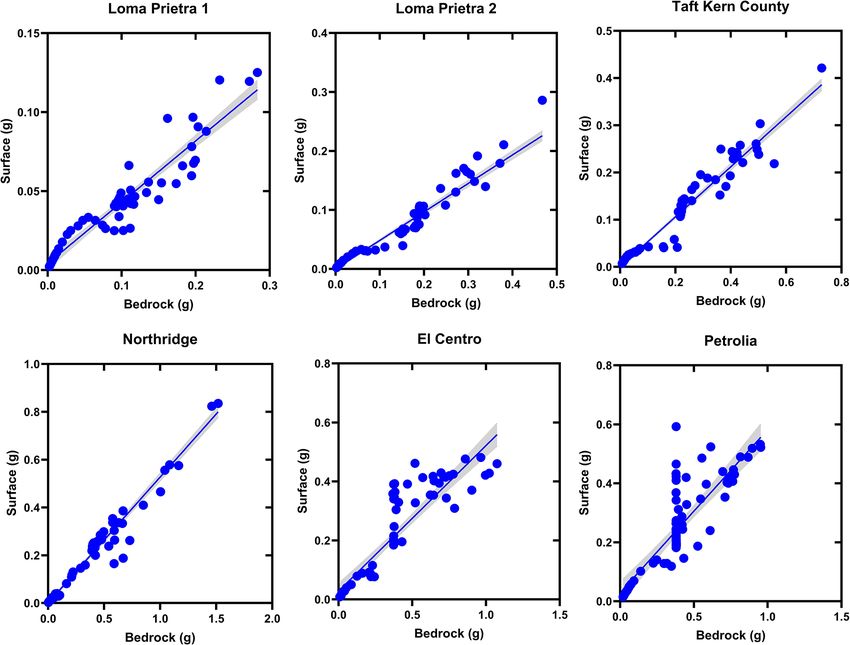
1898                                                                 K. Tempa et al.: Sensitivity analysis of input ground motion

Figure 4. Shear wave velocity profile of study locations in Phuentsholing, Bhutan.

Table 2. Site classification as per Eurocode EC-08.

       Zones    Sites                     Vs,30       Ground
                                        (m s−1 )       type
                Dhamdhara I              386.43         B
                Dhamdhara II             435.92         B
       I
                Toorsa I                 439.54         B
                Toorsa II                464.30         B
                CST football ground      426.76         B
                CST hostel               426.61         B
       II
                Monastery area           446.20         B
                Phajoding                584.76         B
                                                                        Figure 5. Average modulus reduction ratio and damping ratio
       All      Bedrock                   > 800         A               adopted for sand (Seed and Idriss, 1970).

                                                                        loading is approximated as a function of Gsec and Gmax . The
Degradation models are well established by many investiga-              predetermined estimation of Gsec or G and Gmax is attributed
tors for different types of soils (see, e.g., Seed and Idriss,          to unit weight or bulk density, ρ, and shear wave velocity,
1970; Vucetic and Dobry, 1991; Darendeli, 2001; Dobry and               Vs (Gmax = ρVs2 ). Similarly, damping ratios are predicted as
Vucetic, 1982; Seed et al., 1986). A damped linear elastic              a function of Gsec or G values. This estimation is achieved
model of the soil system is used for the analysis. Due to soil          using an iterative procedure in the ProShake 2.0 program
nonlinearity for which the shear modulus is strain dependent,           (EduPro Civil Systems Inc., 2017).
ProShake performs an iterative process on the linear model
until both the moduli and damping ratios are compatible with            3.2   Selection of input motion
the average strains and convergence is achieved at the last it-
eration (Shafiee et al., 2011; Puri et al., 2018). The nonlin-          The definition of the input motion that is considered for site
ear and hysteretic stress–strain behavior of soils under cyclic         response analysis of an area requires both subsurface char-

Nat. Hazards Earth Syst. Sci., 22, 1893–1909, 2022                                     https://doi.org/10.5194/nhess-22-1893-2022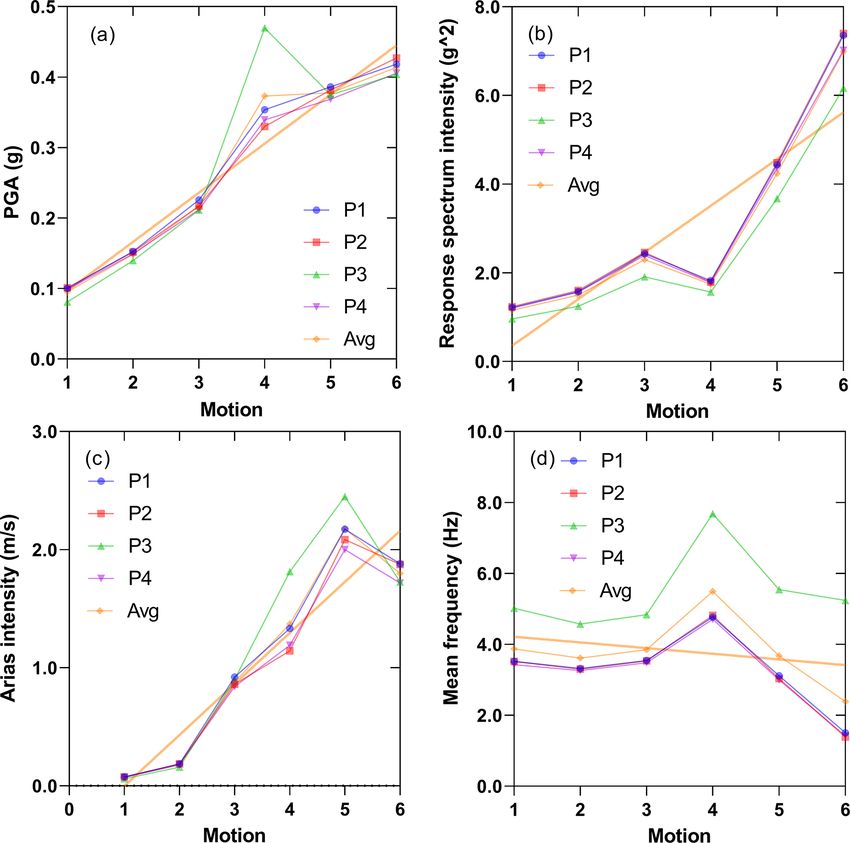
K. Tempa et al.: Sensitivity analysis of input ground motion 1899
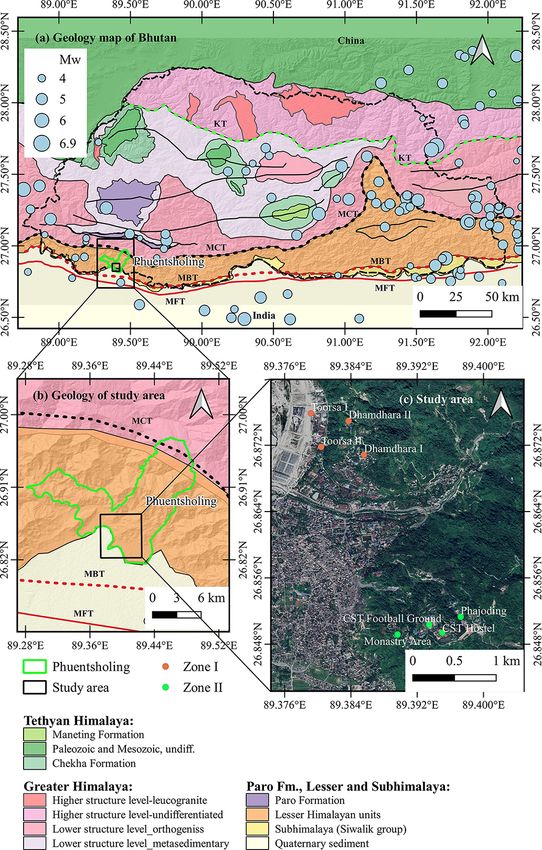
Figure 6. Strong motions and corresponding Fourier amplitude plots of the input ground motions.
acterization and careful selection of acceleration time histo- amplitude and frequency content of the bedrock level motion
ries. In Bhutan, records of acceleration time histories are very are particularly the most important parameters (Kirtas et al.,
rare, if not absent. In the absence of a national seismic code, 2015; Kramer, 1996). To understand the strong ground mo-
Bhutan is assumed to fall under Indian seismic zones IV tion characteristics, we plotted the Fourier amplitude versus
and V, with an expected maximum peak ground accelera- period in the frequency domain, representing the Fourier am-
tion (PGA) of 0.24 and 0.36 g for design purposes. For these plitude spectra of the input motions, as shown in Fig. 6. The
two zones, the PGA for earthquakes with a return period of effect of local soils is indicated at a much higher frequency
475 years is expected to be half of the maximum considered range in all the investigated sites.
earthquake (MCE), i.e., 0.12 and 0.18 g. Notably, the Global
Seismic Hazard Map (GSHAP) depicts the PGA range be- 3.3 One-dimensional ground response analysis
tween 0.2 and 0.28 g with an increasing trend towards the
east of the country. Considering the variations in expected One-dimensional-equivalent linear analysis is performed at
PGA, we selected six acceleration time histories as input eight sites in Phuentsholing, Bhutan, to estimate local site
motions with PGA ranging from 0.067 to 0.422 g, consid- effects using the ProShake 2.0 program. In this study, six
ering the lowest and the highest range of possible earthquake strong motion records are used to represent low, medium,
scenarios (Table 3). The acceleration time histories used for and high acceleration categories. The ProShake 2.0 program
the one-dimensional ground response analysis are shown in provides the flexibility to input ground motions and soil
Fig. 6 in ascending PGA order using the ProShake 2.0 com- profiles and is useful for estimating the outcrop responses
puter program. In the ProShake 2.0 program, input motion to input ground shaking. The improved shear wave veloc-
and soil profile are denoted as “M” and “P”, respectively, ity profiles down to the engineered bedrock depth (150 and
and are annotated in the subsequent sections (Table 3). The 400 m) from eight sites are used. The deep shear wave pro-
files used in this study incorporate the effects of depth and
https://doi.org/10.5194/nhess-22-1893-2022 Nat. Hazards Earth Syst. Sci., 22, 1893–1909, 2022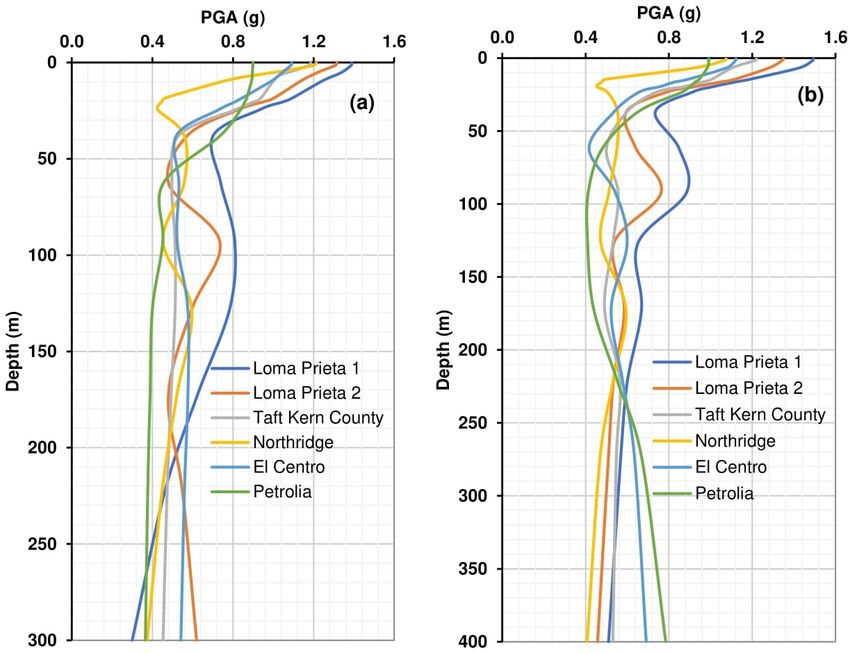
1900 K. Tempa et al.: Sensitivity analysis of input ground motion
Table 3. Selected strong motion records for ground response analysis.
Event Station Year Mw PGA (g) Notation
Loma Prieta/Santa Cruz Mountains Yerba Buena Island, CA – US Coast Guard 1989 6.9 0.067 M1
Loma Prieta Diamond Heights 1989 6.9 0.113 M2
Taft Kern County Taft 1952 7.5 0.185 M3
Northridge Topanga Fire Station 1994 6.7 0.329 M4
El Centro Imperial Valley Irrigation District 1940 6.9 0.344 M5
Petrolia Cape Mendocino 1992 6.6 0.422 M6
Figure 7. The typical profiles of normalized peak ground acceleration (PGA) at (a) Toorsa II in Zone I and (b) CST football ground in
Zone II.
soil type of visco-elastic soil layers above the predicted engi- 4 Results and discussion
neering bedrock. The one-dimensional ground response anal-
ysis accounts for wave propagation from the bedrock out- 4.1 Seismic site effects
crop through the visco-elastically stratified soil deposit and
provides an estimate of the surface motion parameters. The Figure 7 shows normalized PGAs on the surface at two typ-
complex response method is solved by the equation of mo- ical locations of the investigated zones. The chart shows
tion in the frequency domain. Nonlinear soil response is esti- PGAs of 1.2 to 1.5 g for low-PGA earthquakes and 0.7 to
mated by an iterative quasi-linear procedure in which succes- ∼ 1.1 g for medium- and high-PGA earthquakes. Response
sive linear analyses are performed while updating the shear parameters can be defined and characterized based on the
modulus and damping ratio based on the shear strain level amplitude parameters of the ground motion and the severity
obtained from the preceding iteration. Iterations continue un- of the ground motion excitation in nearby structures. This, in
til the strain-compatible modulus and damping converge. turn, is a function of the amplitude or intensity, the frequency
content, and the duration of the ground motion (Bradley,
2011). Natural periods or frequency domain parameters are
related to the seismic behavior of structures and indirectly re-
flect the ground motion characteristics (Zafarani et al., 2020).
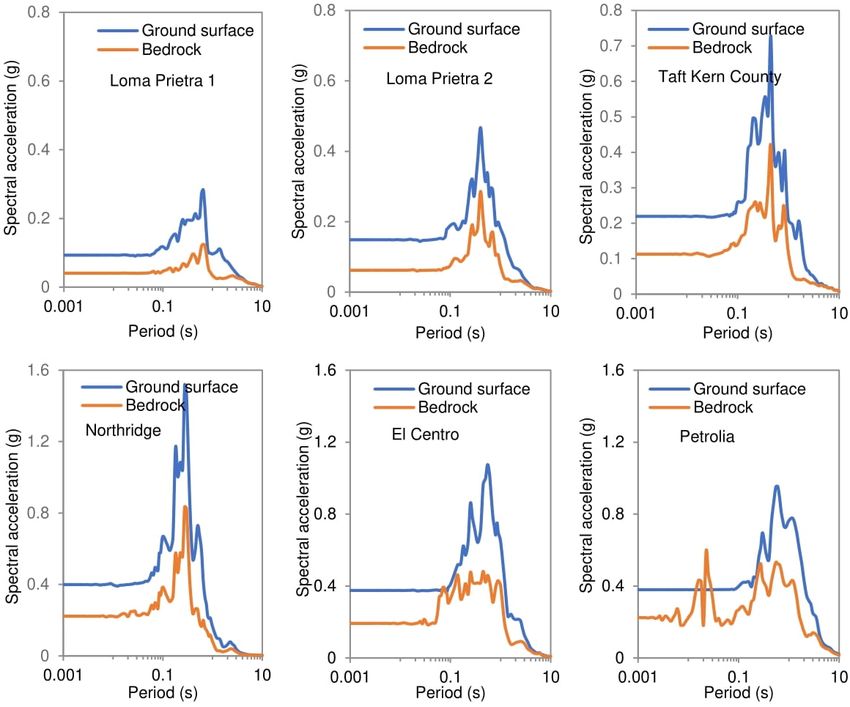
Hence, to commensurate this relationship, the response spec-
tra of bedrock and surface motion are presented in Figs. 8
Nat. Hazards Earth Syst. Sci., 22, 1893–1909, 2022 https://doi.org/10.5194/nhess-22-1893-2022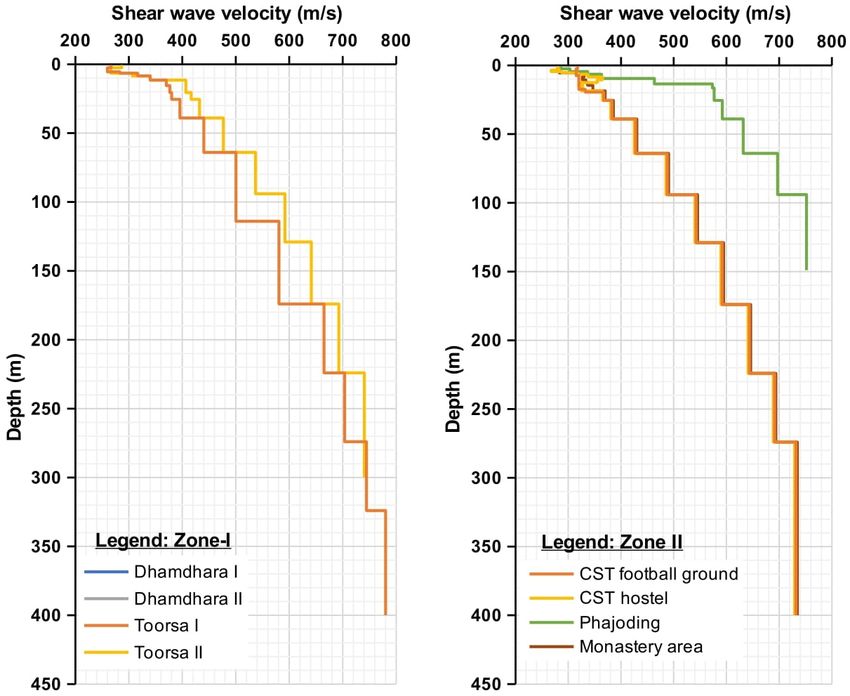
K. Tempa et al.: Sensitivity analysis of input ground motion                                                                       1901

Figure 8. Typical spectral acceleration of bedrock and ground surface motion at Toorsa II in Zone I corresponding to the respective input
motions.

Figure 9. Typical spectral acceleration of bedrock and ground surface motion at CST football ground in Zone II corresponding to the
respective input motions.

https://doi.org/10.5194/nhess-22-1893-2022                                    Nat. Hazards Earth Syst. Sci., 22, 1893–1909, 2022
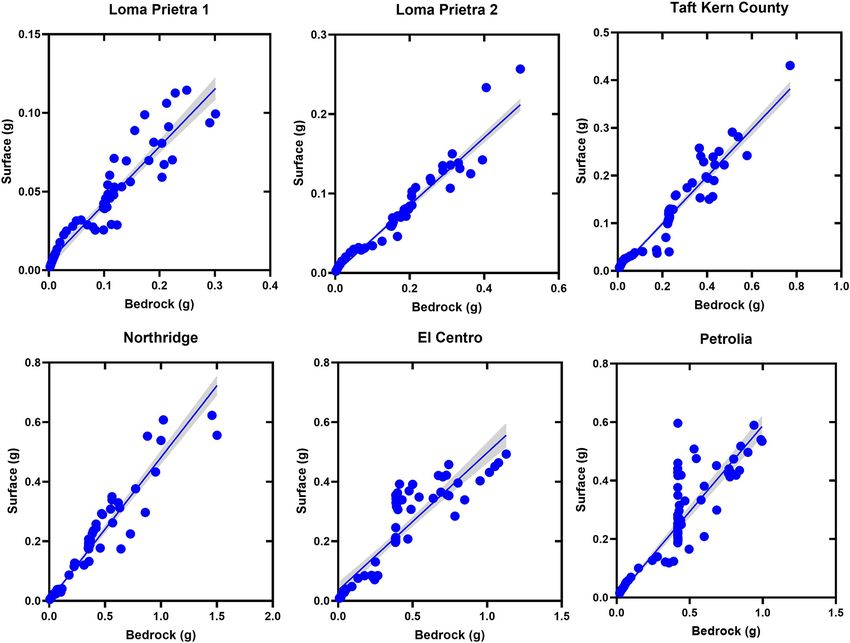
1902                                                                  K. Tempa et al.: Sensitivity analysis of input ground motion

Figure 10. Examples of amplification factors for various earthquakes at (a) soil profile P1 at Toorsa II in Zone I and (b) soil profile P4 at
Dhamdhara I in Zone I.

Figure 11. Examples of amplification factors for various earthquakes at (a) soil profile P1 at CST football ground in Zone II and (b) soil
profile P3 at Phajoding in Zone II.

and 9, respectively. The results of various input ground mo-             to 3.2 for Toorsa II, Dhamdhara I, CST football ground, and
tions indicate the higher spectral acceleration of the soil pro-         Phajoding, respectively, for 0.01 to 0.1 s natural period. In
file in the period range between 0.3 and 3.0 s, with the peak            the period range from 0.1 to 1.0 s, the amplification factors
spectral acceleration range of 0.14 to 1.62 g. Thus, the struc-          are in the range from 1.1 to 3.6, 0.7 to 4.2, 1.0 to 3.7, and 1.2
tures with similar fundamental vibration periods are likely to           to 5.2 for Toorsa II, Dhamdhara I, CST football ground, and
be exposed to greater peak spectral acceleration.                        Phajoding, respectively. In the natural period range, the am-
   Figures 10 and 11 show the results of typical amplification           plification factors are 5.0, 6.2, and 5.8 for Toorsa II, Dhamd-
factors at two locations in the study area. The amplification            hara I, and CST football ground, respectively. However, in
factors range from 0.7 to 2.7, 0.6 to 2.6, 0.75 to 2.5, and 0.7          the Phajoding the amplification factor is ∼ 1.7 due to a much

Nat. Hazards Earth Syst. Sci., 22, 1893–1909, 2022                                        https://doi.org/10.5194/nhess-22-1893-2022
K. Tempa et al.: Sensitivity analysis of input ground motion                                                                 1903

Figure 12. Box and whisker plot for ground motion parameters of soil profile at P1 Toorsa II in Zone I.

Figure 13. Box and whisker plot for ground motion parameters of the soil profile at P1 CST football ground in Zone II.

Figure 14. Linear regression model for bedrock and surface spectral accelerations for Toorsa II (Zone I).

https://doi.org/10.5194/nhess-22-1893-2022                                      Nat. Hazards Earth Syst. Sci., 22, 1893–1909, 2022
1904                                                                 K. Tempa et al.: Sensitivity analysis of input ground motion

Figure 15. Linear regression model for bedrock and surface spectral accelerations for CST hostel (Zone II).

stiffer soil deposit (Vs,30 = 584.76 m s−1 ) and shallow engi-          in the ground response characteristics in both regions. The
neering bedrock at 150 m.                                               El Centro and Petrolia earthquakes, with the highest PGAs,
                                                                        also appear to be closely associated with spectral accelera-
4.2    Correlation analysis                                             tion.
                                                                           Primarily, propagating energy waves (outcrop motion) act
The main objective of this study is to demonstrate the sen-             on each stratified soil layer that amplifies or de-amplifies the
sitivity of input motion amplitudes to predict the variabil-            ground motion response parameters at each layer. The sensi-
ity in seismic site effects due to local ground conditions.             tivity of the input motion parameters is critically monitored,
We examined the potential trends, patterns, and relationships           and enhanced correlations are developed. To outline this, a
between datasets for the numerical results. Using statistical           linear regression model for bedrock outcrop motion and the
analysis, variation in amplitude parameters is projected by             predicted motion parameters as a function of bedding depth
box plots (Figs. 12 and 13). Statistical correlations are fit-          is developed. Regression analysis is performed for one par-
ted between peak ground acceleration (PGA), peak ground                 ticular soil profile from two zones (Toorsa II and CST hostel)
velocity (PGV), peak ground displacement (PGD), and spec-               to substantiate the sensitivity analysis (Figs. 14 and 15).
tral acceleration (Sa ) to determine the correlation between               The 95 % confidence interval (CI) shows a linear relation-
the effects of strong ground motion and the local soil con-             ship for the Loma Prieta 2, Taft Kern County, and Northridge
ditions. As anticipated, the 1992 Petrolia earthquake with              earthquakes, indicating a closer impact on surface motion
0.422 g PGA (Mw = 6.6) led to the greatest response. How-               that corresponds to the outcrop motion. In this case, the pre-
ever, the 1994 Northridge earthquake with a PGA of 0.329 g              dominant frequency content of the input motion is between
(Mw = 6.7) shows greater variability in spectral acceleration           1 and 10 Hz. In contrast, the Loma Prieta 1, El Centro, and
compared to other earthquakes. This is because the spec-                Petrolia earthquakes, with a predominant frequency between
tral acceleration corresponds to the interaction between the            0.3 and 1.2 Hz, exhibit typical nonlinearity throughout the
ground and the shaking intensity of an earthquake. There-               spectral range, indicating possible damping of the spectral
fore, from the perspective of seismic site effects the box              responses of the soil deposits.
plot of the spectral acceleration (period or frequency domain)             Since all analysis sites are in type B sites, the trend of
is highly scattered with the outliers, confirming uncertainty           ground motion variation to surface is very similar, so the

Nat. Hazards Earth Syst. Sci., 22, 1893–1909, 2022                                      https://doi.org/10.5194/nhess-22-1893-2022
K. Tempa et al.: Sensitivity analysis of input ground motion 1905 Figure 16. Sensitivity of input ground motion in Zone I. (a) Peak ground acceleration, (b) response spectrum intensity, (c) Arias intensity, and (d) mean frequency. Soil profiles: P1: Toorsa II; P2: Toorsa 1; P3: Dhamdhara II; and P4: Dhamdhara I. average values may be crucial for the better implementa- input motions to predict the mean (or median) response with tion of the scenario-based seismic risk in the study area. some level of confidence (Kramer et al., 2012). The sensi- Ground response parameters such as the PGA and response tivity of input motion is shown in Figs. 14 and 15 from two spectrum intensity including the Arias intensity show linear investigated locations. The results of the correlation analysis variation for aggregated values while increasing intensity of and the sensitivity plots indicate that the input motion M4 earthquake shaking corresponding to a given soil profile. The (Northridge) has a significant influence on most of the re- mean, median, and standard deviation of the output parame- sponse parameters. The additional ground response parame- ters are computed. The response spectrum intensity is com- ters are provided in Tables S1 and S2 in the Supplement. puted based on Housner’s approach (Housner, 1959) as an in- The PGAs of M4 (Northridge) are mapped to show the tegral from 0.1 to 2.5 s of the pseudo-velocity spectrum that spatial variability in two zones as shown in Fig. 18. The PGA provides an indication of the average velocity for most civil in Zone I is distributed between 0.37 and 0.42 g. The vari- engineering structures. The plot of sensitivity of various in- ability of PGA in Zone II is higher compared to Zone I as put motions on amplitude parameters to different local soils the PGA range for Zone II is 0.33 to 0.47 g. The resulting for the two zones is shown in Figs. 16 and 17. interplay of strong ground motion parameters with local soil The standard deviation is lower for a set of predominant conditions primarily highlights the importance of input mo- natural periods for a soil profile compared to the response tion characterization. spectrum dataset, and the deviation from the mean value in- dicates a stronger soil response to the single degree of free- dom systems, as shown in Tables 4 and 5. Soil nonlinearity 5 Conclusions often shows a significant scatter in spectral acceleration at higher and lower periods, and therefore the practical reliabil- Using one-dimensional site response analysis, we performed ity of the result is that it prompts more analysis with many sensitivity of various input motions. Ground motion param- https://doi.org/10.5194/nhess-22-1893-2022 Nat. Hazards Earth Syst. Sci., 22, 1893–1909, 2022
1906                                                                     K. Tempa et al.: Sensitivity analysis of input ground motion

Figure 17. Sensitivity of input ground motion in Zone II. (a) Peak ground acceleration, (b) response spectrum intensity, (c) Arias intensity,
and (d) mean frequency. Soil profiles: P1: CST football ground; P2: CST hostel; P3: Phajoding; and P4: Monastery area.

Table 4. Descriptive statistics for averaged ground response parameters in Zone I for all four soil profiles and six input ground motions.

                                                    PGA        Arias       Response    Predominant      Mean
                                                     (g)     intensity     spectrum       period      frequency
                                                              (m s−1 )     intensity        (s)          (Hz)
                                                                             (g2 )
                             Mean                  0.270      1.073         2.996         0.818         3.527
                             Median                0.238      0.630         2.450         0.689         3.319
                             Standard deviation    0.121      0.765         2.013         0.468         1.097
                             84th percentile       0.407      2.215         4.541         1.251         4.824
                             16th percentile       0.139      0.179         1.322         0.379         2.283

eter sensitivity for soft soil deposits is assessed considering                 0.34 g and less than 0.1 g are more sensitive than the
a typical eastern Himalayan setting. Aiming to quantify the                     others. The conclusion is that sensitivity is more promi-
variation in input motion characteristics, we assessed several                  nent in low and high PGA ranges than the moderate
ground motion parameters. The conclusions of the study can                      shaking scenario (0.1–0.34 g).
be depicted as follows.
                                                                              – For loose soil sites characterized as type B ground, peak
  – The trend in the variation in ground motion parameters                      spectral acceleration is prominent between 0.3 and 3 s,
    such as PGA, PGD, PGV, and SA projects an increasing                        and this implies that the structures with their funda-
    order with ground motion intensity as expected. How-                        mental vibration period between 0.3 and 3 s will ob-
    ever, the ground motions with input PGAs greater than                       serve greater peak spectral acceleration. The consider-

Nat. Hazards Earth Syst. Sci., 22, 1893–1909, 2022                                        https://doi.org/10.5194/nhess-22-1893-2022
K. Tempa et al.: Sensitivity analysis of input ground motion 1907
Table 5. Descriptive statistics for averaged ground motion parameters in Zone II for all four soil profiles and six input ground motions.
PGA Arias Response Predominant Mean
(g) intensity spectrum period frequency
(m s−1 ) intensity (s) (Hz)
(g2 )
Mean 0.271 1.079 2.985 0.812 3.814
Median 0.237 0.622 2.417 0.684 3.538
Standard deviation 0.126 0.794 2.066 0.453 1.382
84th percentile 0.411 2.226 4.541 1.243 5.330
16th percentile 0.136 0.174 1.287 0.377 2.349
Figure 18. PGA distribution map of input motion M4 (Northridge) earthquake at (a) Toorsa and Dhamdhara in Zone I and (b) Rinchending
in Zone II.
ation of earthquake-resistant designs for the structures This study uses various strong motions to depict the variabil-
with a fundamental vibration period requires additional ity in ground motion characteristics. Although this is one of
attention due to the severity in peak spectral accelera- the first studies in the area, the results are still preliminary,
tion occurrence. and detailed investigation using sophisticated soil character-
istics and approaches could be effective in obtaining more
– In general, the peak amplification factor is obtained up
reliable results.
to 6.2 for the study area. The lower amplification factor
coincides with the occurrence of bedrock early. Mean-
while, the soil columns with greater depth of loose soil Code availability. The educational version of ProShake 2 soft-
deposits have reflected greater amplification. The spa- ware can be downloaded from http://www.proshake.com/PS2.
tial variation in amplification factor is quite significant 0Educational.html (EduPro Civil Systems, 2022).
even in a small area. Thus, more rigor is necessary for
site response analysis and microzonation studies in soft
soil deposits to incorporate the spatial variation in soil Data availability. All the data used in this study are presented in
columns. If soil stiffness is increased, the amplification the paper. Further information on data and methods, if required, can
factor can be checked; thus, soil improvement may be be obtained from the first/corresponding author upon reasonable re-
required to assure foundation performance in loose soil quest.
deposits.
https://doi.org/10.5194/nhess-22-1893-2022 Nat. Hazards Earth Syst. Sci., 22, 1893–1909, 20221908 K. Tempa et al.: Sensitivity analysis of input ground motion
Supplement. The supplement related to this article is available on- Chettri, N., Gautam, D., and Rupakhety, R.: Seismic vulnerability
line at: https://doi.org/10.5194/nhess-22-1893-2022-supplement. of vernacular residential buildings in Bhutan, J. Earth. Eng., 26,
1–16, https://doi.org/10.1080/13632469.2020.1868362, 2021b.
Darendeli, M. B.: Development of a New Family of Normalized
Author contributions. KT formulated the ideas, prepared data, and Modulus Reduction and Material Damping Curves, Dept. of
did formal analysis. KRA managed funding, provided resources, Civil Eng., Univ. of Texas, Austin, https://repositories.lib.utexas.
and supervised KT. KT and KRA prepared the first draft of the edu/handle/2152/10396 (last access: 7 June 2021), 2001.
manuscript. KT, GF, and DG formulated the methodology. NC par- Dobry, R., and Vucetic, M.: Dynamic properties and seismic re-
ticipated in formal analysis and supported KT in interpretation and sponse of soft clay deposits, in: International Symposium on
visualization. The draft was revised by NC, GF, and DG. Geotech., Eng. of Soft Soils, 2 January 1987, Maxico, 51–87,
1982.
Douglas, J.: Selection of strong-motion records for use as input to
Competing interests. The contact author has declared that neither the structural models of VEDA, BRGM, http://infoterre.brgm.fr/
they nor their co-authors have any competing interests. rapports/RP-54584-FR.pdf (last access: 22 May 2021), 2006.
Drukpa, D., Velasco, A. A., and Doser, D. I.: Seismicity in
the Kingdom of Bhutan (1937–2003): Evidence for crustal
transcurrent deformation, J. Geophys. Res.-Solid, 111, 1–14,
Disclaimer. Publisher’s note: Copernicus Publications remains
https://doi.org/10.1029/2004JB003087, 2006.
neutral with regard to jurisdictional claims in published maps and
EduPro Civil Systems: ProShake: Ground Response Analysis Pro-
institutional affiliations.
gram 2.0, User’s Manual, http://www.proshake.com/proshake_2.
0/UserManual.pdf (last access: 10 March 2021), 2017.
EduPro Civil Systems: ProShake 2.0 – Educational Version,
Special issue statement. This article is part of the special issue http://www.proshake.com/PS2.0Educational.html, last access:
“Earthquake-induced hazards: ground motion amplification and 3 June 2022.
ground failures”. It is not associated with a conference. Gautam, D.: Mapping surface motion parameters and liq-
uefaction susceptibility in Tribhuvan International Air-
port, Nepal, Geomat. Nat. Hazards Risk, 8, 1173–1184,
Acknowledgements. The authors are thankful to Phuentsholing https://doi.org/10.1080/19475705.2017.1305993, 2017.
Thromde (municipal office) for providing additional geotechni- Gautam, D. and Chamlagain, D.: Preliminary assessment of
cal data. This research was carried out in the framework of the seismic site effects in the fluvio-lacustrine sediments of
agreement for co-operation between the University of Naples Fed- Kathmandu valley, Nepal, Nat. Hazards, 81, 1745–1769,
erico II, Department of Civil, Architectural and Environmental En- https://doi.org/10.1007/s11069-016-2154-y, 2016.
gineering (DICEA), and the Royal University of Bhutan, College Gautam, D., Forte, G., and Rodrigues, H.: Site effects
of Science and Technology (CST), signed on 17 November 2021. and associated structural damage analysis in Kath-
The coordinators for DICEA and CST are Giovanni Forte and mandu Valley, Nepal, Earthq. Struct., 10, 1013–1032,
Karma Tempa, respectively. https://doi.org/10.12989/eas.2016.10.5.1013, 2016.
Gautam, D., Chettri, N., Tempa, K., Rodrigues, H., and Ru-
pakhety, R.: Seismic vulnerability of bhutanese vernacu-
Review statement. This paper was edited by Paolo Frattini and re- lar stone masonry buildings: From damage observation to
viewed by two anonymous referees. fragility analysis, Soil Dynam. Earthq. Eng., 160, 107351,
https://doi.org/10.1016/j.soildyn.2022.107351, 2022.
Housner, G. W.: Behavior of structures during earthquakes, J. Eng.
Mech. Div.- ASCE, 85, 109–129, 1959.
References ISSMGE: Manual for zonation on seismic geotechnical hazards, in:
Technical committee for earthquake geotechnical engineering,
Bradley, B. A.: Empirical correlation of PGA, spectral ac- TC4, international society for soil mechanics and geotechnical
celeration and spectrum intensities from active shallow engineering, The Japanese Geotechnical Society, Tokyo, 1999.
crustal earthquakes, Earthq. Eng. Struct. Dynam., 40, 1–15, Kirtas, E., Koliopoulos, P., Kappos, A., Theodoulidis, N., Savvaidis,
https://doi.org/10.1002/eqe.1110, 2011. A., Margaris, B., and Rovithis, E.: Identification of earthquake
Chavez-Garcia, F. J., Pedotti, G., Hatzfeld, D., and Bard, P. Y.: An ground motion using site effects analysis in the case of Serres
experimental study of site effects near Thessaloniki (northern city, Greece, Int. J. Civ. Eng. Architect., 2, 20–27, 2015.
Greece), Bull. Seismol. Soc. Am., 80, 784–806, 1990. Kramer, S. L.: Geotechnical Earthquake Engineering, Prentice Hall,
Chettri, N., Gautam, D., and Rupakhety, R.: From Tship Chim to ISBN 978-0133749434, 1996.
Pa Chim: Seismic vulnerability and strengthening of Bhutanese Kramer, S. L., Arduino, P., and Sideras, S. S.: Earthquake
vernacular buildings, in: Masonry Construction in Active Seis- ground motion selection, The State of Washington Department
mic Regions, 1st Edn., edited by: Rupakhety, R. and Gautam, of Transportation, https://www.wsdot.wa.gov/research/reports/
D., Elsevier, 253–288, https://doi.org/10.1016/c2019-0-02453-3, fullreports/791.1.pdf (last access: 10 March 2021), 2012.
2021a.
Nat. Hazards Earth Syst. Sci., 22, 1893–1909, 2022 https://doi.org/10.5194/nhess-22-1893-2022K. Tempa et al.: Sensitivity analysis of input ground motion 1909 Licata, V., Forte, G., d’Onofrio, A., Santo, A., and Silvestri, F.: A Sil, A. and Haloi, J.: Site-specific ground response analy- multi-level study for the seismic microzonation of the Western sis of a proposed bridge site over Barak River along area of Naples (Italy), Bull. Earthq. Eng., 17, 4711–4741, 2019. Silchar Bypass Road, India, Innov. Infrastruct. Solut., 3, 63, Long, S. and McQuarrie, N.: Placing limits on channel flow: In- https://doi.org/10.1007/s41062-018-0167-y, 2018. sights from the Bhutan Himalaya, Earth Planet. Sc. Lett., 290, Stevens, V. L., De Risi, R., Le Roux-Mallouf, R., Drukpa, D., 375–390, https://doi.org/10.1016/j.epsl.2009.12.033, 2010. and Hetényi, G.: Seismic hazard and risk in Bhutan, Nat. Lopez-Caballero, F., Gelis, C., Regnier, J., and Bonilla, L. F.: Site Hazards, 104, 2339–2367, https://doi.org/10.1007/s11069-020- response analysis including earthquake input ground motion and 04275-3, 2020. soil dynamic properties variability, in: 15th World Conference on Tempa, K., Sarkar, R., Dikshit, A., Pradhan, B., Simonelli, A. Earthquake Engineering, 24–28 September 2012, Lisbon, Portu- L., Acharya, S., and Alamri, A. M.: Parametric study of lo- gal, 2012. cal site response for bedrock ground motion to earthquake in McQuarrie, N., Long, S. P., Tobgay, T., Nesbit, J. N., Gehrels, Phuentsholing, Bhutan, Sustainability (Switzerland), 12, 1–20, G., and Ducea, M. N.: Documenting basin scale, geometry and https://doi.org/10.3390/su12135273, 2020. provenance through detrital geochemical data: Lessons from Tempa, K., Chettri, N., Gurung, L., and Gautam, D.: Shear the Neoproterozoic to Ordovician Lesser, Greater, and Tethyan wave velocity profiling and ground response analysis in Himalayan strata of Bhutan, Gondwana Res., 23, 1491–1510, Phuentsholing, Bhutan, Innov. Infrastruct. Solut., 6, 1–16, https://doi.org/10.1016/j.gr.2012.09.002, 2013. https://doi.org/10.1007/s41062-020-00420-w, 2021a. Puri, N., Jain, A., Mohanty, P., and Bhattacharya, S.: Earth- Tempa, K., Chettri, N., Sarkar, R., Saha, S., Gurung, L., Dendup, quake Response Analysis of Sites in State of Haryana us- T., and Nirola, B. S.: Geotechnical parameter assessment of sed- ing DEEPSOIL Software, Proced. Comput. Sci., 125, 357–366, iment deposit: A case study in Pasakha, Bhutan, Cogent Eng., 8, https://doi.org/10.1016/j.procs.2017.12.047, 2018. 1–21, https://doi.org/10.1080/23311916.2020.1869366, 2021b. Seed, H. B. and Idriss, I. M.: Soil Moduli and Damping Factors for Vucetic, M. and Dobry, R.: Effect of Soil Plasticity on Cyclic Re- Dynamic Response Analyses, Report No. EERC 70-10, Earth- sponse, J. Geotech. Eng., 117, 89–107, 1991. quake Engineering Research Centre, University of California, Zafarani, H., Ghafoori, S. M. M., Soghrat, M. R., and Shafiee, M.: Berkeley, https://ntrl.ntis.gov/NTRL/dashboard/searchResults/ Spatial correlation of peak ground motions and pseudo-spectral titleDetail/PB197869.xhtml (last access: 10 May 2021), 1970. acceleration based on the sarpol-e-zahab Mw 7.3, 2017 earth- Seed, H. B., Wong, R. T., Idriss, I. M., and Tokimatsu, K.: Mod- quake data, Ann. Geophys., 63, 1–15, https://doi.org/10.4401/ag- uli and Damping Factors for Dynamic Analyses of Cohesionless 8349, 2020. Soils, J. Geotech. Eng., 112, 1016–1032, 1986. Shafiee, A., Kamalian, M., Jafari, M. K., and Hamzehloo, H.: Ground motion studies for microzonation in Iran, Nat. Hazards, 59, 481–505, https://doi.org/10.1007/s11069-011-9772-1, 2011. https://doi.org/10.5194/nhess-22-1893-2022 Nat. Hazards Earth Syst. Sci., 22, 1893–1909, 2022
You can also read