SECTOR SKILLS PLAN UPDATE - 2019/ 2020 PROMOTING ARTISAN DEVELOPMENT FOR EMPLOYABILITY - MerSETA
←
→
Page content transcription
If your browser does not render page correctly, please read the page content below
SECTOR SKILLS PLAN
             UPDATE
            2019/ 2020

PROMOTING ARTISAN DEVELOPMENT FOR
          EMPLOYABILITY

                             1 August 2018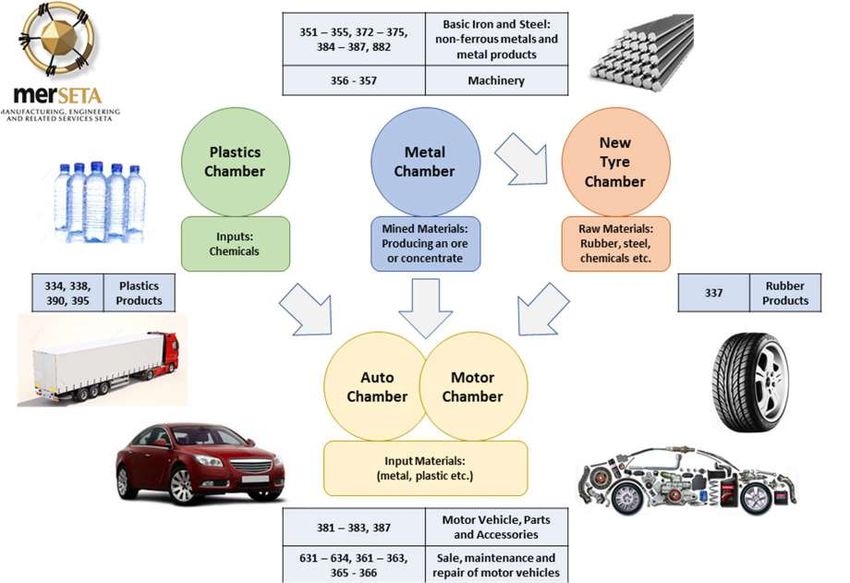
OFFICIAL SIGN OFF

FINAL SUBMISSION OF REQUIRED SSP DOCUMENTS AS PER DHET GUIDELINES FOR
SSP UPDATE 2019/2020

It is hereby certified that this final version of the Sector Skills Plan takes into account all the
relevant policies, legislation and other mandates for which merSETA is responsible and
accurately reflects the stipulated submission requirements as communicated by the
Department of Higher Education and Training (DHET).

This submission comprises merSETA Cover Letter, Continuous Improvement Plan and Final
SSP with the PIVOTAL list which was developed in accordance with the SSP Framework
produced by DHET.

Ms S. Nomvete
Strategy and Research Executive                                Signature: ………………………………….

Dr R. Patel
Chief Executive Officer                                        Signature: ………………………………….

Ms L. Letsoalo
Chairperson of the merSETA Accounting
Authority                                                      Signature: ………………………………….

                                                                              1 August 2018

                                                                                                  I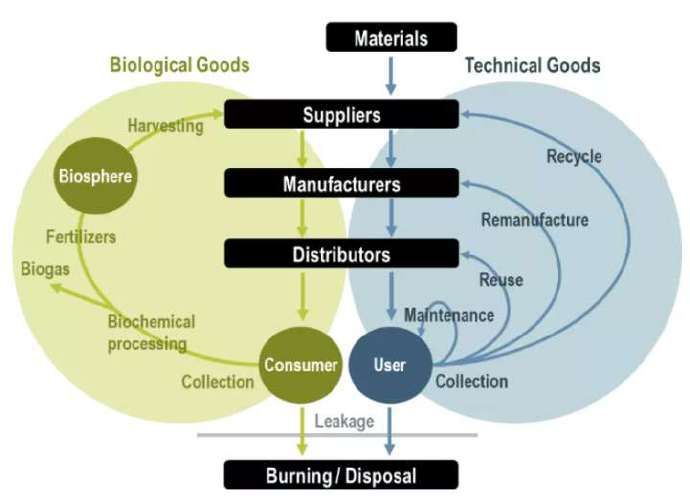
ACRONYMS
ABET       Adult Basic Education and Training          NCV          National Certificate (Vocational)
AEEA       African Engineering Education Association   NGP          New Growth Plan
AMEO       Manufacturers Employer Organisation         NSDS III     National Skills Development Strategy
ARPL       Artisan Recognition Prior Learning          NSFAS        National Students' Financial Aid Scheme
ATR        Annual Training Report                      NQF          National Qualifications Framework
                                                                    National Union of Metalworkers of South
CEO        Chief Executive Officer                     NUMSA
                                                                    Africa
           Chemical Energy Paper Printing Wood and                  Organisations for Economic Cooperation and
CEPPWAWU                                               OECD
           Allied Workers Union                                     Development
           Capital equipment, transport equipment,
CETEMF                                                 OEM          Original Equipment Manufacturers
           metal fabrication
CHE        Council for Higher Education                OFO          Organising Framework for Occupations
           Competence Measurement in Education
COMET                                                  (Pty)ltd     Private Company
           and Training
           Council for Scientific and Industrial
CSIR                                                   PhD          Doctor of Philosophy
           Research
           Department of Higher Education and                       Presidential Infrastructure Coordination
DHET                                                   PICC
           Training                                                 Committee
                                                                    Professional, Vocational, Technical and
DoL        Department of Labour                        PIVOTAL
                                                                    Academic Learning
DSAP       Dual System Apprenticeship Programme        PlasticsSA   Plastics Federation of South Africa

Dti        Department of Trade and Industry            PWD          People with Disabilities

ECSA       Engineering Council of South Africa         QCTO         Quality Council for Trades and Occupations

EPA        Engineering Profession Act                  QLFS         Quarterly Labour Force Survey

FET        Further Education and Training              QMR          Quarterly Management Report
GDP        Gross Domestic Product                      R&D          Research and Development
GET        General Education and Training              RMI          Retail Motor Industry

HEI        Higher Education Institutions               RPL          Recognition of Prior Learning
           Higher Education Management
HEMIS                                                  SADC         Southern African Development Community
           Information System
HET        Higher Education and Training               SAQA         South African Qualifications Authority
                                                                    The South African Tyre Manufacturers
HSRC       Human Sciences Research council             SATMC
                                                                    Conference
           Information and Communication                            Steel and Engineering Industries Federation
ICT                                                    SEIFSA
           Technology                                               of South Africa
IDC        Industrial Development Corporation          SETA         Sector Education and Training Authority
IDZ        Industrial Development Zone                 SIPs         Special Infrastructure Project

IoT        Internet of Things                          SMMEs        Small, medium and micro-enterprises

IPAP       Industrial Policy Action Plan               SSP          Sector Skills Plan

JSE        Johannesburg Stock Exchange                 StatsSA      Statistics South Africa
                                                                    Science, Technology, Engineering and
MBA        Master of Business Administration           STEM
                                                                    Mathematics
           Manufacturing, Engineering and Related
                                                                    Technical & Vocational Education and
merSETA    Services Sector Education and Training      TVET
                                                                    Training College
           Authority
           Metal and Electrical Workers Union of
MEWUSA                                                 UASA         United Association of South Africa
           South Africa
MIBCO      Motor Industry Bargaining Council           UIF          Unemployment Insurance Fund
           Metal and Engineering Industries
MIEBC                                                  VAT          Value Added Tax
           Bargaining Council
MISA       Motor Industry Staff Association            WIL          Work Integrated Learning
           National Association of Automobile
NAAMSA                                                 WSP          Workplace Skills Plan
           Manufacturers
NDP        National Development Plan                   WSS          Workplace Skills Survey

                                                                                                                  II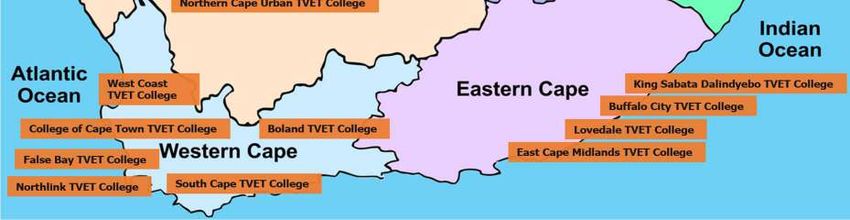
TABLE OF CONTENTS
OFFICIAL SIGN OFF ........................................................................................................................ I
ACRONYMS.................................................................................................................................. II
TABLE OF CONTENTS ................................................................................................................... III
LIST OF TABLES ........................................................................................................................... III
LIST OF FIGURES.......................................................................................................................... IV
MERSETA RESEARCH PROCESSES AND METHODS .......................................................................... V
1     SECTOR PROFILE .................................................................................................................. 1
   1.1 SCOPE OF COVERAGE ............................................................................................................ 1
   1.2 KEY ROLE PLAYERS ................................................................................................................. 5
   1.3 ECONOMIC PERFORMANCE ................................................................................................. 6
   1.4 EMPLOYER PROFILE ............................................................................................................. 13
   1.5 LABOUR MARKET PROFILE ................................................................................................. 15
   1.6 CONCLUSION ......................................................................................................................... 22
2     KEY SKILLS ISSUES .............................................................................................................. 23
   2.1 CHANGE DRIVERS ................................................................................................................ 23
   2.2 ALIGNMENT WITH NATIONAL STRATEGIES ................................................................... 29
   2.3 CONCLUSION ........................................................................................................................ 31
3     OCCUPATIONAL SHORTAGES AND SKILLS GAPS ......................................................... 32
   3.1 SKILLS SHORTAGES ............................................................................................................. 32
   3.2 SKILLS GAPS IN THE SECTOR .............................................................................................. 35
   3.3 EXTENT AND NATURE OF SUPPLY............................................................................................. 37
   3.4 TRAINING TO MEET THE NEEDS OF INDUSTRY 4.0 ....................................................... 42
   3.5 SKILLS SUPPLY SIDE CHALLENGES ................................................................................... 44
   3.6 PIVOTAL LIST ........................................................................................................................ 45
   3.7 CONCLUSION ......................................................................................................................... 47
4     PARTNERSHIPS .................................................................................................................. 48
   4.1 EXISTING PARTNERSHIPS AT THE MERSETA ............................................................................. 48
   4.2 PARTNERSHIP SUCCESSES .................................................................................................. 53
   4.3 CHALLENGES EXPERIENCED WITH PARTNERSHIPS ....................................................... 54
   4.4 CONCLUSION............................................................................................................................ 55
5     SKILLS PRIORITY ACTIONS .................................................................................................. 56
   5.1 SUMMARY OF FINDINGS FROM PREVIOUS CHAPTERS ..................................... 56
   5.2 RECOMMENDED SKILLS PRIORITY ACTIONS FOR MERSETA .............................. 57
   5.3 RECOMMENDED ACTIONS TO GUIDE MERSETA PLANNING ............................. 57
   5.4 CONCLUSION............................................................................................................................ 58
6     BIBLIOGRAPHY................................................................................................................... 59

LIST OF TABLES

Table 1: merSETA Scope of Coverage by SIC Code, Chamber and Industrial Sector .............................. 2
Table 2: Key Regulatory Organisations in the merSETA Scope of Coverage........................................... 5
Table 3: merSETA Companies by Size .................................................................................................. 14
Table 4: merSETA Companies by Size and Chamber ............................................................................ 14
Table 5: merSETA Provincial Distribution of Employees ...................................................................... 17
Table 6: Occupational Categories of employees by Chamber ............................................................. 18
Table 7: Educational Levels of Employers in merSETA Scope of Coverage........................................... 19
Table 8: Gender Distribution of merSETA Employees ......................................................................... 20
Table 9: Employees with Disabilities by Occupational Group and Chamber ........................................ 21

                                                                                                                                             III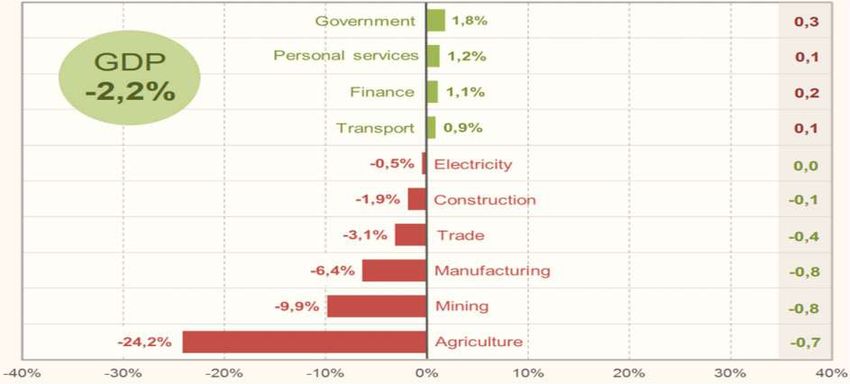
Table 10: Industry Drivers .................................................................................................................... 23
Table 11: Total Vacancies in the Sector by Occupational Category ..................................................... 32
Table 12: Reasons for Hard to Fill Vacancies by Occupational Category .............................................. 33
Table 13: Hard to Fill Vacancies by Occupation ................................................................................... 34
Table 14: Example of the vision of future production for a Machine Operator ................................... 43
Table 15: merSETA PIVOTAL List ........................................................................................................... 46
Table 16: National and Provincial Government Partnerships............................................................... 50
Table 17: Partnerships with Higher Education Institutions .................................................................. 50
Table 18: Partnerships and Mitigation Strategy ................................................................................... 54
LIST OF FIGURES
Figure 1: merSETA Scope of Coverage by SIC Code and Chamber ......................................................... 1
Figure 2: Metal Sector Supply Chain ....................................................................................................... 3
Figure 3: Plastics Sector Supply Chain..................................................................................................... 3
Figure 4: New Tyre Sector Value Chain ................................................................................................... 4
Figure 5: Automotive Sector Supply Chain ............................................................................................. 4
Figure 6: Motor Sector Supply Chain ...................................................................................................... 5
Figure 7: GDP Quarter 1, 2018 ................................................................................................................ 7
Figure 8: mer Sector Production 2007 - 2018 ......................................................................................... 8
Figure 9: mer Sector Production Growth 2007 - 2018 ........................................................................... 9
Figure 10: mer Sector Sales 2007 - 2018 ................................................................................................ 9
Figure 11: mer Sector Sales Growth 2007 - 2018 ................................................................................. 10
Figure 12: merSETA Companies by Chamber and Province ................................................................. 15
Figure 13: Formal and Informal Employment ...................................................................................... 16
Figure 14: Informal Employment ......................................................................................................... 16
Figure 15: Highest Level of Education Attained by merSETA Employees ............................................. 18
Figure 16: Gender Distribution of Employees According to Occupational Groups ............................. 19
Figure 17: Racial Distribution of Employees ......................................................................................... 20
Figure 18: Age Distribution of Employees ............................................................................................ 21
Figure 19: Occupational Categories and Gender of Employees with Disabilities ................................. 22
Figure 20: Circular Economy ................................................................................................................ 24
Figure 21: Advanced Manufacturing .................................................................................................... 26
Figure 22: Skills gaps by occupational group ...................................................................................... 35
Figure 23: Reasons for Skills gaps by occupational group ................................................................... 36
Figure 24: Number of National Diplomas Awarded in Selected Engineering Fields ............................. 38
Figure 25: First Degrees Awarded in Selected Engineering Fields ........................................................ 38
Figure 26: Apprenticeships Entered and Certified ............................................................................... 40
Figure 27: Learnerships Entered and Certified .................................................................................... 40
Figure 28: Skills Programme Registrations and Completions ............................................................... 41
Figure 29: Percentage Mathematics and Physical Science Pass Rate .................................................. 44
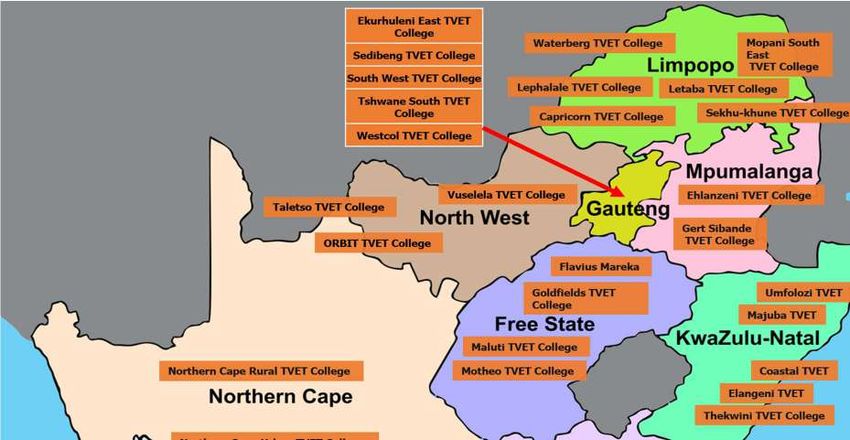
Figure 30: Map of TVET Colleges who have Partnership Agreements with merSETA .......................... 49
IV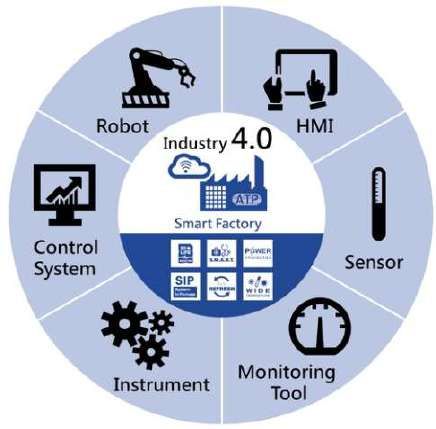
MERSETA RESEARCH PROCESSES AND METHODS
merSETA’s SSP research process should not be seen as a process consisting of phases that follow on each other. The research process should be
seen as a process of various activities occurring simultaneously to ensure the most accurate data is presented in the SSP. The main activities
which can be seen as part of the process, although not exhaustive include the analysis of Workplace Skills Plans (WSPs), considering Chamber
research report findings, desktop research, secondary data analyses, and, consultations with the SSP committee, Governance and Strategy
Committee and Chamber Committees. The WSP data is analysed for vacancies, employment, unfilled vacancies, number of companies, PIVOTAL
plan, OFO codes and Chamber statistics. The WSP forms the largest, most reliable source of information from our stakeholders directly. Findings
from Chamber research reports feed into the SSP as well.

The WSP for 2018 comprised information at individual employee level which yields more accurate information with respect to occupations and
job titles. The data represents information from over 4600 companies, who submitted details of over 550 000 employees. The data was weighted
to represent industry totals based on the levy amount paid. The levy amount from each company is used as a proxy for employment. Each of the
mer sectors was weighted according to levy categories (based on size and income). The weights were then applied to each employee in the data
set.

Desktop research informs the direction of sector requirements in terms of skills and informs the verification process whilst Chamber workshops
enable merSETA to gain key inputs for any skills omitted in the desk research verification and anecdotal updates while also providing a context
to the skills list. The Accounting Authority assists with a high level review of skills verification and anecdotal updates. The table below indicates
the research projects that have fed into the 2019/2020 SSP.

Projects that have fed into the 2019/2020 SSP

 Project     Topic          Study Design /    Objectives           Data Collection Tool       Sample Size          Scope of Study                  Data Sources Used         Time
                            methodology                                                                                                                                      Frame
 Composit    Developme      Qualitative and   The objective of     Value-chain approach       Total sample size:   A selection of companies that   - Plastics Chamber        October
 es Skills   nt of Skills   quantitative      this project is to   consisting of:             between 20-25        represent the broad scope of    Regional Workshops        2015-
 Mapping     and            triangulations.   develop a skills     compiling a value          companies.           the composite manufacturing                               March
 Project     Occupation                       and occupations      chain of the                                    processes. Key staff,           - Plastics Chamber        2016
             Map for                          map for the          manufacturing                                   ECO/owner, production           Research Project (Phase
                                              composites           processes, link a job or                        managers and R&D managers.      II and Phase III).

                                                                                                                                                                                       V
Composites                        industry, in         jobs to each mode of
             Industry.                         support of the       the value chain,
                                               Composites           compile a skills profile
                                               Industry             of each job including
                                               revitalisation       products or services,
                                               project              task, core skills and
                                               spearheaded by       foundational
                                               CSIR Strategic       knowledge. Interviews
                                               Implementation       with key staff, selected
                                               Unit (SIU).          plant visits.

Project      Topic          Study Design /     Objectives           Data Collection Tool       Sample Size      Scope of Study                    Data Sources Used         Time
                            methodology                                                                                                                                     Frame
Skills       Skills needs   The                The primary          Focus Groups, Surveys,     Interviews: 44   The scope of region 1:            Desktop review of         June
Supply       in the         methodology        focus of the         Workshops, Interviews      Surveys: 167     Gauteng, North West               relevant literature,      2017 –
and          SMME, Co-      included a         study was to                                                     Province, Mpumalanga and          policy, legislative and   June
Demand       operative      combination of     understand the                                                   Limpopo.                          regulatory frameworks     2018
Study        and non-       quantitative       skills                                                                                             and industry drivers.
(Region 1)   formal         and qualitative    development                                                      The study covers the              WSPs/ATRs, Employer
             sectors of     approaches.        challenges and                                                   merSETA’s formal, informal,       Database (Levy & Non-
             the            These include      potential that                                                   SMME and cooperative              levy Payers), Strategic
             merSETA        desktop review     exists across the                                                segments across its chambers      Programmes e.g. Co-
                            of relevant        enterprise                                                       as well as merSETA regions.       operatives Programme,
                            literature,        segments within                                                  The scope of the study            Chamber research.
                            interviews with    the merSETA                                                      includes the following areas of
                            employers,         scope of                                                         inquiry:
                            training           coverage.
                            providers, trade                                                                    The nature and character of
                                               The objectives
                            unions, industry                                                                    economic, labour market and
                                               included to:
                            associations                                                                        government policy/strategy
                            and provincial     Identify and                                                     impacting on the skills needs
                            government;        document the                                                     of the different segments;
                            and field          character and
                            research           scale of labour                                                  - The nature and character of
                            (surveys) of the   and skills needs                                                 business operations of the
                            informal sector,   in relation to the                                               different chambers and the
                            employers and      stakeholder                                                      impact thereof on skills needs
                            of training        segments of the
                            providers.         merSETA

                                                                                                                                                                                 VI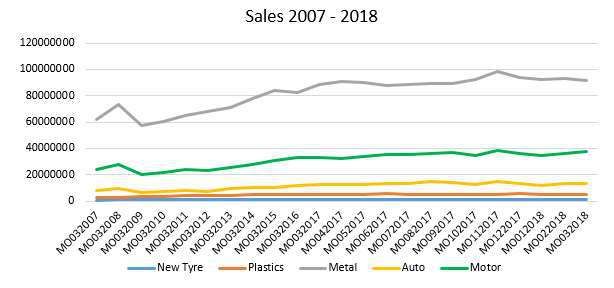
- Understand
                                          why these labour                                                - Insight into regional and local
                                          and skills needs                                                government developments
                                          exist (the change                                               and links to skills planning
                                          driver of the
                                          nature of work                                                  - The scale and nature of skills
                                          and of skills)                                                  needs in the short to medium
                                                                                                          term in the mer sector
                                          - Evaluate the
                                          appropriateness                                                 - In-depth analysis of the
                                          of different                                                    unique skills systems that exist
                                          education and                                                   within the segments and
                                          skills                                                          across the provinces/regions
                                          development
                                          practices and                                                    - Challenges in relation to the
                                          responses in                                                    supply of labour and skills
                                          relation to labour
                                          and skills needs                                                - Opportunities for effective
                                          identified                                                      development of skills
                                                                                                          Contrasting the training
                                          Fundamentally,
                                                                                                          approaches, activities and
                                          the research
                                                                                                          benefits of training for small
                                          project should
                                                                                                          and informal businesses with
                                          assist in further
                                                                                                          those of larger enterprises
                                          developing a
                                                                                                          with specific attention to
                                          sustainable skills
                                                                                                          different modes of training,
                                          development
                                                                                                          and sources of provision
                                          support strategy
                                                                                                          (public / private / workplace
                                          for these sector
                                                                                                          based, etc.)
                                          segments and
                                          contribute to the
                                          merSETA’s Sector
                                          Skills Plan (SSP)
                                          and Strategic
                                          Plan (SP).
Project   Topic          Study Design /   Objectives           Data Collection Tool    Sample Size        Scope of Study                      Data Sources Used         Time
                         methodology                                                                                                                                    Frame
Skills    Skills needs   The              The primary          Focus Groups, Surveys   Interviews: 71     Region 2: Northern Cape, Free       Desktop review of         June
Supply    in the         methodology      focus of the         and Interviews                             State, Western Cape                 relevant literature,      2017 –
and       SMME, Co-      included a       study is to                                  Focus groups: 15                                       policy, legislative and   June
Demand    operative      combination of   understand the                                                                                      regulatory frameworks     2018

                                                                                                                                                                             VII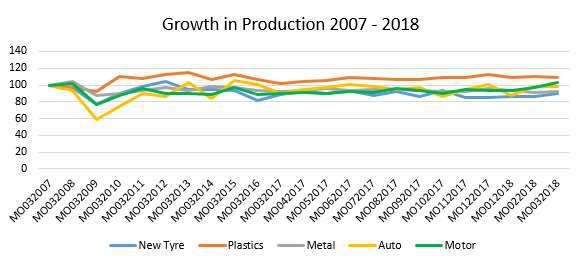
Study        and non-     quantitative      skills                                                                  and industry drivers.
(Region 2)   formal       and qualitative   development          Surveys: 732   The study covers the                WSPs/ATRs, Employer
             sectors of   approaches as     challenges and                      merSETA’s formal, informal,         Database (Levy & Non-
             the          well as           potential that                      SMME and cooperative                levy Payers), Strategic
             merSETA.     triangulation.    exists across the                   segments across its chambers        Programmes e.g. Co-
                                            enterprise                          as well as merSETA regions.         operatives Programme,
                                            segments within                     The scope of the study              Chamber research.
                                            the merSETA                         includes the following areas of
                                            scope of                            inquiry:
                                            coverage. While
                                            the merSETA is                      The nature and character of
                                            for the most part                   economic, labour market and
                                            au fait with its                    government policy/strategy
                                            levy paying                         impacting on the skills needs
                                            stakeholders,                       of the different segments;
                                            non-levy payers
                                            and informal                        - The nature and character of
                                            employment is                       business operations of the
                                            not well                            different chambers and the
                                            understood. The                     impact thereof on skills needs
                                            study therefore
                                            seeks to identify                   - Insight into regional and local
                                            key features of                     government developments
                                            labour and skills                   and links to skills planning
                                            demand and
                                                                                - The scale and nature of skills
                                            supply from
                                                                                needs in the short to medium
                                            employer and
                                                                                term in the mer sector
                                            worker
                                            perspectives.
                                                                                - In-depth analysis of the
                                            The objectives of                   unique skills systems that exist
                                            the study are to:                   within the segments and
                                            - Identify and                      across the provinces/regions
                                            project the
                                            character and                       - Challenges in relation to the
                                            scale of labour                     supply of labour and skills
                                            and skills needs
                                                                                - Opportunities for effective
                                            in relation to the
                                                                                development of skills
                                            stakeholder
                                            segments of the
                                            merSETA

                                                                                                                                              VIII
- Understand why                                                Contrasting the training
                                              these labour and                                                approaches, activities and
                                              skills needs exist                                              benefits of training for small
                                              - Evaluate the                                                  and informal businesses with
                                              appropriateness                                                 those of larger enterprises
                                              of different                                                    with specific attention to
                                              education and                                                   different modes of training,
                                              skills                                                          and sources of provision
                                              development                                                     (public / private / workplace
                                              practices and                                                   based, etc.)
                                              responses in
                                              relation to labour
                                              and skills needs
                                              identified.

                                              Fundamentally,
                                              the research
                                              project should
                                              assist in further
                                              developing a
                                              sustainable skills
                                              development
                                              support strategy
                                              for these sector
                                              segments and
                                              contribute to the
                                              merSETA’s Sector
                                              Skills Plan (SSP)
                                              and Strategic
                                              Plan (SP).
Project      Topic          Study Design /    Objectives           Data Collection Tool    Sample Size        Scope of Study                   Data Sources Used         Time
                            methodology                                                                                                                                  Frame
Skills       Skills needs   The               The primary          Focus Groups, Surveys   Interviews: 74     Region 3: Kwa-Zulu Natal and     Desktop review of         June
Supply       in the         methodology       focus of the         and Interviews                             Eastern Cape                     relevant literature,      2017 –
and          SMME, Co-      included a        study is to                                  Focus groups: 12   The study covers the             policy, legislative and   June
Demand       operative      combination of    understand the                                                  merSETA’s formal, informal,      regulatory frameworks     2018
Study        and non-       quantitative      skills                                       Surveys: 609       SMME and cooperative             and industry drivers.
(Region 3)   formal         and qualitative   development                                                     segments across its chambers     WSPs/ATRs, Employer
             sectors of     approaches as     challenges and                                                  as well as merSETA regions.      Database (Levy & Non-

                                                                                                                                                                                  IX
the well as potential that The scope of the study levy Payers), Strategic
merSETA. triangulation. exists across the includes the following areas of Programmes e.g. Co-
enterprise inquiry: operatives Programme,
segments within Chamber research.
the merSETA The nature and character of
scope of economic, labour market and
coverage. While government policy/strategy
the merSETA is impacting on the skills needs
for the most part of the different segments;
au fait with its
levy paying - The nature and character of
stakeholders, business operations of the
non-levy payers different chambers and the
and informal impact thereof on skills needs
employment is
not well - Insight into regional and local
understood. The government developments
study therefore and links to skills planning;
seeks to identify
key features of - The scale and nature of skills
labour and skills needs in the short to medium
demand and term in the mer sector
supply from
- In-depth analysis of the
employer and
unique skills systems that exist
worker
within the segments and
perspectives.
across the provinces/regions
The objectives of
the study are to: - Challenges in relation to the
- Identify and supply of labour and skills
project the
character and - Opportunities for effective
scale of labour development of skills
and skills needs Contrasting the training
in relation to the approaches, activities and
stakeholder benefits of training for small
segments of the and informal businesses with
merSETA those of larger enterprises
with specific attention to
different modes of training,
and sources of provision
X- Understand why (public / private / workplace
these labour and based, etc.)
skills needs exist
- Evaluate the
appropriateness
of different
education and
skills
development
practices and
responses in
relation to labour
and skills needs
identified
Fundamentally,
the research
project should
assist in further
developing a
sustainable skills
development
support strategy
for these sector
segments and
contribute to the
merSETA’s Sector
Skills Plan (SSP)
and Strategic
Plan (SP).
Project Topic Study Design / Objectives Data Collection Tool Sample Size Scope of Study Data Sources Used Time
methodology Frame
Metal Benchmarki Mixed method: The objectives of Interviews 12 from the Explore other models of - MerSETA database 26 June
Chamber ng Study of qualitative and this research following training lay-off and September.2017 2017 -
Research Models of quantitative study were to: Focus Groups organisations: retrenchment mitigation March
Phase 4 Training - MerSETA schemes. - Statistics South Africa. 2018
Lay-off and - Review the Case study Labour Force Survey
Retrenchme effectiveness and - Commission for
nt efficiency of the Conciliation, - The Star Online
Training Layoff
- Trading Economics
XIMitigation Scheme in the mediation and
Schemes metal industry Arbitration - Intersectoral
agreement lays basis for
- Identify similar - Azimon training system reform’,
models of Consulting European Industrial
retrenchment Relations Survey Online.
mitigation - Department of
schemes Labour - Auditor-General of SA.
successfully 2017. Training Layoff
applied in other - Solidarity Scheme Value Chain
countries DCD Ring-rollers Analysis.
Make - Comparative review of
recommendation unemployment and
s to either employment insurance
improve the experiences in Asia and
current Training worldwide. ILO/Japan
Layoff Scheme or Multi-bilateral
replace it with a programme. Regional
better office for Asia and the
alternative Pacific. ILO
- Exploring the Full Use
of Partnerships and a
Multi-Faceted Job Saving
Strategy to More
Effectively Address Job
Loss and Deepening
Poverty.
- Financial Mail. 2017.
Bid to save the industry.
- Government of
Malaysia. 2017.
Employment Insurance
System Bill 2017.
- Training, employment
and ‘employability’:
responding to the jobs
XIIcrisis’ University of
Birmingham,
Birmingham, UK.
- ILO. 2009. Protecting
people, promoting jobs.
A survey of country
employment and social
protection policy
responses to the global
economic crisis: An ILO
Report to the G20
Leaders’ Summit,
Pittsburgh, 24–25
September 2009,
Geneva.
- ILO. 2013. A
comparative review of
unemployment and
employment insurance
experiences in Asia and
worldwide. International
labour Organisation.
- ILO. 2015. The design
of an employment
insurance system for
Malaysia. ILO: Bangkok.
Mass, G. 2015.
Supporting job-to-job
transitions in Sweden.
Friedrich Ebert Stiftung:
Stockholm
Project Topic Study Design / Objectives Data Collection Tool Sample Size Scope of Study Data Sources Used Time
methodology Frame
Motor Investigate Mixed method: The research The research - Qualitative The scope of work has a - merSETA Motor June
Chamber the qualitative and objective was to methodology research deliberately narrow focus on Chamber Research 2017
Research relevancy of quantitative understand what combines: participants (Tier two discreet elements of the Reports; March
Phase 4 occupations impact the 1 automotive motor industry value chain, 2018
XIIIand skills for Motor Industry - Desktop research manufacturers): which are covered in two - merSETA Sector Skills
the motor trends have on 21 separate “research streams” Plan
industry skills and - Qualitative primary - Quantitative in the report. - Sector Skills plans of
occupations in research research other SETA associated to
the workplace. In Quantitative primary participants (Tier Research Stream I: the Motor Industry
doing so, to research 1 automotive Considers the skills - MIBCO Occupational
determine: manufacturers): development needs of OEM- Research Project
29 approved vehicle component - Automotive Supply
- How the market - Qualitative manufacturers (referred to Chain Competitiveness
and consumer research henceforth as “Tier 1 Initiative (ASCCI)
trends have participants automotive manufacturers”) Durban Automotive
changed motor (Automotive Cluster (DAC) Research
vehicles. aftermarket This research was conducted Reports
services and by Benchmarking and
- How changes in support): 20 Manufacturing Analysts SA
vehicle Quantitative (Pty) Ltd (BMA)
specifications research
have affected the participants Research Stream II:
maintenance and (Automotive This stream deals with the
repair of vehicles. aftermarket aftermarket services and
- How the services and support provided by
changes in support): 45 automotive dealer and
vehicle distribution establishments
specifications (referred to as “automotive
have affected the aftermarket services and
manufacturing support”)
components for This research was conducted
vehicles. by the MIBC
- How
operational
changes in the
manufacturing,
maintenance and
repair of motor
vehicles have
affected
occupations.
XIV- What skills and
competencies
are required to
fulfil
occupational
roles?
- What can be
done to develop,
reform and
upskill people to
become
relevant?
- What can be
done to develop
the skills that do
not exist?
- What
implications
workplace
reorganisation
and skills reform
have on skills and
labour
authorities?
New data (in terms of skills demand) is also coming from the WSS questions that we have incorporated into the WSP (hard to fill vacancies and skills gaps), and interviews
with stakeholders (each chamber had been covered both employer and labour).
XV1 SECTOR PROFILE
The purpose of this chapter is to present the profile of the manufacturing, engineering and
related services sector. It elaborates on the sector scope of coverage, key role players,
economic performance and the profile of employers and employees. The chapter also
describes the major sector characteristics that influence sector skills needs and skills
development requirements.
1.1 SCOPE OF COVERAGE
The merSETA, established in terms of the skills development legislation of 1998, includes a
range of manufacturing activities in addition to a few related service and retail activities. On
the basis of the three-digit Standard Industrial Classification (SIC) codes used in capturing the
data for the National Accounts, Figure 1 below outlines the industrial activities aligned to the
merSETA scope of coverage and classifies them by Chamber. The figure depicts the
interrelationships between the Chambers and demonstrates flow of inputs.
Figure 1: merSETA Scope of Coverage by SIC Code and Chamber (**SIC codes are presented in the grey boxes)
As demonstrated in Figure 1, merSETA member companies belong to one of five Chambers.
This five-chamber structure does not however totally align with the National Accounts data
which refers to the metal sector, the automotive sector (combining the Auto, Motor and New
Tyre Chambers) and the Plastics Manufacturing Industry. Furthermore, while the majority of
merSETA firms fall within the overall manufacturing sector in the National Accounts data and
make up a sizeable proportion of total South African manufacturing, the merSETA also
includes firms that fall into the retail with particular reference to the Motor Retail Sector
which forms part of the Motor Chamber. In terms of the specific Standard Industrial
Classification codes that fall into the merSETA scope of coverage, Table 1 below outlines the
codes at 3 digit level, Chamber and industrial sector.
1Table 1: merSETA Scope of Coverage by SIC Code, Chamber and Industrial Sector
CHAMBER SIC DESCRIPTION SECTOR
Auto 381 manufacture of motor vehicles Manufacturing
351 manufacture of basic iron and steel
352 manufacture of basic precious and non-ferrous metals
353 casting of metals
manufacture of structural metal products, tanks, reservoirs and steam
354
generators
355 manufacture of other fabricated metal products; metalwork service activities
356 manufacture of general purpose machinery
357 manufacture of special purpose machinery
358 manufacture of household appliances n.e.c.
361 manufacture of electric motors, generators and transformers
362 manufacture of electricity distribution and control apparatus
363 manufacture of insulated wire and cable
365 manufacture of electric lamps and lighting equipment
366 manufacture of other electrical equipment n.e.c. Manufacturing
Metal 371 manufacture of electronic valves and tubes and other electronic components
manufacture of television and radio transmitters and apparatus for line
372
telephony and line telegraphy
manufacture of television and radio receivers, sound or video recording or
373
reproducing apparatus and associated goods
manufacture of medical appliances and instruments and appliances for
374 measuring, checking, testing, navigating and for other purposes, except
optical instruments
375 manufacture of optical instruments and photographic equipment
384 building and repairing of ships and boats
385 manufacture of railway and tramway locomotives and rolling stock
386 manufacture of aircraft and spacecraft
387 manufacture of transport equipment n.e.c.
503 building installation
Construction
504 building completion
manufacture of bodies (coachwork) for motor vehicles; manufacture of
382
trailers and semi-trailers
Manufacturing
383 manufacture of parts and accessories for motor vehicles and their engines
387 manufacture of transport equipment n.e.c.
Motor 631 sale of motor vehicles
632 maintenance and repair of motor vehicles
633 sale of motor vehicle parts and accessories Retail
sale, maintenance and repair of motor cycles and related parts and
634
accessories
New Tyre 337 manufacture of rubber products Manufacturing
334 manufacture of basic chemicals
Plastics 338 manufacture of plastic products Manufacturing
395 recycling n.e.c.
1.1.1 Industrial Overview
This section provides a depiction of each of merSETA sectors’ industrial activities and outputs.
It starts with the metals sector which comprise metal foundries, fabricators, manufacturers
and recyclers making inputs into (but not limited to) the automotive sector which also draws
inputs from the plastics and new tyre sectors.
2Metal Sector
The metal sector, including capital equipment, foundries, transport equipment, metal
fabrication (CETEMF) and related sub-sectors, form a substantial part of South Africa’s
manufacturing. The production of this sector is based on the county’s rich natural endowment
in a wide range of metals.
Foundries and metal fabricators produce the intermediate (and sometimes final) products that
will be received by metal manufacturers who convert them to final products. Key markets for
metal products are the auto sector and the construction industry. Metal recyclers complete
and restart the cycle by returning scrap metal to the beginning of the value chain and
manufacturing process to be reused in the production of new products (merSETA Supply and
Demand Study, 2018). Among metal manufacturers and metal recyclers, the metals sector has
some of the smallest businesses.
Figure 2: Metal Sector Supply Chain (Source: merSETA Supply and Demand Study, 2018)
Metallurgical
Exploration, and beneficiation and
extraction shaping Manufacturing
Mining Conversion
beneficiation
Plastics Sector
The merSETA’s plastics manufacturing sector is largely composed of small firms, as barriers to
entry are relatively low (DTI, 2013). The vast majority of firms are not listed in the
Johannesburg Stock Exchange (JSE) (merSETA, 2013). Local and imported polymers are
converted into a range of intermediate and final products. The products form a critical input
into a range of other sectors. More than half (52%) of South Africa’s plastics manufacturing
serves the local food and general packaging market. Other market sectors include building and
construction, automotive, agriculture, medical, household goods, clothing and footwear, toys
and leisure equipment.
Figure 3: Plastics Sector Supply Chain (Source: merSETA Supply and Demand Study, 2018)
Supply of raw
material
suppliers Conversion Assembling
Polymer Finishing Recycling
compounding/ follows more
blending or less the
same process
3New Tyre Sector
The tyre sector is responsible for the production of new tyres. With just four locally based
manufacturers, there are even fewer new tyre manufacturers based in South Africa than auto
OEMs (merSETA Supply and Demand Study, 2018). Good Year, Bridgestone, Continental Tyres
and Sumitomo Rubber are international heavyweights with production facilities in South
Africa. Production of tyres is limited to 3 provinces: North West, KwaZulu-Natal and the
Eastern Cape (merSETA Supply and Demand Study, 2018).
Figure 4: New Tyre Sector Value Chain (Source: merSETA Supply and Demand Study, 2018)
Banbury
mixing of
over natural
rubber and Rubber
raw extrusion Curing
chemicals and cooling vulcanization Finished
Milling of Components Inspection
homogenous assembling and
rubber into building
flat long
strips
Automotive Sector
The automotive sector, incorporating Original Equipment Manufacturers (OEMs), the New
Tyre Chamber and Motor Chamber, includes companies linked to each other through the
automotive production and distribution value chain. The metals, plastics and rubber product
sectors provide key inputs into the components manufacturing and vehicle assembly sections
of the value chain.
Due to the capital requirements and technical nature of producing vehicles there are only a
handful of Auto OEMs in South Africa, all of which are international brands (merSETA Supply
and Demand Study, 2018). South Africa’s main sites for automobile production are the Eastern
Cape, specifically Port Elizabeth and East London, Gauteng, specifically Rosslyn and Silverton
(Pretoria) and KwaZulu-Natal (KZN), specifically Durban (merSETA Supply and Demand Study,
2018). The Auto Sector has some of the largest scales of operation of all the sectors.
Figure 5: Automotive Sector Supply Chain (Source: merSETA Supply and Demand Study, 2018)
Press shop Finished
and chassis Paint shop Soft trim vehicle
Electroplating Hard trim Final
assembly
4Motor Sector
Within the motor manufacturing sector, the only key sub-sector is component and assembly
manufacturers (merSETA Supply and Demand Study, 2018). These are companies that
manufacture vehicle components, parts and equipment. This sector interlinks with the auto
sector as it supplies components used in the manufacture of vehicles. The sector also interlinks
to motor sales and service in that the manufactured components are sold to independent
parts sellers. Due to the increased resource needs and skills required to produce some
components (i.e. compliance to meet the standards of Auto OEMs), major employers in this
sector tend to be larger businesses. Components that are manufactured relate to various
phases of the auto value chain from upstream manufacturing of casts, to downstream
trimming (merSETA Supply and Demand Study, 2018).
Figure 6: Motor Sector Supply Chain (Source: merSETA Supply and Demand Study, 2018)
Component
Raw material manufacturing Supplies and
processing and assembly logistics
Research and Finished auto OEM parts
Development parts
1.2 KEY ROLE PLAYERS
The industry is shaped primarily by government, industry and organised employers and
labour. The key role players within the mer sector include industry bodies, employer
associations, government departments and institutions that provide policy direction or play a
regulatory role. Table 2 below briefly identifies and describes the role of these players in
industry.
Table 2: Key Regulatory Organisations in the merSETA Scope of Coverage
ORGANISATION
NAME OF ORGANISATION COLLECTIVE ROLE
TYPE
Department of Highest Education and Training (DHET) Government’s role is to ensure adequate
Government Department of Trade and Industry (DTI) policies and legislation are in place to
Departments Department of Science and Technology (DST) facilitate sustainable economic as well as
Department of Environmental Affairs (DEA) address social issues.
The Steel and Engineering Industries Federation of
Southern Africa (SEIFSA)
Automobile Manufacturers Employers Organisation
(AMEO)
Retail Motor Industry Organisation (RMI)
National Association of Automobile Manufacturers Employer organisations represent
Employer
(NAAMSA) members in collective bargaining, data
Organisations
National Association of Automotive Component and and information gathering and skills
Allied Manufacturers (NAACAM) development.
Automotive Industry Export Council (AIEC)
The South African Tyre Manufacturers Conference
(SATMC)
Plastics South Africa (PlasticsSA)
Professional Its core functions are the accreditation
Engineering Council of South Africa (ECSA)
Organisations of engineering programmes, registration
5ORGANISATION
NAME OF ORGANISATION COLLECTIVE ROLE
TYPE
of persons as professionals in specified
categories, and the regulation of the
practice of registered persons.
National Bargaining Forum (NBF) The Labour Relations Act provides for
Metal and Engineering Industries Bargaining Council the self-regulation of industries through
(MIEBC) the medium of Bargaining Councils.
Bargaining Motor Industry Bargaining Council (MIBCO) Bargaining Councils deal with collective
Councils agreements, solve labour disputes,
Bargaining Council for the New Tyre Manufacturing establish various schemes and make
Industry proposals on labour policies and laws
(DoL, 2016).
National Union of Metalworkers South Africa (NUMSA)
Chemical Energy Paper Printing Wood and Allied workers Unions play a significant role in
Labour Union (CEPPWAWU) advocating and fighting for worker's
Organisations Metal and Electrical Workers Union of South rights, skills development and improving
Africa (MEWUSA) conditions of employment and
Solidarity advocating for transformation among
United Association of South Africa (UASA) other things.
Motor Industry Staff Association (MISA)
1.3 ECONOMIC PERFORMANCE
South Africa has experienced a period of protracted economic weakness, mainly as a result of
domestic constraints. This is reflected in low levels of private investment, growing
unemployment, and declining real per capita income in recent years (National Treasury,
2018). During the first quarter of 2017 the South African economy was categorised by
numerous challenges which pulled the economy into uncertainty. These include cabinet
reshuffles, allegations of state capture, the promulgated Mining Charter, the debacle with
respect to the mandate of the Reserve Bank and the deterioration of the country’s fiscal
stance. These challenges lead to policy and political uncertainty which eroded business and
consumer confidence resulting in a negative economic outlook. These factors in turn
undermined the growth of the manufacturing sector and the economy in general.
Political uncertainty was one of the contributing factors to the economic decline. During this
period, the proportion of manufacturers who indicated that politics is a constraint on doing
business in South Africa, increased from 76% to 87% (Grocotts, 2017). Thus, business had to
adopt strategies to accommodate the changing economic situation through learning to adapt
to such policy environment ‘shocks’ (Grocotts, 2017). In June 2017, the country plunged into
a technical recession with Moody’s confirming South African credit rating outlook as
remaining negative (Trading Economics, 2017). Political certainty and political stability
remains an important factor in economic growth as it directly impacts policy certainty and
governance among other factors.
In the last quarter of 2017, it was reported that the economy grew by 3.1% however this trend
was reversed in the first quarter of 2018 when GDP contracted by 2.2%, the largest decline
since 2009 (StatsSA, 2018). The figure below shows that the decline was due to agriculture,
mining and manufacturing with the electricity, construction and trade industries also
recording negative growth.
6Figure 7: GDP Quarter 1, 2018 (StatsSA, 2018)
In South Africa, private investment has been contracting since 2015, mainly as a result of low
levels of business and consumer confidence. Growth has remained stuck below 2% and
unemployment remains high at 26.7% (National Treasury, 2018). Confidence and investment
are mutually reinforcing. In February 2018, Cyril Ramaphosa was sworn in as South African’s
new president resulting in stocks rising as much as 5% and the rand firming to its firmest since
early 2015 (BusinessTech, 2018). This in part, contributed to Moody’s upgrading its South
African credit outlook from negative to stable in March 2018 which prevented the country’s
pending credit downgrade to sub-investment grade. It was however indicated by Moody’s
that steady progress in meeting the objectives set out in the president’s state-of-the-nation
address in February 2018 was essential for the sustainability of the country’s economic and
fiscal prospects (BusinessTech, 2018).
Against the backdrop of a significantly improved political environment, which is impacting
positively on consumer, business and investor sentiment, alongside a relatively benign
inflation outlook, supportive monetary policy and more favourable prospects for the world
economy, including higher commodity prices, the outlook for the South African economy has
improved considerably (IDC, 2018). However, the VAT increase from 14% to 15%, effective 1
April 2018, as well as higher excise duties and the rise in the fuel levy, may limit projected
economic growth (IDC, 2018). This is likely to affect consumer spending which is a key driver
of economic growth.
In March 2008, South Africa’s central bank cut interest rates by 25 basis points, to 6.5 % (their
lowest in two years), after judging that inflation will remain low while economic growth was
faster than expected (South African Reserve Bank, 2018). This is a significant development
that will bolster the economy through increased consumer spending. Despite an increase in
VAT, NAAMSA projected that domestic vehicle sales in 2018 are to increase as a result of
reduced interest rates among other factors.
Developments in the global trading environment will be particularly important. South Africa
has an open economy as indicated by the sizeable shares of GDP, at 29.8% and 28.4%
respectively, claimed by exports and imports in 2017 (IDC, 2018). Therefore, South Africa is
strongly affected by global trade developments, directly and indirectly. Stronger demand from
South Africa’s key trading partners is anticipated to result in an improved export performance
7over the medium-term. Manufactured exports should benefit from increased demand in the
Eurozone and Sub-Saharan African markets, among others, but may face significant challenges
in the US market, as exemplified by the recently imposed tariffs on US imports of steel and
aluminium (IDC, 2018). Uncertainty surrounding Brexit may affect exports and financial flows
with one of South Africa’s largest European trading partners. The implementation of
economic reforms remain critical to facilitate faster growth and sustain the ongoing economic
recovery (Focus Economics, 2018). Unemployment remains high, reflecting skill shortages and
weak investment; inequalities in opportunities and incomes also remain high despite the
introduction of the proposed new minimum wage (OECD, 2018). Reforms to ease the cost of
doing business, boost entrepreneurship, lift competition barriers in many sectors and
facilitate the expansion of firms in the neighbouring region would boost productivity and help
create jobs (OECD, 2018). To increase investment in the country, President Cyril Ramaphosa
is leading a drive to attract R1.2 trillion ($100 billion) in new investment into the country
(MoneyWeb, 2018).
1.3.1 Manufacturing Production and Sales
Manufacturing production decreased by 3% in the first quarter of 2018 (seasonally adjusted)
The reduction was due mostly to petroleum, chemicals, rubber and plastic products
industries (-8,1% and contributing -2,0 percentage points) and the basic iron and steel, non-
ferrous metal products, metal products and machinery division (-3,0% and contributing -0,6
of a percentage point).
When considering the mer sectors, the figures below show production and production
growth, we highlight the growth in production by the merSETA sub-sectors in the last 11 years
(2007-2018) with 2007 as the base year. The figures show that the metals and motor sectors
(as described by standard industrial classification in the merSETA scope of coverage) produce
high volumes compared to the other sectors, however in terms of production growth, the
plastics sector has fared well over time although showing slight decline by the need of the
third quarter of 2018. The motor and tyre sectors (automotive components) sectors seem to
be on an upward trend with the auto sector (auto assembly) showing slowed growth by the
end of the third quarter of 2018.
Figure 8: mer Sector Production 2007 - 2018 (own calculations based on StatsSA data, Production and Sales,
2018)
8Figure 9: mer Sector Production Growth 2007 - 2018 (own calculations based on StatsSA data, Production and
Sales, 2018)
Sales growth is a key indicator of economic performance. In considering sales growth, we
highlight the growth in sales (Rands) of products produced by the merSETA sub-sectors in the
last 11 years (2007-2018) with 2007 as the base year. The sales figures as shown below show
a similar pattern with the metal, auto and motor sectors selling high volumes (sales), but metal
and auto sales growth has slowed with plastics, motor and tyre sectors faring well in terms of
sales growth over time.
Figure 10: mer Sector Sales 2007 - 2018 (own calculations based on StatsSA data Production and Sales, 2018)
9Figure 11: mer Sector Sales Growth 2007 - 2018 (own calculations based on StatsSA data Production and Sales,
2018)
The manufacturing sector remains a priority sector that has been earmarked for growth as
reflected in government policies such as the NDP and IPAP. Despite being arguably one of the
strongest manufacturing bases in Africa, challenges remain. Speaking during a briefing to
Parliament's Portfolio Committee on Trade and Industry on the state of manufacturing, World
Trade Organisation and the Industrial Policy Action Plan (IPAP), Trade and Industry Minister
Rob Davis indicated that the decline in the manufacturing sector over the years has been
attributed to digital production and changes in manufacturing technologies (DTI, 2017).
Minister Rob Davis also reiterated that to grow the manufacturing sector, a domestic and
“tightly coordinated” supportive environment premised on policy and programmatic certainty
needs to be developed (DTI, 2017). Policy innovation is therefore important in the wake of
fast paced changes that have disrupted every sector.
1.3.2 Economic Performance of Each Economic Sector
In the next sub-sections we explore the economic performance of each sub-sector that
belongs to the merSETA scope of coverage.
Automotive Sector
Despite the political and economic uncertainty in the country during 2017, the automotive
sector ended the year on a positive note (WesBank, 2018). Vehicle and component production
(with the auto sector the largest manufacturing sector in the country) accounted for 30.1% of
South Africa’s manufacturing output (Engineering News, 2018). The broader automotive
industry’s contribution to the country’s GDP in 2017 was 6,9% (4.4% manufacturing and 2.5%
retail) down from 7.4% in 2016 (Engineering News, 2018a). Considering that vehicle and
component manufacturing comprises nearly a third of the country’s manufacturing output,
the automotive industry supported by the merSETA, is and will remain essential to the growth
and success of the South African economy. Key developments in the automotive sector in
2017 include:
Total industry employment at the end of December 2017 totalled 29 808 reflecting an
increase of 275 jobs (gain of 0.93%) compared to the 29 533 industry head count at the
end of September 2017 (NAAMSA, 2018).
10 Record total investment by the major vehicle manufacturers in 2017 amounted to R8.17
billion (NAAMSA, 2018).
South African vehicle production decreased to 592 145 vehicles in 2017 from 600 008
units produced in 2016 – a fall of 1.3% (NAAMSA, 2018).
South Africa’s share of global new vehicle production declined to 0.61% in 2017, down
from 0.63% in 2016 (NAAMSA, 2018).
Total industry new car sales for quarter four of 2017 was 94721 units, an improvement
of 5497 units (gain of 6.2%) compared to the 89224 new cars sold during the
corresponding quarter of 2016. Domestic new vehicle sales showed improvement, year
on year, whilst export sales were lower (NAAMSA, 2018).
As South Africa managed to avoid a further downgrade at the end of the first quarter of 2018,
NAAMSA anticipates that economic growth could recover to a level above 1.5% in 2018 with
new vehicle sales possibly expanding between 2% and 4% (NAAMSA, 2018). Industry new
vehicle exports will remain a function of the performance and direction of global markets.
Indications for the global economy are reasonably positive with the latest International
Monetary Fund (IMF) projections anticipating global growth at around 3.7% which should
benefit vehicle exports to Europe, Australasia and Asia. NAAMSA anticipates that export sales
could see a modest growth during 2018; currently, an increase of around 11% (a total of
366 050) export sales are anticipated for 2018 (NAAMSA, 2018; IMF, 2018). A central
development in the auto sector was the announcement of Mercedes Benz that it will invest
R10 billion (€600 million) into the expansion of the East London plant in South Africa (IOL,
2018). This will create greater demand several supplier industries, stimulating new investment
and job creation emphasising a commitment to revive economic growth in the country (IOL,
2018).
Motor Sector
According to Dr Azar Jammine, Director and Chief Economist at Econometrix, the South
African motor industry is holding up surprisingly well in a tough economic environment that
is being aggravated by political turmoil (RMI, 2018a). He also noted that although the country
was technically in a recession, with negative growth for two consecutive quarters, there were
some positive points in the local economy with the motor industry being one of them.
Encouraging factors for the industry include the rise in the demand for electricity, a lower-
than-expected inflation rate, vehicle price increases slowing, the price of fuel falling, a big
improvement in the motor industry trade balance and a brighter outlook for the global
economy (Wheels24, 2018).
Although the positive sentiments about the South African economy will impact the
automotive industry, it will take time to generate material growth. However, new vehicle sales
are expected to see moderate growth in 2018 according to WesBank’s CEO. South Africa’s
economic challenges are structural in nature, and will take an extended period of time to
correct, however the positive sentiment brought about by the recent political changes is a
good place to start and will lead to greater economic investment and improved growth
prospects for the country (RMI, 2018b).
11You can also read