Second Quarter Fiscal 2022 Ended September 30, 2021 - Azure Power
←
→
Page content transcription
If your browser does not render page correctly, please read the page content below
~7.2 GW* Pan India Portfolio
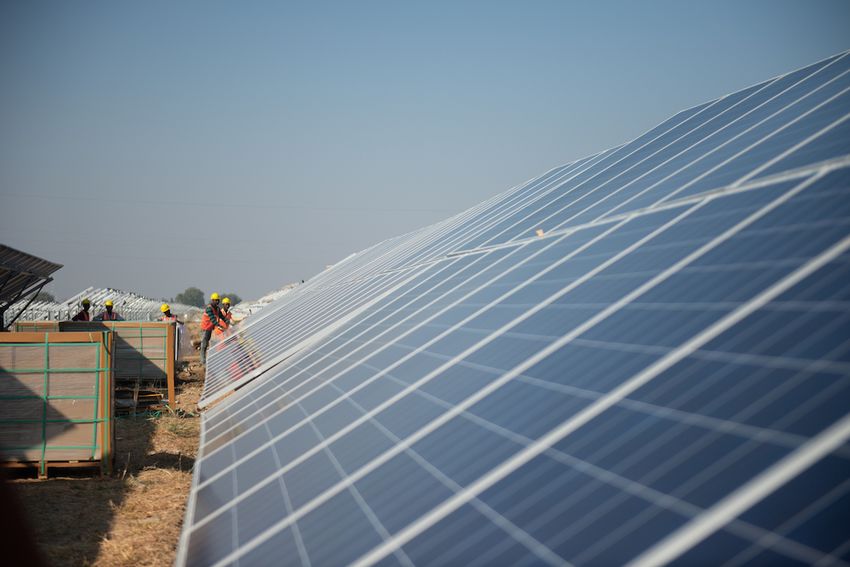
India’s First Private Grid Connected MW Solar Plant
India’s first Solar Green Bond
Second Quarter Fiscal 2022
Ended September 30, 2021
Earnings Presentation
December 13, 2021
1|Copyright © 2020 Azure Power |www.azurepower.com
*~7.2 GW include 3.7 GW for which LOA has been received but PPA is awaited
Disclaimer
Forward-Looking Statements

This information contains forward-looking statements within the meaning of Section 21E of the Securities Exchange Act of 1934 and the Private
Securities Litigation Reform Act of 1995, including statements regarding our future financial and operating guidance, operational and financial results
such as estimates of nominal contracted payments remaining and portfolio run rate, and the assumptions related to the calculation of the foregoing
metrics. The risks and uncertainties that could cause our results to differ materially from those expressed or implied by such forward-looking
statements include: the availability of additional financing on acceptable terms; changes in the commercial and retail prices of traditional utility
generated electricity; changes in tariffs at which long term PPAs are entered into; changes in policies and regulations including net metering and
interconnection limits or caps; the availability of rebates, tax credits and other incentives; the availability of solar panels and other raw materials; our
ability to attract and retain our relationships with third parties, including our solar partners; our ability to meet the covenants in debt facilities;
meteorological conditions; impact of the COVID-19 pandemic and lockdowns in India and globally; supply disruptions; power curtailments by
Indian state electricity authorities and such other risks identified in the registration statements and reports that we have filed with the U.S. Securities
and Exchange Commission, or SEC, from time to time. In the presentation, portfolio represents the aggregate megawatts capacity of renewable
power plants pursuant to PPAs, signed or allotted or where we have been cleared as one of the winning bidders or won a reverse auction but has yet
to receive a letter of allotment. There is no assurance that we will be able to sign a PPA even though we have a letter of award. All forward-looking
statements in this presentation are based on information available to us as of the date hereof, and we assume no obligation to update these forward-
looking statements.

This presentation also contains non-GAAP financial measures. We have provided a reconciliation of such non-GAAP financial measures to the most
directly comparable measures prepared in accordance with U.S. GAAP in the Appendix to this presentation.

2|Copyright © 2021 Azure Power |www.azurepower.com
Key Highlights

3|Copyright © 2021 Azure Power |www.azurepower.com
Under Committed &
Portfolio(1) Operating(2)
Construction Awarded(3)
7,225 MW 2,360 MW 595 MW 4,270 MW
Key Highlights
ESG:
Carbon Neutral - first energy company in India to achieve carbon neutrality
EV Policy – focus on Scope 1 emissions, commitment for 100% EV by 2030
Fortification against Covid – No Covid cases during the quarter, 100% staff vaccinated
Awards – Won Greentech Effective Safety Culture Award and Grow Care India OHS Award 2021
Operational (2Q’22):
Revenue at $59.1(4) Mn; 25% y-o-y. Significantly exceeding revenue guidance
EBIDTA from Operating Assets(5) at $ 51.6 Mn; 28% y-o-y
CFe from Operating Assets(5) at $ 18.9 Mn; 32% y-o-y
Business:
4GW update – 600 MW PPAs signed. Another 2,333 MW PPA assured under AP PSA.
Addressable Market - Concrete steps taken with LOAs received for 120 MW Wind and 150 MW
Hybrid projects from SECI subsequent to quarter end. Developing large wind sites.
Green Bond – Lowest coupon high yield bond from India, refinanced 1st green bond well ahead of Under Construction
maturity. Project debt refinancing being achieved at over ~200bps rate reductions with 70% of project Operating
debt now under minimum 2-3 years of fixed interest rates.
1) 2nd largest solar portfolio in India as per Mercom
2) 2,959 MW DC; including 150 MW commissioned in Rajasthan 8 project subsequent to 2Q’22 end and excluding 153 MW of Rooftop portfolio for which an agreement to sell is executed in April 2021
3) Includes 600 MW PPA signed under 4GW
4) Includes revenue from RT entities of ~ US$2.2m
5) For a reconciliation of EBITDA and CFe from Operating Assets, refer to the Appendix. Exchange rate INR 74.16 to US$1 (FED rate as of Sep 30, 2021).
4|Copyright © 2021 Azure Power |www.azurepower.com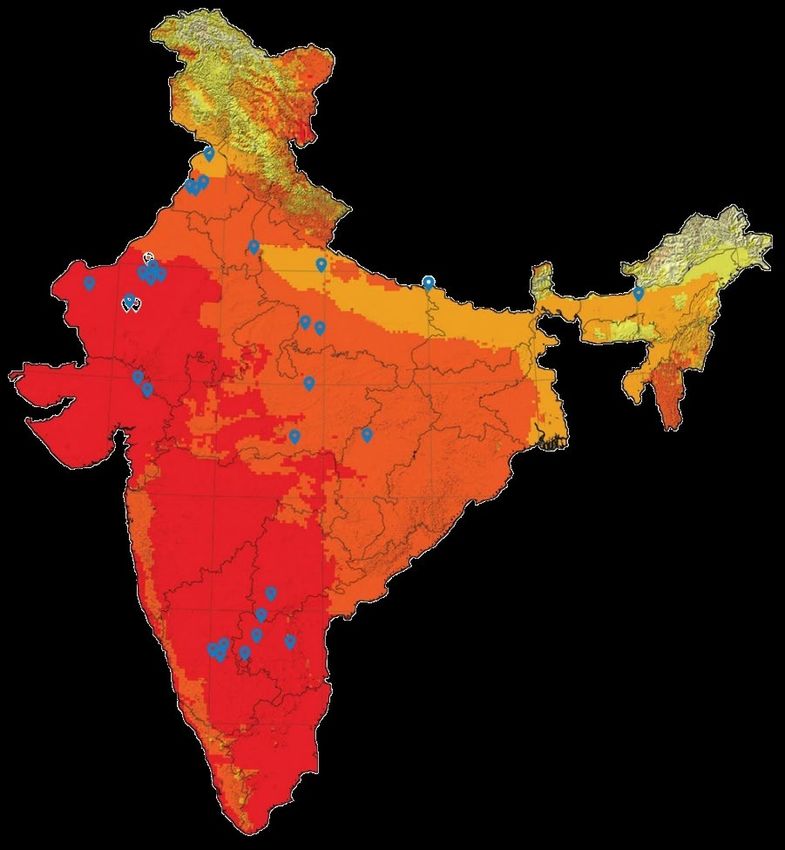
Construction Update
                                                                                                                                                                Assam
                                                                                                           Rajasthan

                                                                   Rajasthan

                              Rajasthan 6           Rajasthan 8           Rajasthan 9               Assam
                               600 MW                300 MW                300 MW                   90 MW

       Commissioning 500MW - Done 150MW - Done                                 Q4(1)
                                                                                               45MW - Done
                      100 MW – Q3 150 MW – Q3/Q4(1)                                           45MW – Q3/Q4(2)

          Financing                100%                  100%                  100%                  100%

             Land                  100%                  100%                 90%(3)                 100%

                                                                                                                                                                        Under Construction
        Transmission               100%                  100%                  100%                  ~97%
                                                                                                                                                                        Operating

Quarters refer to FY2022 | 1) Scheduled Commissioning Date (SCD) extension being applied for in line with MNRE order dated 03.11.2021 related to supply disruptions 2) Extension in SCD
applied for 3) Additional land procurement is under process basis some changes in technology being deployed
    5|Copyright © 2021 Azure Power |www.azurepower.com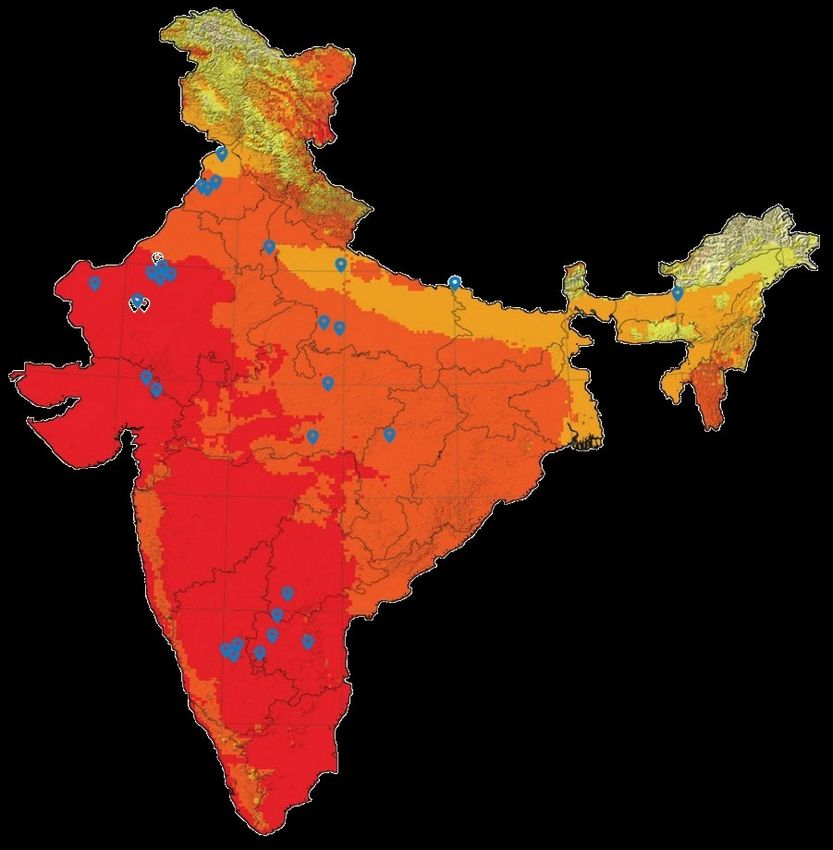
ESG Highlights
                                                                                       Q2 Highlights
                                                              Electric Vehicle (EV) Policy adopted, focus on reducing scope 1 emission. All new vehicles to be
                                                              purchased for common company use would now only be EV, commitment to shift to 100% EV by 2030.
                                                              Interest subsidy to encourage staff to purchase EV. 2 EV purchased by company and 1 EV purchased by
                                                              staff since adoption
                                               Environment    Carbon neutral status obtained by offsetting 2019-20 emissions
                                                              Avoided around 0.88 million tons of CO2 in current Quarter
                                                              Massive tree plantation at SECI 600. 30,000 indigenous tree species to be planted @ at least 5,000 trees
                                                              per quarter. Sustainability goal adopted for planting 50 tree per MW in all future project
                                                              68 additional rainwater harvesting structures constructed. Total 150+ structures till date, recharges 50%
                                                              of our total water consumption
      ESG score improved from                                 90 Stakeholder consultation undertaken across different sites
    “Medium Risk” to “Low Risk”                               No COVID cases reported in the quarter. 100% employees vaccinated, 93% received both dose rest
                                                              single dose
                                                              Skill development training targeting 650 ++ Beneficiaries from communities initiated, 16 Skill
                                                              development center opened
                                                     Social   Won Greentech Effective Safety Culture Award 2021 and Grow Care India OHS Award 2021
                                                              ISO 14001 external audit successful
                                                              "Suraksha- Defensive Driving Training" organized for 110+ participants
                                                              Zero Fatality , Zero LTI this quarter, Safety score of 100 against target of 80
     Among the highest in India

                                                              Sustainability Committee of the Board formed
                                                              All projects comply with World Bank Equator Principles. Comply with SEC, NYSE, SGX governance
                                                Governance    standards
                                                              Gender diverse Board
                                                              125 internal SHES audits reported no significant noncompliance

6|Copyright © 2021 Azure Power |www.azurepower.com
ESG Highlights

                                                     Safety Score Card Items          Weight    YTD          YTD           Q2       YTD
                                                                                               Target       Achieved                Score
                                                     Zero Fatality                       20%            0              0        0     100%
                                                     Up to 0.475 LTI per million
                                                                                         20%
                                                     manhour worked                              0.475           0.33           0     100%
                                                     1,637 RIR (Safety observation)      20%       704            875      510        100%
                                                     Close 79% NC + CAPA                 15%      60%            65% 65%              100%
                                                     302 Internal Audit                  15%       167            165      125         99%
                                                     1.12 person day of safety
                                                                                         10%
                                                     training per person                          0. 50          0. 77 0.60           100%
                                                     Q2 Safety Score                     100

7|Copyright © 2021 Azure Power |www.azurepower.com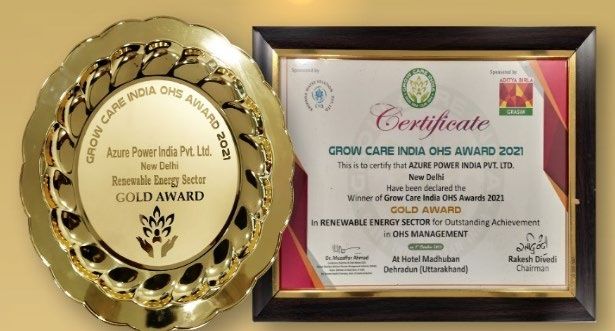
Industry and Regulatory Update

     COP26 Summit: India made 5 major announcements during COP26                  GIB matter: MNRE has filed an application with Hon’ble Supreme Court
     meet concluded recently at Glasgow. (1) India to reach its non-fossil        for modification of order dated April 19, 2021, with prayer, inter-alia, to
     energy capacity to 500 GW by 2030, (2) India to meet 50% of its energy       allow overhead lines outside priority area with bird diverters and declare
     requirements from Renewable Energy by 2030, (3) To reduce total              undergrounding of lines as “Change in Law” event. Similar applications
     projected carbon emissions by a billion ton from now to 2030, (4) To         have also been fled by Industry Associations to exclude Potential Area from
     reduce carbon intensity of its economy to less than 45% by 2030, (5) To      the ambit of the order. SC had earlier ordered to make all existing and
     achieve target of Net-Zero by 2070. These are significant announcement       upcoming transmission lines underground in Priority and Potential areas,
     from the country at the global stage and boost investor confidence for the   impacting all RE projects in the state of Rajasthan and Gujarat. Azure has
     RE sector in India given assurance of a long roadmap for renewable           no project in Priority area and has operational and under-construction
     development in the country.                                                  projects in Potential area with all transmission lines already constructed.

     Must Run for RE Projects: In a move to reassure investors and provide        Green Day Ahead Market (GDAM): In furthering the steps for opening
     flexibility to developers, Ministry of Power (MoP) recently brought out a    the market for green power, after the successful launch of Green Term-
     notification mentioning that must run power plants (wind, solar, hybrid or   Ahead Market (GTAM) in August 2020, GDAM, a marketplace for trading
     hydro) shall not be subject to curtailment on account of commercial          of renewable power on a day-ahead basis, was launched on October 25,
     considerations and allowed developers to sell unscheduled power directly     2021
     on exchanges resulting in quicker compensation route.
                                                                                  Bolstering Transmission Network – In a series of recent positive
     Timely recovery of Change in Law costs: The MoP notification also            reforms related to boosting transmission capabilities, Ministry of Power
     specified rules which provide for pre-defined formula to determine the       revised the terms of reference for the National Committee on Transmission
     onetime charges or impact on tariffs due to Change in Law and also lays      to fast track ISTS planning & approval process to facilitate RE development
     down fixed time period for approvals which will result in timely recovery    and integration in the power system. In another move, the Ministry had
     of these costs incurred by developers.                                       promulgated the Rules for General Network Access – which greatly
                                                                                  simplifies the process of getting connectivity to the ISTS network access.
     Additional Provision for Project SCD extension: MNRE has recently            The Ministry also approved 23 new ISTS projects which will support
     allowed additional window of SCD extension for projects affected by          evacuation of ~20 GW of RE projects from Rajasthan, Gujarat and MP.
     disruptions in supply of imported solar PV modules and a Committee is
     notified to look into any additional time requirement on a case to case
                                                                                                                                    …….cont’d
     basis.

  8|Copyright © 2021 Azure Power |www.azurepower.com
Industry and Regulatory Update….cont’d
                                        Final hearing in Andhra Pradesh matter: The High Court of Andhra Pradesh in
                                        its latest hearing on December 8th, 2021 has directed AP Discoms to make
                                        outstanding payments to developers at interim tariff by next hearing on Dec 29th,
                                        2021 and the main matter on tariff has been posted for final arguments on Dec 29th
                                        & 30th, 2021. This is a very positive development in the AP matter.

                                        Solar Production Linked Incentive (PLI) Scheme: The bidding under the Solar
                                        PLI scheme has received overwhelming response. There is a budget of ~USD 600
                                        Mn as incentives for setting up manufacturing capacities for a minimum of 10 GW
                                        of vertically-integrated high-efficiency solar modules under the program and would
                                        be allocated to the eligible applicants as per the bucket filling mechanism. 16 bidders
                                        with a cumulative bid capacity of close to 53 GW have qualified, with almost 19,000
                                        MW bid for all four manufacturing stages. IREDA is the implementing agency for
                                        the program. As per industry reports, India is seeing a lot of fresh capacity coming
                                        up and more being planned in solar manufacturing, beyond the PLI scheme as well.

                                        Punjab Tariff Bill: Punjab Government brought a bill, proposing to redetermine
                                        all RE PPA tariffs in the state. As per the legal advice received, the bill, if enacted as
                                        law, would not stand scrutiny in the court of law due to it being ultra vires to the
                                        Constitution of India, Electricity Act, 2003 and the Indian Contract Act, 1872.
                                        Further, there have been no coercive steps taken in this regard by the state till date.

                                        GST Increase: Ministry has ordered the increase in GST rate on solar modules and
                                        other solar devices from 5% to 12%. However, this increase in cost will be
                                        recoverable for existing projects under Change in Law.

  9|Copyright © 2021 Azure Power |www.azurepower.com
Industry Developments
       Transition from plain vanilla renewable energy tenders to dispatchable RE power

       Market based mechanisms - Introduction of Green- Term Ahead Market (G-TAM), Green- Day Ahead Market (G-DAM) and Ancillary
       market are expected to bring welcome changes in the way renewable energy power market operates in the country with more flexibility
       available to project developers for sale of power

       Storage based tenders announced in last few months
                  Energy storage will be important to facilitate integration of 500 GW of renewable energy capacity by 2030 on India’s electricity
                  networks, and there is an immediate visibility for 13 to 15 GWh of tenders coming out in next 2-3 years

       New Technologies like Green Hydrogen, Pump hydro
                National Hydrogen Energy Mission & Green Hydrogen – India launched the National Hydrogen Energy Mission in Aug 2021
                with a view to make India a Green Hydrogen hub and to make the country energy independent before 100 years of
                independence is completed by 2047.
                Green Hydrogen Purchase Obligation: India to make Green Hydrogen purchase mandatory for user industries starting with 10%
                of their requirement and increasing to 20-25%. Additionally, to promote Green Hydrogen, Government mulling to allow RPO
                compliance through purchase of Green Hydrogen
                India to further leverage Green Hydrogen for the transportation sector

       Many Large Corporates have announced Net Zero targets leading to several Request-for-Proposal for Round the Clock Industrial
       Power

                    Azure Power is strengthening required competencies towards these new energy domains

  10|Copyright © 2021 Azure Power |www.azurepower.com
Q2 - FY2022
Overview
11|Copyright © 2021 Azure Power |www.azurepower.comQ2’22 Key Performance Metrics
2,210 MW* Operating 6,955 MW* Operating, US$ 0.47m Project US$ 59.1m Q2 Revenue#(4)
31% increase(1) Contracted & Cost/MW (DC)#(3) 25% increase
Awarded(2)
• 520 MW (719 MW DC) commissioned • 2,210 MW Operating • AC cost per MW US$ 0.47m for Q2 FY21# • US$ 47.2m for Q2 FY 21#
since September 2020* • 745 MW under construction • AC cost per MW US$ 0.53m for Q2 FY 22
• 158 MW (188 MW DC) commissioned in • 4 GW LOA received, PPA awaited • DC cost per MW US$ 0.54m for Q2 FY 21
Q1 FY22*
* All MWs as on Sep 30, 2021 | % increase/reduction over figures from September 2020 (for $ numbers, the change has been computed over their INR values) | #Exchange rate INR 74.16 to US$1 (FED rate as of
September 30, 2021)
1. Operating capacity excludes 153 MW of Rooftop portfolio for which we have entered into an agreement to sell in Q1FY22. Accordingly for the prior comparable period we have excluded 144 MW from the capacity
reported (1,834 MW) as at Sep 30, 2020 | * Excludes the RT portfolio
2. Operating, Contracted and Awarded capacity excludes 153 MW of Rooftop portfolio as on Sep 30, 2021, as well as from prior comparable period. We have included the 4 GW for which we have received the LOA,
and PPA for 600 MW have been signed till date, subsequent to quarter end. The Company has also received LOA of 120 MW wind and 150 MW hybrid projects with SECI, subsequent to quarter end.
3. Cost per MW are reported Year to date (YTD).
4. Including revenue relating to Rooftop companies for Q2 FY22 US$ 2.2 million (September 30 , 2020 US$1.9 million).
12|Copyright © 2021 Azure Power |www.azurepower.comReview of Q2 FY22 Results
Reporte
Adjusted Reported Reported 2Q FY’22 After % Change
d Adjustments*
(in million) 2Q FY’21 2Q FY’22 2Q FY’22 Adjustments adjusted Q2 FY’22 vs Comments
2Q FY’21 US$
INR INR US$ US$ adjusted Q2 FY’21
INR
Primarily driven by projects commissioned since Q2 FY21
Revenue 3,504 3,504 4,386 59.1 - 59.1 25%
~US$ 5.7m and sale of carbon credits of US$ 5.5m.
Cost of operations increased primarily due to projects
Cost of Operations 309 309 355 4.8 - 4.8 15%
commissioned since Q2 FY 22.
General & Administrative Adjustments relates to reversal of SAR provision, net of
883 391 346 4.7 (0.9) 5.6 6%
Expenses legal and professional expenses of US$ 2.4 million
Non-GAAP Adjusted
2,312 2,804 3,685 49.6 (0.9) 48.7 29% A 29% YoY increase after adjustments
EBITDA*
Depreciation and
773 773 860 11.6 - 11.6 11% Primarily due to projects commissioned since Q2 FY22
Amortization
Majorly on account of borrowings related to projects
Interest Expense, net commissioned since Q2 FY’21. Adjustments relate to non-
(including other 2,017 2,017 2,417 32.6 3.1 29.5 9% recurring refinance charges of 5.5% Solar Green Bonds (US$
expenses) 1.5m) and one time charge related to refinancing of loans
(US$ 1.6m)
Gain on Foreign Adjustment relates to one time net gain on settlement of
(13) (13) (127) (1.7) (1.7) - NA
Currency Exchange, net Solar Green Bonds
Adjustment relates to impairment loss recognised on
Impairment Loss - - 14 0.2 0.2 - NA
Rooftop assets part of the disposal group
On account of movement in the carrying amount of certain
Income tax
(97) 79 821 11.1 - 11.0 NM assets and liabilities and their tax base and commissioning of
expense/(benefit)
new projects
Net loss after tax (368) (45) (300) (4.0) (0.6) (3.4) NM 2Q’FY22 adjusted net loss of US$ 3.4 million
Exchange rate INR 74.16 to US$1 (FED rate as of September 30, 2021) | *For a reconciliation of Non-GAAP measures to comparable GAAP measures, refer to the Appendix. Refer to earnings press release for further information.
Adjustments are charges or additional items that are non-recurring, recurring but expected to be materially higher or lower going forward or we expect recovery of in the future.| NM – not meaningful
13|Copyright © 2021 Azure Power |www.azurepower.comImproved Overhead and DSO
G&A Excluding Stock Compensation & Management
Transition Accounts Receivable DSO
Days
Millions 150
$24
$22
Share price decreased from 140
$20 US$ 26.92 in Q1 FY22 to
$18 US$ 22.00 in Q2 FY22, 130
$16 resulting in reversal of
$14 provision.
$12 120
$10
$8 110
DSO
$6
$4 100
$2 Average time to
$0 90 bill combined
-$2 1Q'20 2Q'20 3Q'20 4Q'20 1Q'21 2Q'21 3Q'21 4Q'21 1Q'22 2Q'22 with grace period
-$4 80
is ~75 days
-$6
-$8
70
-$10
G&A ex Stock Comp/Management Transition Stock Comp/Management Transition* 60
2Q'20 3Q'20 4Q'20 1Q'21 2Q'21 3Q'21 4Q'21 1Q'22 2Q'22
___________________________
*As of September 30, 2022, 1,875,000 SARs were outstanding of which 1,682,500 SARs cannot be exercised until 2024 on which the Company will not incur
any cash payments until that time
Exchange rate- INR 74.16 to US$1 (FED rate as of September 30, 2021 | 1) Compares 2Q’21 vs 2Q’22
14|Copyright © 2021 Azure Power |www.azurepower.comOperating Assets Review: EBITDA, CFe, & Leverage
32% growth in CFe from Operating Assets YoY(1)
EBITDA from Operating Assets CFe from Operating Assets
(in US$ Mn) (in US$ Mn)
+32% $18.9
+28% $51.6 Positive Drivers:
$14.3
$40.3 Revenues: +$11.9 million
2Q'21 EBITDA 2Q'22 EBITDA 2Q'21 CFe 2Q'22 CFe
As at March 31, 2021 As at September 30, 2021
(in INR million) (in INR million) (in US$ million)
Net Debt for Operating Assets 82,650 88,508 1,193.5
LTM EBITDA for Operating Assets 13,146 14,383 193.9
Net Debt/LTM EBITDA for Operating Assets (x) 6.3x 6.2x
___________________________
Exchange rate- INR 74.16 to US$1 (FED rate as of September 30, 2021) | For a reconciliation of EBITDA and CFe from Operating Assets, refer to the Appendix
15|Copyright © 2021 Azure Power |www.azurepower.comA Growing Balance Sheet
As at March 31,
As at September 30, 2021
2021
(in million)
(in million)
(3)
INR INR US$
Cash, Cash Equivalents and Current Investments(1) 11,107 9,513 128.3
Property, Plant & Equipment, Net 108,847 120,808 1,628.7
Net Debt(2) 86,928 104,522 1,409.4
Hedging Asset (net) 5,488 1,274 17.2
1) Does not include Current and Non-Current Restricted cash of INR 9,875 million (US$ 133.2 million) as on September 30, 2021 and of INR 5,051 million as on March 31, 2021.
2) Net debt is presented after net of hedging derivative value and cash and cash equivalents. The hedging asset (net) is directly related to hedging foreign debt from variances in foreign
exchange changes and is included in Other Assets on the Balance Sheet. The hedging asset (net) was US$ 17.2 million for quarter ended September 30, 2021 and US$ 74.0 million for
the year ended March 31, 2021 respectively.
3) Exchange rate- INR 74.16 to US$1 (FED rate as of September 30, 2021).
16|Copyright © 2021 Azure Power |www.azurepower.comQ3’22 and FY’22 Guidance
Q3’22 Guidance FY’22 Guidance - Reiterated
Q3 FY’22 Revenue: INR 2,750 – 2,955(1) MW
4,100 – 4,300 million(1) Operating by March 31, 2022
Q3 FY’22 PLF: 19.5% - INR 17,900 – 18,900 million(1)
20.5% of Revenue for FY’22
_________________________
1) Q3 FY’22 revenue guidance is US$ 55.3 - $58.0 mn and FY’22 revenue guidance is US$ 241 - $255mn at the September 30, 2021 exchange rate- INR 74.16 to US$1. Excludes our rooftop
portfolio for which we have entered into an agreement to sell in the current period.
17|Copyright © 2021 Azure Power |www.azurepower.comLong Term Outlook
MW Operational Guidance
MW
7,000 Gross Margin(2,4), Cash Flow to Equity for
6,000 Operating Assets(3,4) and Debt Forecast
5,000 CAGR 24%
US$ Millions
4,000 $350 Gross
3,000 CAGR 43% Margin:
$300 Gross $270 - $285
2,000
Margin:
1,000 Gross $208 - $228
$250
Margin:
- $205
$200
FY'22(e)
FY'23(e)
FY'24(e)
FY'25(e)
IPO(a)
FY'17(a)
FY'18(a)
FY'19(a)
FY'20(a)
FY'21(a)
FY'22(a)
Q2
$150
Capex Forecast(1) $100
US$ Millions
$600 $50
CFe: CFe:
CFe:
$87 $50 - $100
$300 $0 $44 - $69
LTM Current Operational Total Contracted Portfolio *
$0 (2,210 MWs) (2,955 MWs)
FY'21 FY'22 FY'23 FY'24 FY'25 Net Debt ~$1,200 ~$1,590
Equity Debt
Gross Margin CFe
(US$ millions) FY'22 FY'23 FY'24 FY'25
Cap Ex $400 - $500 $500 - $650 $600 - $750 $600 - $750
Exchange rate- INR 74.16 to US$1 (FED rate as of September 30, 2021). (1) The forecast for FY23 and onwards assumes capex for awarded capacity which is subject to PPA’s being signed on a timely basis with SECI and does not
factor impacts from events such as COVID/supply challenges etc (2) Revenue less cost of operations equals Gross Margin. Corporate G&A as overhead is covered during construction in cap ex. (3) CFe for Operating Assets is
profit before tax (the most comparable GAAP metric), adjusted for net cash provided for used/in operating activities, other than changes in operating assets and liabilities, income and deferred taxes and amortization of hedging
costs; less: cash paid for income taxes, debt amortization and maintenance capital expenditure. Our LTM CFe has no debt amortization for entities under 2024 Green Bonds and going forward as we may look to further refinance
these assets, there may be change in the debt amortizations. 4) Outlook range is generation from P90 to P50 and normalized debt amortization ranging from 20 to 25 years. LTM actual debt amortization was $8.2 million due to the
majority of debt in non amortizing Green Bonds. * do not include 600 MW for which PPA has been signed subsequent to 2Q’22 quarter end.
18|Copyright © 2021 Azure Power |www.azurepower.comAppendix 19|Copyright © 2021 Azure Power |www.azurepower.com
Historical Plant Load Factor (PLF); Annual, Quarterly

 25.0%

 24.0%
                              23.7%                                                                        23.4%
 23.0%
            22.7%                                                                                          22.3%
 22.0%              21.5%
                                                                                                                     Annual PLF
 21.0%                                                                                                             FY’21    20.9%
                                                      20.2%                 19.5% – 20.5% PLF                      FY'20    19.5%
 20.0%                                                                       3Q FY’22 forecast                     FY'19    18.6%
                                                                                                                   FY'18    18.2%
 19.0%
                                                                                      17.7%
                                                                                              19.3%
 18.0%
                                                                18.8%
 17.0%
                                           16.8%
 16.0%

 15.0%
                        1Q                            2Q                                 3Q           4Q

                                                           FY'20a       FY'21       FY'22

20|Copyright © 2021 Azure Power |www.azurepower.com
Historical Plant Load Factor (PLF); Green Bonds Performance
Azure Power Energy Limited (RG1)* Azure Power Solar Energy Private Limited (RG2)
22.0% 29.0%
26.4% Q1 F22
21.0% 27.4%
21.0% 27.0%
20.6% 26.3%
20.2% Q1 F22
25.5%
20.0% 20.1% 20.0% 25.0%
23.0% 21.0% Q2 F22
19.0% 22.7%
21.0% 22.4%
18.0% 21.0%
17.3% 17.2%
20.1%
17.4%* Q2 F22
17.0% 19.0%
17.0%
16.0% 17.0%
15.9%
16.6%
15.0% 15.0%
Q1 Q2 Q3 Q4 Q1 Q2 Q3 Q4
RG1 - FY'20 RG1 - FY'21 RG1 - FY'22 RG2 -FY'20 RG2 -FY'21 RG2 -FY'22
*Due to Refinancing in Aug 2021, total capacity of RG1 now stands at 611 MW
21|Copyright © 2021 Azure Power |www.azurepower.comDSO by Counterparty
Amounts in US$ million
On time/
Past due
Net Within Past due up DSO
Customer Name Capacity (MW) more than 365
Receivables grace to one year days (2)
days
period(1)
SECI , NTPC, NVVN 1,189 14.5 14.2 0.3 - 52
Andhra Pradesh(3) 50 13.7 1.1 6.1 6.5 733
Karnataka(4) 250 25.6 4.9 13.5 7.2 299
Chhattisgarh 30 0.8 0.8 - - 80
Other States 691 12.3 11.3 1.0 - 66
2,210 66.9 32.3 20.9 13.7 116
(1) Includes revenue generated but yet to be billed of US$16.4 million
(2) DSO is computed on an INR value
(3) The High Court of Andhra Pradesh in its hearing on December 8th, 2021 has directed AP Discoms to make outstanding payments to developers at interim tariff by next hearing on Dec
29th, 2021 and the main matter on tariff has been posted for final arguments on Dec 29th & 30th, 2021.
(4) We have received favorable order from APTEL in GESCOM (40 MW) and CESCOM (50MW) matters. GESCOM has appealed in Hon’ble Supreme Court (however the matter has not
yet been listed for hearing) and we have filed execution petition in the CESCOM matter with APTEL for compliance with the order.
______________________
Exchange rate- INR 74.16 to US$1 (FED rate as of September 30, 2021). Figures may not add up due to rounding.
22|Copyright © 2021 Azure Power |www.azurepower.comUse of Non-GAAP Financial Measures: EBITDA
Adjusted EBITDA is a non-GAAP financial measure. We present Adjusted EBITDA as a supplemental measure of its performance. This
measurement is not recognized in accordance with USGAAP GAAP and should not be viewed as an alternative to USGAAP GAAP measures of
performance. The presentation of Adjusted EBITDA should not be construed as an inference that the Company’s future results will be unaffected by
unusual or non-recurring items.
We define Adjusted EBITDA as net loss (income) plus (a) income tax expense, (b) interest expense, net, (c) depreciation and amortization, (d) loss
(income) on foreign currency exchange, (e) Other expenses/ (income) and (f) Impairment loss. We believe Adjusted EBITDA is useful to investors
in evaluating our operating performance because:
• Securities analysts and other interested parties use such calculations as a measure of financial performance and debt service capabilities; and
• it is used by our management for internal reporting and planning purposes, including aspects of its consolidated operating budget and capital
expenditures.
Adjusted EBITDA has limitations as an analytical tool, and you should not consider it in isolation or as a substitute for analysis of the Company’s
results as reported under USGAAP GAAP. Some of these limitations include:
• it does not reflect its cash expenditures or future requirements for capital expenditures or contractual commitments or foreign exchange gain/loss;
• it does not reflect changes in, or cash requirements for, working capital;
• it does not reflect significant interest expense or the cash requirements necessary to service interest or principal payments on its outstanding debt;
• it does not reflect payments made or future requirements for income taxes; and
• although depreciation and amortization are non-cash charges, the assets being depreciated and amortized will often have to be replaced or paid in
the future and Adjusted EBITDA does not reflect cash requirements for such replacements or payments.
Investors are encouraged to evaluate each adjustment and the reasons we consider it appropriate for supplemental analysis. For more information,
please see the table captioned “Reconciliations of Non-GAAP Measures to Comparable GAAP Measures” in this presentation.
23|Copyright © 2021 Azure Power |www.azurepower.comReconciliation of Non-GAAP Measures to Comparable GAAP measures
Quarter Ended September 30, Six Month Ended September 30,
(in million) (in million)
2020 2021 2021 2020 2021 2021
INR INR US$ INR INR US$
Net (Loss)/ Profit (368) (300) (4.0) (322) 397 5.6
Income tax (income)/ expense (97) 821 11.1 220 677 9.1
Interest expense, net 2,023 2,417 32.6 4,186 4,666 62.8
Other (income)/ expense (6) - - - 2 0.0
Depreciation and amortization 773 860 11.6 1,528 1,679 22.6
Impairment loss - 14 0.2 - 40 0.5
(Gain)/ Loss on foreign currency
(13) (127) (1.7) 4 (108) (1.4)
exchange
Adjusted EBITDA 2,312 3,685 49.6 5,616 7,353 99.0
__________________________
Exchange rate- INR 74.16 to US$1 (FED rate as of September 30, 2021).
24|Copyright © 2021 Azure Power |www.azurepower.comUse of Non-GAAP Financial Measures: Cash Flow to Equity (CFe) Cash Flow to Equity is a Non-GAAP financial measure. We present CFe as a supplemental measure of our performance. This measurement is not recognized in accordance with U.S. GAAP and should not be viewed as an alternative to U.S. GAAP measures of performance. The presentation of CFe should not be construed as an inference that our future results will be unaffected by unusual or non-recurring items. We believe GAAP metrics such as net income (loss) and cash from operating activities do not provide with the same level of visibility into the performance and prospects of our operating business as a result of the long term capital-intensive nature of our businesses, non-cash depreciation and amortization, cash used for debt servicing as well as investments and costs related to the growth of our business. Our business owns high-value, long-lived assets capable of generating substantial Cash Flow to Equity over time. We define CFe as profit before tax (the most comparable GAAP metric), adjusted for net cash provided for used/in operating activities, other than changes in operating assets and liabilities, income and deferred taxes and amortization of hedging costs; less: cash paid for income taxes, debt amortization and maintenance capital expenditure. We believe that changes in operating assets and liabilities is cyclical for cash flow generation of our assets, due to our high growth environment. Furthermore, to reflect the actual cash outflows for income tax, we deduct income and deferred taxes computed under US GAAP and presented in our consolidated financial statements and instead include the actual cash tax outflow during the period, are considered as part of interest expense. We believe that external consumers of our financial statements, including investors and research analysts, use Cash Flow to Equity both to assess Azure Power’s performance and as an indicator of its success in generating an attractive risk-adjusted total return, assess the value of the business and the platform. In addition, we use CFe internally to forecast long term financing needs and to determine equity returns on our projects. We have disclosed CFe for our operational assets on a consolidated basis, which is not the Cash from Operations of the Company on a consolidated basis. We believe CFe supplements GAAP results to provide a more complete understanding of the financial and operating performance of our businesses than would not otherwise be achieved using GAAP results alone. Cash Flow to Equity should be used as a supplemental measure and not in lieu of our financial results reported under GAAP. We have also bifurcated the CFe into Operational Assets and Others, as defined below, so that users of this financial statement are able to understand the Cash generation from our operational assets. We define our Operational Assets, as the Projects which had commenced operations on or before the year ended June 30, 2020, the operational assets represent the MW operating as of that date. We define Others as the project SPV’s which are under construction, or under development - as provided on page 55 of Form 20F, Corporate which includes our three Mauritius entities, the other than projects covered under operational assets, as well as, a company incorporated in USA and other remaining entities under the group. 25|Copyright © 2021 Azure Power |www.azurepower.com
Cash Flow to Equity (CFe)
                                                                                       For the quarter ended                                         For the quarter ended
 (US $ million)
                                                                                        September 30, 2020                                            September 30, 2021
                                                                                    Operating              Others                 Total           Operating       Others     Total
Sale of power                                                                          47.2                    -                 47.2               59.1              -       59.1
Cost of operations                                                                      4.2                    -                  4.2                4.8              -        4.8
General and administrative                                                              2.7                   9.2                11.9                2.7             2.0       4.7
Adjusted EBITDA                                                                        40.3                  (9.2)                31.1              51.6            (2.0)     49.6
Impairment loss                                                                          -                     -                   -                 0.2              -        0.2
Depreciation and amortization                                                          10.3                   0.1                10.4               11.5             0.1      11.6
Operating income/ (loss)                                                               30.0                  (9.3)               20.7               39.9            (2.1)     37.9
Interest expense, net                                                                  24.5                   2.8                27.3               24.7             7.9      32.6
Other expense/ Income                                                                    -                   (0.1)               (0.1)                -               -         -
Loss/(gain) on foreign currency exchange, net                                          (0.2)                   -                 (0.2)              (1.7)             -       (1.7)
Profit/(loss) before Income Tax                                                         5.7                 (12.0)               (6.3)              16.9           (10.0)      7.0
Add: Depreciation and amortization                                                     10.3                   0.1                10.4               11.5             0.1      11.6
Add: Impairment loss                                                                     -                     -                   -                 0.2              -        0.2
Add: Foreign exchange gain, net                                                        (0.2)                   -                 (0.2)              (1.7)             -       (1.7)
Add: Ancillary cost of borrowing                                                        1.3                  (0.4)                0.9                3.4             1.1       4.5
Add: Other items from the Statement of Cash Flows(1)                                    1.3                   7.1                 8.4                1.4            (3.5)     (2.1)
Less: Cash paid for income taxes                                                       (1.8)                 (0.7)               (2.5)              (0.5)           (1.9)     (2.4)
Less: Debt Amortization(2)                                                             (2.3)                   -                 (2.3)             (12.3)             -      (12.3)
Less: Maintenance Capital expenditure(3)                                                 -                     -                   -                  -               -         -
Cfe                                                                                    14.3                  (5.9)               8.4(4)             18.9           (14.2)    4.8(4)
     __________________________
     All amounts for the quarter 2021 and 2020 have been translated at an exchange rate- INR 74.16 to US$1 (FED rate as of September 30, 2021).
   26|Copyright © 2021 Azure Power |www.azurepower.com
Cash Flow to Equity (CFe) – Contd.
(1) Items from the Statement of Cash Flows. Other items include: loss on disposal of property plant and equipment of Nil and US$ 0.1 million, share based compensation of US$ 7.1
million and US$ (3.2) million, non-cash rent expense of US$ 0.5 million and US$ 0.8 million, allowance for doubtful debts of US$ 0.3 million and US$ 0.3 million, loan repayment
charges of Nil, employee benefits of US$ 0.4 million and US$ (0.3) million and ARO accretion of US$ 0.1 million and US$ 0.2 million for the quarter ended September 30, 2020
and September 30, 2021 respectively.
(2) Repayments of term and other loans during the quarter ended September 30, 2021, was US$ 44.0 million (refer to the Statement of Cash Flows) which includes US$ 32.7 million
related to refinancing of loans, extinguishment, repayment of debt and payments for hedge and have been excluded to determine debt amortization of US$ 12.3 million.
Repayments of term and other loans during the quarter ended September 30, 2020, was US$ 1.7 million (refer to the Statement of Cash Flows) which includes US$ 0.6 million
related to refinancing of loans, extinguishment, repayment of debt and payments for hedge and has been excluded to determine debt amortization of US$ 2.3 million.
(3) Classification of Maintenance Capital Expenditures and Growth Capital Expenditures All our capital expenditures are considered Growth Capital Expenditures. In broad terms, we
expense all expenditures in the current period that would primarily maintain our businesses at current levels of operations, capability, profitability or cash flow in operations and
maintenance and therefore there are no Maintenance Capital Expenditures. Growth capital expenditures primarily provide new or enhanced levels of operations, capability,
profitability or cash flows.
(4) Reconciliation of total Cfe to cash from operations:
For the quarter ended For the quarter ended
(US$ million) September 30, 2020 September 30, 2021
Cfe 8.4 4.8
Items included in GAAP Cash Flow from Operating Activities but not considered in Cfe
Change in Current assets and liabilities as per statement of cash flow 18.5 (4.7)
Current income taxes 3.1 (5.9)
Prepaid lease payments (1.1) (0.3)
Amortization of hedging costs 6.5 4.0
Items included in Cfe but not considered in GAAP Cash Flow from Operating Activities
Debt amortization as per Cfe 2.3 12.3
Cash taxes paid as per Cfe 2.5 2.4
Cash from Operating Activities 40.2 12.4
__________________________
All amounts for the years 2021 and 2020 have been translated at exchange rate- INR 74.16 to US$1 (FED rate as of September 30, 2021).
27|Copyright © 2021 Azure Power |www.azurepower.comCash Flow to Equity (CFe)
For six months ended For six months ended
(US $ million)
September 30, 2020 September 30, 2021
Operating Others Total Operating Others Total
Sale of power 100.4 - 100.4 119.0 - 119.0
Cost of operations 7.7 - 7.7 9.4 - 9.4
General and administrative 4.4 12.5 16.9 4.6 5.8 10.4
Adjusted EBITDA 88.3 (12.5) 75.8 105.0 (5.8) 99.2
Impairment loss - - - 0.5 - 0.5
Depreciation and amortization 20.3 0.3 20.6 22.5 0.1 22.6
Operating income/ (loss) 68.0 (12.8) 55.2 82.0 (5.9) 76.1
Interest expense, net 51.2 5.2 56.4 51.5 11.3 62.8
Other expense/ Income - - - - - -
Loss/(gain) on foreign currency exchange, net 0.1 - 0.1 (1.5) 0.1 (1.4)
Profit/(loss) before Income Tax 16.7 (18.0) (1.3) 32.0 (17.3) 14.7
Add: Depreciation and amortization 20.3 0.3 20.6 22.5 0.1 22.6
Add: Impairment loss - - - 0.5 - 0.5
Add: Foreign exchange gain, net 0.1 - 0.1 (1.5) - (1.5)
Add: Ancillary cost of borrowing 2.2 0.3 2.5 4.3 1.5 5.8
Add: Other items from the Statement of Cash Flows(1) 4.7 8.1 12.8 1.7 (2.0) (0.3)
Less: Cash paid for income taxes (2.5) (1.2) (3.7) (0.9) (4.1) (5.0)
Less: Debt Amortization(2) (4.9) - (4.9) (14.7) - (14.7)
Less: Maintenance Capital expenditure(3) - - - - - -
Cfe 36.6 (10.5) 26.1(4) 43.9 (21.8) 22.1(4)
__________________________
All amounts for the quarter 2021 and 2020 have been translated at an exchange rate- INR 74.16 to US$1 (FED rate as of September 30, 2021).
28|Copyright © 2021 Azure Power |www.azurepower.comCash Flow to Equity (CFe) – Contd.
(1) Items from the Statement of Cash Flows. Other items include: loss on disposal of property plant and equipment of US$ 0.1 million and US$ 0.1 million, share based compensation of
US$ 8.1 million and US$ (1.6) million, non-cash rent expense of US$ 0.4 million and US$ 0.7 million, allowance for doubtful debts of US$ 0.5 million and US$ 0.3 million, loan repayment
charges of US$ 3.2 million and Nil, employee benefits of US$ 0.4 million and US$ (0.2) million and ARO accretion of US$ 0.3 million and US$ 0.4 million for the quarter ended
September 30, 2020 and September 30, 2021 respectively.
(2) Repayments of term and other loans during the quarter ended September 30, 2021, was US$ 65.4 million (refer to the Statement of Cash Flows) which includes US$ 50.7 million related to
refinancing of loans, extinguishment, repayment of debt and payments for hedge and have been excluded to determine debt amortization of US$ 14.7 million. Repayments of term and
other loans during the quarter ended September 30, 2020, was US$ 76.9 million (refer to the Statement of Cash Flows) which includes US$ 72.0 million related to refinancing of loans,
extinguishment, repayment of debt and payments for hedge and has been excluded to determine debt amortization of US$ 4.9 million. Further, the amount for six months does not
includes repayment of Borrowings amounting to US$ 4.0 million relating to Capital expenditure relating to re-powering of certain existing projects. The Repayment term of these loan was
3 years.
(3) Classification of Maintenance Capital Expenditures and Growth Capital Expenditures All our capital expenditures are considered Growth Capital Expenditures. In broad terms, we
expense all expenditures in the current period that would primarily maintain our businesses at current levels of operations, capability, profitability or cash flow in operations and
maintenance and therefore there are no Maintenance Capital Expenditures. Growth capital expenditures primarily provide new or enhanced levels of operations, capability, profitability or
cash flows.
(4) Reconciliation of total Cfe to cash from operations:
For six months ended For six months ended
(US$ million) September 30, 2020 September 30, 2021
Cfe 26.1 22.1
Items included in GAAP Cash Flow from Operating Activities but not considered in Cfe
Change in Current assets and liabilities as per statement of cash flow (11.7) (20.1)
Current income taxes (1.6) (6.8)
Prepaid lease payments (1.7) (0.3)
Amortization of hedging costs 13.1 10.4
Items included in Cfe but not considered in GAAP Cash Flow from Operating Activities
Debt amortization as per Cfe 4.9 14.7
Cash taxes paid as per Cfe 3.7 5.0
Cash from Operating Activities 32.8 25.1
__________________________
All amounts for the years 2021 and 2020 have been translated at exchange rate- INR 74.16 to US$1 (FED rate as of September 30, 2021).
29|Copyright © 2021 Azure Power |www.azurepower.comProjects Commissioned - Utility
As on September 30, 2021
Commercial Duration
PPA Capacity DC Capacity Tariff
Project Names Operation Off taker of PPA in
(MW) (MW) (INR/kWh)
Date(1) Years
Operational – Utility
Punjab 1 (3) Q4 2009 2 2 17.91 NTPC Vidyut Vyapar Nigam Limited 25
Punjab 2.1 (3) Q3 2014 15 15 7.67 Punjab State Power Corporation Limited 25
Punjab 2.2 (3) Q4 2014 15 15 7.97 Punjab State Power Corporation Limited 25
Punjab 2.3 (3) Q4 2014 4 4 8.28 Punjab State Power Corporation Limited 25
Karnataka 1 (3) Q1 2015 10 10 7.47 Bangalore Electricity Supply Company Limited 25
Uttar Pradesh 1 (3) Q1 2015 10 12 8.99 Uttar Pradesh Power Corporation Limited 12
Gujarat 1.1 (3) Q2 2011 5 5 15.00(4) Gujarat Urja Vikas Nigam Limited 25
Gujarat 1.2 (3) Q4 2011 5 5 15.00(4) Gujarat Urja Vikas Nigam Limited 25
Rajasthan 1 Q4 2011 5 5 11.94 NTPC Vidyut Vyapar Nigam Limited 25
Rajasthan 2.1 Q1 2013 20 23 8.21 NTPC Vidyut Vyapar Nigam Limited 25
Rajasthan 2.2 Q1 2013 15 18 8.21 NTPC Vidyut Vyapar Nigam Limited 25
Rajasthan 3.1 (3) Q2 2015 20 22 5.45(2) Solar Energy Corporation of India 25
Rajasthan 3.2 (3) Q2 2015 40 43 5.45(2) Solar Energy Corporation of India 25
Rajasthan 3.3 (3) Q2 2015 40 41 5.45(2) Solar Energy Corporation of India 25
Chhattisgarh 1.1 Q2 2015 10 10 6.44 Chhattisgarh State Power Distribution Company Ltd 25
Chhattisgarh 1.2 Q2 2015 10 10 6.45 Chhattisgarh State Power Distribution Company Ltd 25
Chhattisgarh 1.3 Q3 2015 10 10 6.46 Chhattisgarh State Power Distribution Company Ltd 25
Rajasthan 4 (3) Q4 2015 5 6 5.45(2) Solar Energy Corporation of India 25
Delhi 1.1 Q4 2015 2 2 5.43(2) Solar Energy Corporation of India 25
Karnataka 2 Q1 2016 10 12 6.66 Bangalore Electricity Supply Company Limited 25
Andhra Pradesh 1 (3) Q1 2016 50 54 6.63(4) Southern Power Distribution Com of AP Ltd 25
Punjab 3.1(3) Q1 2016 24 25 7.19 Punjab State Power Corporation Limited 25
Punjab 3.2(3) Q1 2016 4 4 7.33 Punjab State Power Corporation Limited 25
(1) Refers to the applicable quarter of the calendar year. There can be no assurance that our projects under construction and our awarded /contracted projects will be completed on time or at all., (2) Projects are supported by
viability gap funding in addition to the tariff, (3) Projects under Restricted Group, (4) Current tariff, subject to escalation/change, as per PPA
30|Copyright © 2021 Azure Power |www.azurepower.comProjects Commissioned– Utility and C&I
Commercial PPA Duration
DC Capacity Tariff
Project Names Operation Capacity Off taker of PPA in
(MW) (INR/kWh)
Date(1) (MW) Years
Operational – Utility
Bihar 1 (3) Q3 2016 10 11 8.39 North & South Bihar Power Distribution Company Ltd 25
Punjab 4.1(3) Q4 2016 50 52 5.62 Punjab State Power Corporation Limited 25
Punjab 4.2(3) Q4 2016 50 52 5.63 Punjab State Power Corporation Limited 25
Punjab 4.3(3) Q4 2016 50 52 5.64 Punjab State Power Corporation Limited 25
Karnataka 3.1 (3) Q1 2017 50 54 6.51 Chamundeshwari Electricity Supply Company 25
Karnataka 3.2(3) Q1 2017 40 42 6.51 Hubli Electricity Supply Company Limited 25
Karnataka 3.3(3) Q1 2017 40 42 6.51 Gulbarga Electricity Supply Company Limited 25
Maharashtra 1.1(3) Q1 2017 2 2 5.50(2) Ordnance Factory, Bhandara 25
Maharashtra 1.2(3) Q1 2017 5 6 5.31 Ordnance Factory, Ambajhari 25
Andhra Pradesh 2 Q2 2017 100 130 5.12 NTPC Limited 25
Uttar Pradesh 2 Q2 - Q3 2017 50 59 4.78 NTPC Limited 25
Telangana 1(3) Q1 2018 100 128 4.67 NTPC Limited 25
Uttar Pradesh 3(3) Q2 2018 40 51 4.43(2) Solar Energy Corporation of India 25
Andhra Pradesh 3(3) Q2 2018 50 59 4.43(2) Solar Energy Corporation of India 25
Gujarat 2(3) Q4 2018 260 363 2.67 Gujarat Urja Vikas Nigam Limited 25
Karnataka 4.1(3) Q1 2019 50 75 2.93 Bangalore Electricity Supply Company 25
Karnataka 4.2(3) Q1 2019 50 75 2.93 Hubli Electricity Supply Company Limited 25
Rajasthan 5 Q2-Q3 2019 200 262 2.48 Solar Energy Corporation of India 25
Maharashtra 3(3) Q3 2019 130 195 2.72 Maharashtra State Electricity Distribution Company Limited 25
Assam 1 Q3 2020-Q2 2021 45 57 3.34 Assam Power Distribution Company 25
Rajasthan 6 Q4 2020-Q2 2021 500 680 2.53 Solar Energy Corporation of India 25
Q1 2018 – Q4
Others(4) 7 10 3.36(5)
2019
Total Operational Capacity – Utility 2,210 2,810
1) Refers to the applicable quarter of the calendar year in which commercial operations commenced or are scheduled to commence based on AC capacity. There can be no assurance that our projects under construction and our Contracted
projects will be completed on time or at all (2) Projects are supported by viability gap funding, in addition to the tariff, 3) Projects under Restricted Group,
4) Others include projects with Hindustan Aeronautics Limited (HAL), Decathlon and other offtakers, 5) Levelized tariff; includes capital incentive.
31|Copyright © 2021 Azure Power |www.azurepower.comProjects Under Construction
As on September 30, 2021
Expected Commercial PPA Capacity Tariff Duration of PPA in
Project Names Off taker
Operation Date (1) (MW) (INR/kWh) Years
Under Construction
Assam 1# Q1 2022 45 3.34 Assam Power Distribution Company 25
Rajasthan 6# Q4 2021 100 2.53 Solar Energy Corporation of India 25
Rajasthan 8# Q4 2021 300 2.58 Solar Energy Corporation of India 25
Rajasthan 9# Q1 2022 300 2.54 Solar Energy Corporation of India 25
Total Under Construction- Utility 745
Total Operating and Under
2,955
Construction Portfolio
Awarded
2 GW Project 1 2,000 (2) Solar Energy Corporation of India 25
2 GW Project 2 2,000 (2) Solar Energy Corporation of India 25
Total Awarded Capacity- Utility 4,000
Total Portfolio 6,955
(1) Refers to the applicable quarter of the calendar year. There can be no assurance that our projects under construction and our awareded projects will be completed on time or at all.
(2) Company has been awarded LOA for 4GW solar projects under SECI manufacturing linked tender and has not signed a PPA.
# Due to the COVID-19 pandemic, there is uncertainty around the timing of construction of projects and this is our best estimate of completion.
32|Copyright © 2021 Azure Power |www.azurepower.comDebt Overview
As of September 30, 2021
Maturity Profile (1,2,3)
$500 $441.3
$411.6
$384.5
$400
US$ Millions
$300
$200 $148.2
$97.2
$100 $64.5
$0
FY'22 FY'23 FY'24 FY'25 FY'26 - 29 FY'30 & Beyond
Debt Split by Currency LT vs ST Debt Split
INR Debt Foreign Debt Short Term Debt Long Term Debt
Consolidated Debt (2, 3, 4) $ 1, 547.3
438.5 ,
28% $386.3 , Average Interest Rate* 8.8%
25%
1,108.8 , Balance average debt
72% $1,161.0 5.1 years
, 75% maturity for LT debt
1) This represents the last repayment period. These loans are repayable on a quarterly or semi-annual basis. For repayment by period of the above-mentioned loans, refer to contractual obligation and
commercial commitments. 2) Exchange rate- INR 74.16 to US$1 (New York buying rate of September 30, 2021). 3) The Company carries the hedging asset of US$ 7.6 million as of September 30, 2021
against foreign currency loans/borrowings to be settled over loan tenure. 4) Project level debt of INR 1,960 million (US$ 26.4 million) pertaining to rooftop entities under sale have been classified under
Liabilities directly associated with assets classified as held for sale and not considered under consolidated debt.
* Average interest rate excludes one-time expense incurred including in relation to refinance of 1st Solar Green Bonds
33|Copyright © 2021 Azure Power |www.azurepower.comProject Debt Schedule
As of September 30, 2021
Outstanding Principal Amount (In millions) Type of Interest Currency Maturity Date(1) Commissioned/
Name of Project
INR US$ (2) Under construction
Rajasthan 6 16,486 222.3 Floating INR/US$ 2021-2040 Partly commissioned
Andhra Pradesh 1 2,508 33.8 Fixed INR 2022 Commissioned
Bihar 1 439 5.9 Fixed INR 2022 Commissioned
Gujarat 1 928 12.5 Fixed INR 2022 Commissioned
Karnataka 1 748 10.1 Fixed INR 2022 Commissioned
Karnataka 3.1 2,180 29.4 Fixed INR 2022 Commissioned
Karnataka 3.2 1,774 23.9 Fixed INR 2022 Commissioned
Karnataka 3.3 2,810 37.9 Fixed INR 2022 Commissioned
Punjab 1 324 4.4 Fixed INR 2022 Commissioned
Punjab 2 1,939 26.1 Fixed INR 2022 Commissioned
Punjab 4 5,540 74.7 Fixed INR 2022 Commissioned
Rajasthan 3.1 1,187 16.0 Fixed INR 2022 Commissioned
Rajasthan 3.2 1,350 18.2 Fixed INR 2022 Commissioned
Rajasthan 3.3 2,325 31.4 Fixed INR 2022 Commissioned
Rajasthan 4 236 3.2 Fixed INR 2022 Commissioned
Telangana 1 5,030 67.8 Fixed INR 2022 Commissioned
Uttar Pradesh 1 353 4.8 Fixed INR 2022 Commissioned
Gujarat 2 9,188 123.9 Fixed INR 2024 Commissioned
Maharashtra 3 5,238 70.6 Fixed INR 2024 Commissioned
Karnataka 4 3,934 53.0 Fixed INR 2024 Commissioned
Maharashtra 1.1 & 1.2 325 4.4 Fixed INR 2024 Commissioned
Uttar Pradesh 3 1,778 24.0 Fixed INR 2024 Commissioned
Andhra Pradesh 3 2,179 29.4 Fixed INR 2024 Commissioned
1) This represents the last repayment period. These loans are repayable on a quarterly or semi-annual basis. For repayment by period of the above-mentioned loans, refer to contractual obligation and
commercial commitments. 2) Exchange rate- INR 74.16 to US$1 (New York buying rate of September 30, 2021).
34|Copyright © 2021 Azure Power |www.azurepower.comProject Debt Schedule
As of September 30, 2021
Outstanding Principal Amount (In millions) Type of Interest Currency Maturity Date(1) Commissioned/
Name of Project
Under construction
INR US$ (5)
Punjab 3.1 and 3.2 1,219 16.4 Fixed INR 2024 Commissioned
Rajasthan 8 4,931 66.5 Floating US$ 2026 Under construction
Rajasthan 1 425 5.7 Fixed INR 2031 Commissioned
Rajasthan 2 2,505 33.8 Fixed INR 2033 Commissioned
Karnataka 2 382 5.2 Floating INR 2034 Commissioned
Chhattisgarh 1.1,1.2 & 1.3 1,321 17.8 Floating INR 2036 Commissioned
Andhra Pradesh 2 5,017 67.7 Floating INR 2036 Commissioned
Uttar Pradesh 2 2,070 27.9 Floating INR 2037 Commissioned
Rajasthan 5 5,618 75.8 Mixed INR 2038 Commissioned
Assam 1 1,999 27.0 Floating INR 2039 Partly commissioned
Rooftop Projects (4), (5) 3,004 40.5 Mixed INR/US$ 2022-32 Multiple projects
97,290 (2)(3) 1,312.0
Total
1) This represents the last repayment period. These loans are repayable on a quarterly or semi-annual basis. For repayment by period of the above-mentioned loans, refer to contractual obligation and
commercial commitments. 2) This amount is presented in the financials as net of ancillary cost of borrowing of INR 1,377 million (US$ 18.6 million). 3) Non-project level debt of INR 18,466 million (US$
249.0 million) is excluded from the above table. Further foreign exchange fluctuation of INR 2,893 million (US$ 39.0 million) is in respect of project debt against which the company has taken hedge. 4)
Project level debt of INR 1,960 million (US$ 26.4 million) pertaining to rooftop entities under sale have been classified under Liabilities directly associated with assets classified as held for sale. 5) Rooftop
Projects includes, Delhi Rooftop 4, Gujrat rooftop, Punjab Rooftop 2, Railway 1, DJB, DMRC and SECI. 6) Exchange rate- INR 74.16 to US$1 (New York buying rate of September 30, 2021).
35|Copyright © 2021 Azure Power |www.azurepower.comGlossary of Select Terms
Accelerated Depreciation – Accelerated depreciation can be elected at the project level, such that projects that reach COD in the first half of the fiscal year can expense 100% of
eligible project costs in year 1, and otherwise can expense 50% of project costs in year 1 and the remainder thereafter. After March 31, 2017, projects that reach COD in the first half
of the fiscal year will be eligible to expense 60% of project costs in fiscal year 1
Balance of System (BOS) – The non-module costs of a solar system
Basic Custom Duty (BCD) - a proposed tax on imported modules from most countries outside India. The final tax rate and periods have yet to be established.
Awarded Projects – Solar power plants that pursuant to customer won in an auction but for which a contract has not ben entered
Contracted Projects – Solar power plants that have signed PPAs, or are under-construction but not commissioned.
Cash Flow to Equity (CFe) – profit before tax (the most comparable GAAP metric), adjusted for net cash provided for used/in operating activities, other than changes in operating
assets and liabilities, income and deferred taxes and amortization of hedging costs; less: cash paid for income taxes, debt amortization and maintenance capital expenditure. LTM are
actuals and projections assume normalized debt amortization over 20 years.
Outstanding amount∗Period
Day Sales Outstanding (DSO)- Days Sales Outstanding (DSO) = DSO represents the average no of days taken to recognize the revenue against sale of
Total Sales for the period
power
Gross Margin - Revenue less cost of operations
Ministry of New and Renewable Energy (MNRE) – A Government of India ministry whose broad aim is to develop and deploy new and renewable energy to supplement India’s
energy requirements
Power Purchase Agreement (PPA) shall mean the Power Purchase Agreement signed between off-taker and the Company for procurement of contracted capacity of solar power
Renewable Purchase Obligations (RPO) – Requirements specified by State Electricity Regulatory Commissions (SERCs) as mandated by the National Tariff Policy 2006 obligating
distribution companies to procure solar energy by offering preferential tariffs.
Safe Guard Duty (SGD) – a tax on imported modules from most countries outside India which is 14.9% from July 30, 2020 – January 2021 and 14.5% from January 2021 to June 2021.
Translation to USD – the company has used translations of certain Indian Rupee amounts into U.S. Dollars at specified rates solely for the convenience of the reader, which may vary
due to rounding off.
36|Copyright © 2021 Azure Power |www.azurepower.comTo Be The Number One Provider Of Sustainable Energy Solutions
For A Carbon Neutral World
37|Copyright © 2021 Azure Power |www.azurepower.comYou can also read