Scenario Analyses for 2050 Carbon Neutrality in Japan - Keigo Akimoto Systems Analysis Group Research Institute of Innovative Technology for the ...

Page created by Larry Barber
 
CONTINUE READING
Scenario Analyses for 2050 Carbon Neutrality in Japan - Keigo Akimoto Systems Analysis Group Research Institute of Innovative Technology for the ...
IRENA Forum
                        June 8th, 2021

          Scenario Analyses
 for 2050 Carbon Neutrality in Japan

Keigo Akimoto
Systems Analysis Group
Research Institute of Innovative Technology for the Earth (RITE)
Scenario Analyses for 2050 Carbon Neutrality in Japan - Keigo Akimoto Systems Analysis Group Research Institute of Innovative Technology for the ...
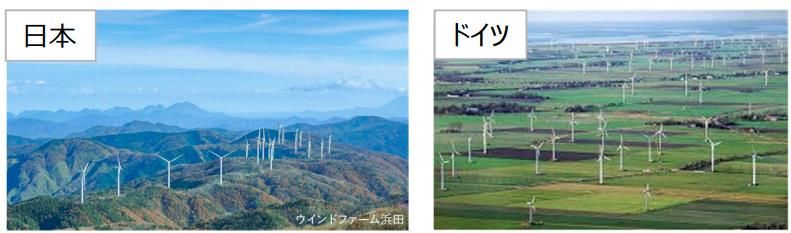
Image of Primary Energy in Japan
                             for Net Zero Emissions                                                                                              2

                                          【Domestic primary energy supply】
                                                                           Energy saving or Reduction
                                                                           in embodied energy of goods/services
                                                                            (incl. Society 5.0)
                                                                                                         The model analyses
                                                                                                          represent consistent energy
                                                                                                          structures and costs which
                                                                                                          are economically rationalized
        【Use of overseas resources】                                                                       with cost minimization under
                                                                                                          assumed conditions of
               Nuclear                                         Nuclear                                    technologies.

                                                  Domestic renewables                                  【Assessment Scenarios】
                                                                                                        The limit on nuclear power is
                                                       Measures of grid to expand                         assumed as a social constraint.
                                                       renewables (incl. storage battery)               The constraint of CO2 storage
Decarbon       Renewable energy
  ized                                                Use of renewables surplus                           potential is also assumed.
                                                      for hydrogen
 energy                                                                                                In this case, the ratio among domestic
                  Use of overseas renewables (green   Sys. fuels prone to be generated from            renewables, overseas hydrogen /
                                                      fossil fuels if the constraint on CO2 is
                  hydrogen) (import of hydrogen,      loose in the producing countries, while          ammonia / syn. fuels is derived with
                  ammonia, and syn. fuels (CCU))      from BECCS or DAC (with increased
                                                      cost) if the constraint is strict.
                                                                                                       cost minimization criterion (the
                                                                                                       solution suggested by the model is
                  Use of overseas CO2 reservoir (pre-combustion CO2                                    not so flexible).
                  capture) (import of blue hydrogen (incl. ammonia))

               Fossil fuels + CCS                     Fossil fuels w/CCS                                                        Domestic CO2 storage

                                                                                                                                Use of overseas CO2
Remaining                                        Fossil fuels                                                                   reservoir (post-
fossil fuels                                                                               BECCS, DACCS                         combustion)
                                                  w/o CCS
                                                                                   Forestation, mineralization (concrete CCU)      【Use of overseas
                                                                           Negative emission technologies (NETs)                   resources】
Scenario Analyses for 2050 Carbon Neutrality in Japan - Keigo Akimoto Systems Analysis Group Research Institute of Innovative Technology for the ...
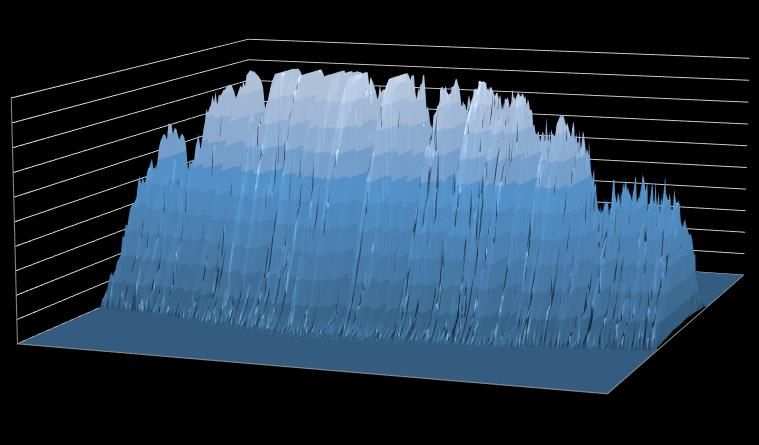
Scenario Assumption for GHG Net Zero Emissions in Japan and
    Share of Renewables in Total Electricity Supply in 2050                                                                                         3

                        Cost of       Ratio of                                                        Fully autonomous
                                                                                   CCUS                                             Share of RE
     Scenario          renewabl       nuclear        Cost of hydrogen                                       driving
                                                                             (Storage potential)                                 in total electricity
                       e energy        power                                                          (Car ride sharing)

                                                                                   Domestic                                             54%
Reference Case*1                        10%
                                                                             storage:91MtCO2/yr,                                (Optimization results)
                       Standard
1. Renewable                                                                       Overseas                                        Almost 100%
                         cost
Energy 100%                              0%                                     transportation:                                    (Assumption)
(RE 100)                                                                         235MtCO2/yr
                                                       Standard cost
2. Renewable                                                                                                                            63%
Energy                 Low cost         10%                                                                                     (Optimization results)
Innovation
3. Nuclear Power                                                              Domestic storage:      Standard assumption                53%
                                        20%
Utilization*2                                                                    91MtCO2/yr,         (no fully autonomous       (Optimization results)
                                                                                  Overseas                    cars)
                                                    Hydrogen production        transportation:
                                                        such as water           235MtCO2/yr
4. Hydrogen                                              electrolysis,                                                                  47%
Innovation                                                hydrogen                                                              (Optimization results)
                                                     liquefaction facility
                                                         cost: Halved
                                                                                 Domestic:
                       Standard
5. CCUS                                                                        273MtCO2/yr、                                             44%
                         cost
Utilization                             10%                                      Overseas:                                      (Optimization results)
                                                                                282MtCO2/yr
                                                                                                    Realization and diffusion
                                                       Standard cost                                   of fully autonomous
                                                                                                    driving and expansion of
6. Demand                                                                     Domestic: 91Mt,         car ride sharing after            51%
Transformation                                                                Overseas: 235Mt        2030, and decrease in      (Optimization results)
                                                                                                    material production due
                                                                                                        to reduction of the
                                                                                                     number of automobiles
*1:There is no feasible solution without DAC, and DAC is assumed to be available in all scenarios for carbon neutrality by 2050 in Japan.
*2:Nuclear power utilization scenarios up to the share of 50% are also examined.
Scenario Analyses for 2050 Carbon Neutrality in Japan - Keigo Akimoto Systems Analysis Group Research Institute of Innovative Technology for the ...
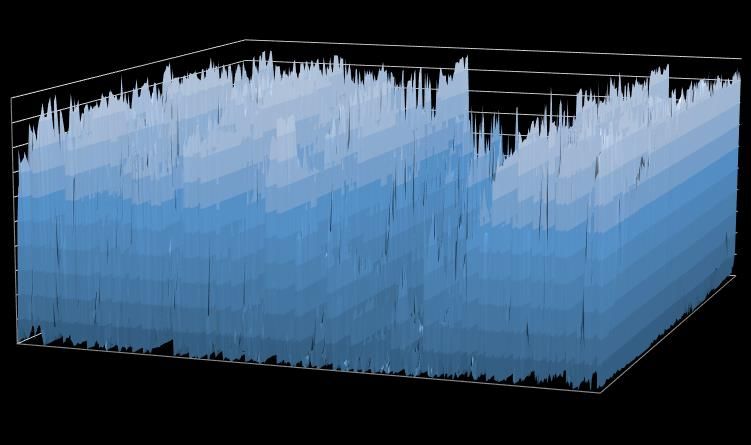
Electricity Supply in Japan in 2050
                                                                                                                                                                             4
                       1600
                                                                                                                                                   Solar PV w/o grid

                                                                                                                                                   Wind power w/o grid
                       1400
                                                                                                                                                   Coal and hydrogen or
                                                                                                                                                   ammonia
                                                                                                                                                   Hydrogen and ammonia
                       1200
                                                                                                                                                   Solar thermal

                                                                                                                                                   Solar PV
Electricity [TWh/yr]

                       1000
                                                                                                                                                   Wind power

                                                                                                                                                   Nuclear power
                       800
                                                                                                                                                   Hydro and geothermal

                       600                                                                                                                         Coal and biomass w/ CO2
                                                                                                                                                   capture
                                                                                                                                                   Biomass w/ CO2 capture

                       400                                                                                                                         Coal and biomass w/o CO2
                                                                                                                                                   capture
                                                                                                                                                   Biomass w/o CO2 capture

                       200                                                                                                                         Gas w/ CO2 capture

                                                                                                                                                   Gas CGS

                         0                                                                                                                         Gas w/o CO2 capture
                                        Reference

                                                               2. RE innovation

                                                                                  3. Nuclear Energy

                                                                                                      4. Hydrogen
                                                    1. RE100

                                                                                                                    Utilization

                                                                                                                                  Transformation
                                                                                                                    5. CCUS
                                                                                                       Innovation

                                                                                                                                    6. Demand
                                                                                                                                                   Oil w/ CO2 capture
                                          case

                                                                                      Utilization

                                                                                                                                                   Oil w/o CO2 capture

                                                                                                                                                   Coal w/ CO2 capture

                                                                                                                                                   Coal w/o CO2 capture
                              2015                                                2050

                        Increases in integration costs are observed in the case where renewable energy share is
                         higher than that in the Reference case. Especially for the RE100 case, a surge in integration
                         costs significantly raises marginal cost of electricity supply, causing considerable decrease
                         in electricity demand. An increase in BECCS instead of fossil fuel with CCS is observed for
                         supply-demand balance.
Scenario Analyses for 2050 Carbon Neutrality in Japan - Keigo Akimoto Systems Analysis Group Research Institute of Innovative Technology for the ...
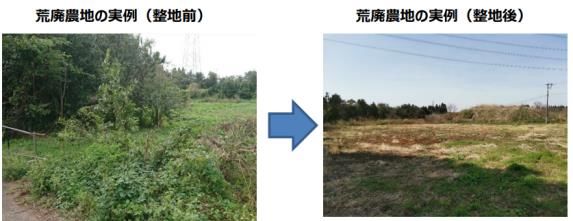
Marginal electricity supply costs for carbon neutrality
       in 2050 : Japan and other developed countries                                                              5

                 Marginal cost of                           Model                               2. Renewable
                    electricity                                             Reference
                                                          estimation                            Energy
                   [US$/MWh]                                                Case*1
                                                           for 2020                             Innovation
Reference
                       221
Case*1                                   Japan                 123                221                  198
1. Renewable
Energy 100%            485                 US                   57                 99                   87
(RE 100)
2. Renewable
Energy                 198                 UK                   99                201                  176
Innovation
3. Nuclear                               France                110                160                  147
Power               215~177
Utilization*2
                                       Germany                 115                188                  164
4. Hydrogen
                       213
Innovation
                                     North Europe               79                127                  111
5. CCUS
                       207
Utilization                          [US$/MWh]

6. Demand                           Note: The costs exclude power transmission and distribution costs excluding
Transformation         221          grid integration costs of VRE.

 For all the countries, marginal electricity costs increase for achieving carbon neutrality. In
  Japan larger increases of the costs are estimated due to higher costs of renewables and the
  grid integration costs, and CO2 storage potentials.
Scenario Analyses for 2050 Carbon Neutrality in Japan - Keigo Akimoto Systems Analysis Group Research Institute of Innovative Technology for the ...
Appendix
Scenario Analyses for 2050 Carbon Neutrality in Japan - Keigo Akimoto Systems Analysis Group Research Institute of Innovative Technology for the ...
Energy Assessment Model: DNE21+
                                   (Dynamic New Earth 21+)                                                7

   Systemic cost evaluation on energy and CO2 reduction technologies is possible.
   Linear programming model (minimizing world energy system cost; with 10mil. variables and
    10mil. constrained conditions)
   Evaluation time period: 2000-2100
     Representative time points: 2005, 2010, 2015, 2020, 2025, 2030, 2040, 2050, 2070 and 2100
   World divided into 54 regions
     Large area countries, e.g., US and China, are further disaggregated, totaling 77 world regions.
   Interregional trade: coal, crude oil/oil products, natural gas/syn. methane, electricity, ethanol,
    hydrogen, CO2 (provided that external transfer of CO2 is not assumed in the baseline)
   Bottom-up modeling for technologies on energy supply side (e.g., power sector) and CCUS
   For energy demand side, bottom-up modeling conducted for the industry sector including steel,
    cement, paper, chemicals and aluminum, the transport sector, and a part of the residential &
    commercial sector, considering CGS for other industry and residential & commercial sectors.
   Bottom-up modeling for international marine bunker and aviation.
   Around 500 specific technologies are modeled, with lifetime of equipment considered.
   Top-down modeling for others (energy saving effect is estimated using log-term price elasticity.
•   Regional and sectoral technological information provided in detail enough to analyze consistently.
•   For analyzing the 2050 carbon neutrality in Japan, the integration costs of VRE are estimated by using a
    generation mix model having five regions within Japan and interregional grid connections developed by the
    University of Tokyo and IEEJ, and they are integrated into the DNE21+.
•   Analyses on non-CO2 GHG possible with another model RITE has developed based on US EPA’s assumptions.
Scenario Analyses for 2050 Carbon Neutrality in Japan - Keigo Akimoto Systems Analysis Group Research Institute of Innovative Technology for the ...
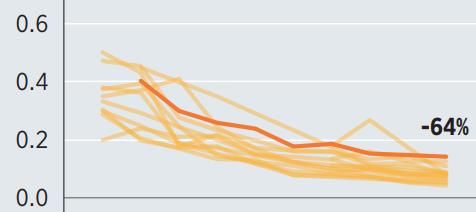
Changes in Solar & Wind Power Generation Costs                                                             8

                                       (yen/kWh)
                                                                               • The cost has been
Solar power generation                                                           largely decreasing.
                                                                               • There is a large price
                                                                                 difference internationally
                                                                                 (this motivates the use
   USD/kWh

                                                                                 of overseas renewable
                                                                                 energy (blue hydrogen)).

                                                                      Solar power
                                                                        (Japan)

                                                                                             First half of 2020: 13.2 yen

                                                                                     7.7 yen
                                                            Solar power
                                                              (World)                            First half of 2020: 5.5 yen

 Wind power generation              (yen/kWh)
                                                Onshore wind power
                                                     (Japan)          Japan                          Germany
             USD/kWh

                                                                                         First half of 2020: 12.9 yen

                                                                                    8.1 yen
                                                    Onshore
                                                   wind power                                        (Source) Advisory
                                                     (World)                   First half of 2020:   Committee for
                                                                                           4.8 yen   Natural Resources
                                                                                                     and Energy
(Source) IRENA
Scenario Analyses for 2050 Carbon Neutrality in Japan - Keigo Akimoto Systems Analysis Group Research Institute of Innovative Technology for the ...
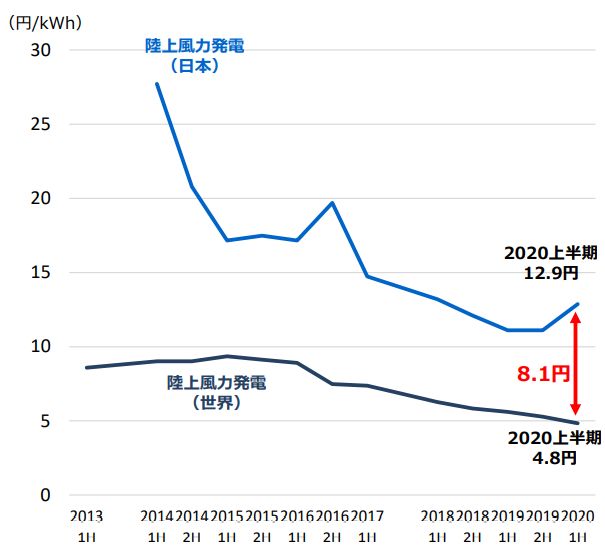
Assumption for Solar PV Power Generation Costs in
                                                           Japan:Time Series                                                                                                                                                                                  9

                                        Rooftop solar PV power generation                                                                                   350     Large-scale solar PV power generation
                                                                                                                                                           350
350 350                                                                                                                                                      350                                                          Rooftop solar PV (Standard
                                                                                   屋根置太陽光(標準シナリオ):下限
                                                                                       Rooftop solarscenario):
                                                                                                    PV (Standard                                                                                        Large-scale solar PV (Standard
                                                                                                                                                                                                                          scenario):
                                                                                                                                                                                                                       大型太陽光(標準シナリオ):下限  scenario):
                                                                                                                                                                                                                                     Lower limit    Lower limit
                                                                        Rooftop solar PV (Standard             Lower limit
                                                                                       scenario): Lower limit
                                                                                   屋根置太陽光(標準シナリオ):上限
                                                                        Rooftop solar PV (Standard scenario): Upper limit                                                                                              大型太陽光(標準シナリオ):上限
                                                                                                                                                                                                        Large-scale solar Rooftop solar PV
                                                                                                                                                                                                                          PV (Standard      (Standard
                                                                                                                                                                                                                                         scenario): Upper limit
                                                                                       Rooftop solar PV (Standard                                           300                                                           scenario): Upper limit
                                  300                                                  scenario): Upper limit                                              300
                                                                                                                                                             300                                                       大型太陽光(低位シナリオ):下限
300                                                                                屋根置太陽光(低位シナリオ):下限
                                                                        Rooftop solar PV (Low scenario): Lower limit                                                                                    Large-scale solar PV (Low scenario): Lower limit
                                                                                                                                                                                                                          Rooftop solar PV (Low scenario):
                                                                                       Rooftop solar PV (Low scenario):                                                                                                   Lower limit
                                                                                                                                                                                                                       大型太陽光(低位シナリオ):上限
                                                                        Rooftop solar PV (Lowlimit
                                                                                               scenario): Upper limit
                                                                                   屋根置太陽光(低位シナリオ):上限
                                                                                       Lower                                                                                                            Large-scale solar PV (Low scenario): Upper limit
                                                                                                                                                            250                                                           Rooftop solar PV (Low scenario):
                                  250
                                  250                                                  Rooftop solar PV (Low scenario):                                      250                                                          Upper limit
                                                                                                                                                           250
250                                                                                    Upper limit

                                                                                                                                                          [$/MWh]
                        [$/MWh]

                                                                                                                                                       [$/MWh]
                  cost [$/MWh]

                                                                                                                                           発電コスト [$/MWh]
                                                                                                                                                            200
                                  200
                                  200                                                                                                                        200
                                                                                                                                                           200

                                                                                                                                                     cost
            発電コスト

                                                                                                                                             発電コスト
200                                                              Cost range of rooftop   Integration cost                                                                                                                               Integration cost

                                                                                                                                    Power generation
                                                                 solar PV in Standard scenario                                                                                                           Cost range of large-scale
 Power generation

                                                                                                                                                            150                                          solar PV in Standard scenario
                                  150                                                                                                                        150
                                  150
                                                                                          Marginal cost increases                                          150
                                             Cost reduction
150                                                                                       as introduction expands
                                             overtime
                                                                                                                                                                    100
                                  100                                                                                                                                100
                                  100
                                                                                   Cost range of rooftop solar PV                                                                                                    Cost range of large-scale
                                                                                                                                                           100                                                       solar PV in Low cost scenario
                                                                                   in Low cost scenario
100

                                  50                                                                                                                                 50
                                                                                                                                                                      50
                                  50
                                                                                                                                                                    50

 50
                                   0                                                                                                                                  00
                                   02010       2015      2020    2025       2030       2035        2040          2045      2050                                        2010
                                                                                                                                                                         2010   2015
                                                                                                                                                                                 2015   2020
                                                                                                                                                                                         2020   2025
                                                                                                                                                                                                 2025        2030
                                                                                                                                                                                                              2030      2035
                                                                                                                                                                                                                          2035      2040
                                                                                                                                                                                                                                      2040      2045
                                                                                                                                                                                                                                                  2045      2050
                                                                                                                                                                                                                                                              2050
                                     2010      2015      2020   2025       2030       2035        2040          2045      2050
                                                                                                                                                                     0
                                                                                                                                                                         2010   2015    2020    2025          2030        2035        2040         2045           2050
   0
                   2010                     2015         Assumption
                                                      2020   2025  2030 on integration
                                                                            2035  2040 cost
                                                                                        2045                                 2050
                                                                                                                                       Cost and potential curve in 2050 is given on page 28.
                                                         is given on page 30.
               *It should be noted that this is the average cost of the facility stock installed at each point in time, and is not the cost limited to new facility
               installed at that point in time.
               (Note) The gradation part is just an image of model calculation.
Scenario Analyses for 2050 Carbon Neutrality in Japan - Keigo Akimoto Systems Analysis Group Research Institute of Innovative Technology for the ...
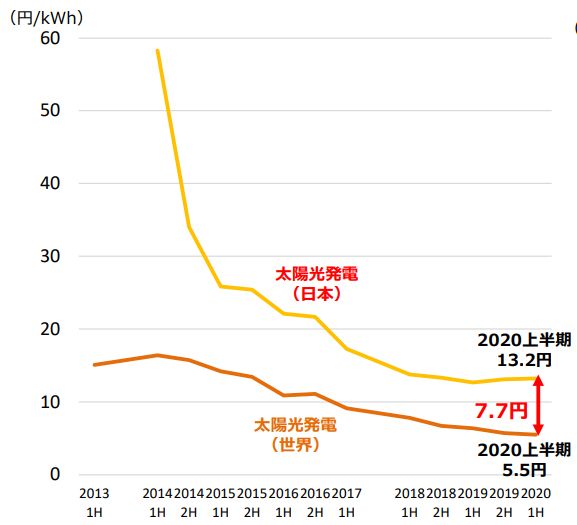
Assumption for Rooftop Solar
                                       PV Power Generation Cost in Japan: Time Series                                                                                                                        10

                                                            Stock                                                                                                     Flow
                          350                                                                                                       350

                                                                     Roof Mount Solar (standard
                                                                    屋根置太陽光(標準シナリオ):下限                                                                                          Roof Mount Solar (standard
                                                                                                                                                                              屋根置太陽光(標準シナリオ):下限
                                                                     scenario) Low Limit                                                                                       scenario) Low Limit

                                                                     Roof Mount Solar (standard                                                                                Roof Mount Solar (standard
                          300                                       屋根置太陽光(標準シナリオ):上限
                                                                     scenario) High Limit                                           300                                       屋根置太陽光(標準シナリオ):上限
                                                                                                                                                                               scenario) High Limit

                                                                     Roof Mount Solar (low-level                                                                               Roof Mount Solar (low-level
                                                                    屋根置太陽光(低位シナリオ):下限
                                                                     scenario) Low Limit                                                                                      屋根置太陽光(低位シナリオ):下限
                                                                                                                                                                               scenario) Low Limit

                                                                     Roof Mount Solar (low-level                                                                               Roof Mount Solar (low-level
                          250                                       屋根置太陽光(低位シナリオ):上限
                                                                     scenario) High Limit
                                                                                                                                    250                                       屋根置太陽光(低位シナリオ):上限
                                                                                                                                                                               scenario) High Limit
           cost [$/MWh]

                                                                                                                     cost [$/MWh]
                          200                                                                                                       200
        発電コスト

                                                                                                                  発電コスト
Generation

                                                                                                          Generation
                          150                                                                                                       150

                          100                                                                                                       100

                           50                                                                                                        50

                            0                                                                                                         0
                                2010   2015   2020   2025    2030   2035     2040      2045        2050                                   2010   2015   2020   2025    2030   2035     2040      2045        2050
Assumption for Large-Scale Solar
                                       PV Power Generation Cost in Japan: Time Series                                                                                                                            11

                                                            Stock                                                                                                       Flow
                          350                                                                                                         350

                                                                      Large-Scale Solar (standard
                                                                     大型太陽光(標準シナリオ):下限                                                                                             Large-Scale Solar (standard
                                                                                                                                                                                 大型太陽光(標準シナリオ):下限
                                                                      scenario) Low Limit                                                                                         scenario) Low Limit

                                                                      Large-Scale Solar (standard                                                                                 Large-Scale Solar (standard
                                                                                                                                                                                 大型太陽光(標準シナリオ):上限
                          300                                        大型太陽光(標準シナリオ):上限                                                 300
                                                                      scenario) High Limit                                                                                        scenario) High Limit

                                                                      Large-Scale Solar (low-level                                                                                Large-Scale Solar (low-level
                                                                     大型太陽光(低位シナリオ):下限
                                                                      scenario) Low Limit                                                                                        大型太陽光(低位シナリオ):下限
                                                                                                                                                                                  scenario) Low Limit

                                                                      Large-Scale Solar (low-level                                    250                                         Large-Scale Solar (low-level
                          250                                        大型太陽光(低位シナリオ):上限                                                                                            大型太陽光(低位シナリオ):上限
                                                                      scenario) High Limit                                                                                        scenario) High Limit

                                                                                                                       cost [$/MWh]
           cost [$/MWh]

                          200                                                                                                         200

                                                                                                                    発電コスト
       発電コスト
Generation

                                                                                                            Generation
                          150                                                                                                         150

                          100                                                                                                         100

                           50                                                                                                          50

                            0                                                                                                           0
                                2010   2015   2020   2025    2030   2035      2040       2045        2050                                   2010   2015   2020   2025    2030   2035      2040       2045        2050
Assumption for Japan’s Variable Renewable Energy
                                                                                                                                                                                                                     12
                                            Cost and Potential in 2050
                                      800
                                                  太陽光発電(標準シナリオ)
                                                   Solar PV (Standard scenario)          Low cost                            Standard cost
                                                                                         scenario                            scenario
                                      700         太陽光発電(低位シナリオ)
                                                   Solar PV (Low scenario)
                           [TWh/yr]

                                                  陸上風力発電(標準シナリオ)
                                                   Onshore wind (Standard)
                                                                                                                                Possibility of cost increase due to deterioration of
                                      600
                      [TWh/yr]

                                                  陸上風力発電(低位シナリオ)
                                                   Onshore wind (Low)                                                           land conditions because of expanding installed
                                                                                                                                capacity (not fully considered in the model)
                                                  洋上風力発電(標準シナリオ)
                                                   Offshore wind (Standard)       Possibility of further
      generation potential

                                                                                                           Devastated agricultural land        Devastated agricultural land
                                                                                                           (before leveling)                   (after leveling)
                                                                                  cost down due to
                                      500
                                                  洋上風力発電(低位シナリオ)
                                                   Offshore wind (Low)            technological progress
Power 発電ポテンシャル

                                      400
                                                                                                           It should be noted that cost increases due to worsening land conditions, such as land
                                                                                                           preparation costs for devastated agricultural land, are not fully incorporated.
                                                                                                                                                          The condition is that various restrictions are resolved.
                                      300
                                                                                                                                                          1. Promotion of location in the protection forest area
                                                                                                                                                          (Relaxation of designation cancellation requirements,etc.)
                                                                                                                                                          2. Elimination of location restrictions in natural parks
                                                                                                                                                          (Reexamination of area designation)
                                                                                                                                                          3.Promotion of location in the green corridor
                                      200                                                                                                                 4.Promotion of location in abandoned cultivated land and
                                                                                                                                                          degraded agricultural land (relaxation of agricultural
                                                                                                                                                          promotion exclusion requirements)

                                                Continued effort in 2030:110 TWh/yr
                                      100

                                                                                                                                               Strengthening policy in 2030: 29 TWh/yr
                                        0                                                                                                      Strengthening policy in 2030: 10 TWh/yr
                                            0                  50                        100                          150                              200                      250
                                                                  Power発電コスト
                                                                          generation[$/MWh]
                                                                                      cost [$/MWh]
           *Cost and potential of solar PV power generation is estimated by RITE based on the GIS data for the amount of solar radiation and
           land use, and facility costs, etc. Both rooftop and large-scale solar power generation are included in this Figure. Cost and potential of
           onshore wind power generation is estimated by RITE based on the GIS data for wind conditions and land use, and facility costs, etc.
Assumptions for Estimating Integration Cost
                     in the Univ. Tokyo - IEEJ Model                                                                                                                                                                                                                                                                                                        13

 Regional aggregation                           Output
                                                (p.u.)
                                                 1
                                                                                                                                                                                                                  Output
                                                                                                                                                                                                                  (p.u.)
                                                                                                                                                                                                                  1
                                               0.9                                                                                                                                                               0.9

 Divide Japan into 5 regions: [1]              0.8
                                               0.7
                                                                                                                                                                                                                 0.8
                                                                                                                                                                                                                 0.7
                                               0.6

 Hokkaido, [2]     Northeastern
                                                                                                                                                                                                                 0.6
                                                0.5                                                                                                                                                              0.5
                                                0.4                                                                                                                                                              0.4
                                                0.3

 area, [3] Tokyo, [4] Western                   0.2
                                                0.1
                                                                                                                                                                                20:00
                                                                                                                                                                             16:00
                                                                                                                                                                          12:00
                                                                                                                                                                                                                 0.3
                                                                                                                                                                                                                 0.2
                                                                                                                                                                                                                 0.1
                                                                                                                                                                                                                                                                                                                                                               20:00
                                                                                                                                                                                                                                                                                                                                                            16:00
                                                                                                                                                                                                                                                                                                                                                         12:00
                                                  0

 area other than Kyushu, [5]                                                                                                                                           8:00                                        0                                                                                                                                  8:00

                                                      1-Jan

                                                              1-Feb

                                                                                                                                                                                                                       1-Jan
                                                                      1-Mar

                                                                                                                                                                                                                               1-Feb
                                                                                                                                                                   4:00

                                                                              1-Apr

                                                                                                                                                                                                                                        1-Mar
                                                                                      1-May
                                                                                                                                                                                                                                                                                                                                                  4:00

                                                                                                                                                                                                                                                 1-Apr
                                                                                              1-Jun

                                                                                                                                                                                                                                                         1-May
                                                                                                      1-Jul

                                                                                                                                                                                                                                                                 1-Jun
                                                                                                              1-Aug

                                                                                                                                                                                                                                                                              1-Jul
                                                                                                                      1-Sep

                                                                                                                                                                                                                                                                                       1-Aug
                                                                                                                                                               0:00

                                                                                                                              1-Oct

                                                                                                                                                                                                                                                                                               1-Sep
                                                                                                                                                                                                                                                                                                                                              0:00

                                                                                                                                      1-Nov

                                                                                                                                                                                                                                                                                                       1-Oct
                                                                                                                                              1-Dec

                                                                                                                                                                                                                                                                                                               1-Nov
                                                                                                                                                      31-Dec

                                                                                                                                                                                                                                                                                                                            1-Dec

                                                                                                                                                                                                                                                                                                                                     31-Dec
 Kyushu
                                                                      Output example of PV                                                                                                                        Output example of wind power
Considered in modeling・・・ Output control, power storage system (pumped hydro, lithium-ion battery and hydrogen storage),
                          reduction of power generation facility utilization, inter-regional power transmission lines,
                          electricity loss in storage and transmission
Not considered in modeling・・・ Intra-regional power transmission lines, power grid, influence of decrease of rotational inertia,
                             grid power storage by EV, prediction error of VRE output, supply disruption risk during dark doldrums

 Power storage system                                                                                                                  Marginal cost of grid integration for VRE in Japan
                                                                                                                                                                                                   700

 Mainly with Lithium-ion battery (setting 150$/kWh in 2050                                                                                                                                                        太陽光
                                                                                                                                                                                                                  Solar PV

 based on estimation by the National Renewable Energy                                                                                                                                              600            風力
                                                                                                                                                                                                                  Wind

 Laboratory (NREL)), it is assumed that existing pumped-
 storage hydropower and hydrogen storage will be used

                                                                                                                                                                                  cost [US$/MWh]
                                                                                                                                                                                                   500

 together.

                                                                                                                                                                      integration [US$/MWh]
                                                                                                                                                                                                   400

 Cost of interconnection lines

                                                                                                                                                                   系統統合費用
                                                                                                                                                                                                   300
 With reference to the plan by the Organization for Cross-
 regional Coordination of Transmission Operators, costs of                                                                                                       Grid
                                                                                                                                                                                                   200
 interconnection lines are assumed to be 200,000 yen/kW
 between areas [1] [2] and [3][4], and 30,000 yen/kW in                                                                                                                                            100

 other areas, with an annual expense ratio of 8%.
 Underground transmission lines and submarine cables                                                                                                                                                 0
                                                                                                                                                                                                         0   5         10          15           20       25              30           35       40        45            50           55          60
 between Hokkaido and Tokyo are not considered.                                                                                                                                                                            Share in total power generation
                                                                                                                                                                                                                              総発電電力量に対するシェア           [%] (%)
Assumption for Nuclear Power Generation Cost
                                                                                                            14

                                                                    Power generation unit price
                            Facility cost ($/kW)
                                                                            ($/MWh)
     Year
                   Year 2000 price         Year 2018 price       Year 2000 price Year 2018 price

    2020                  2763                   4029                    75                   110

    2030                  2779                   4053                    76                   111

    2050                  2794                   4075                    78                   114

    2100                  2824                   4117                    79                   115

*1 The figures in the table are assumed values for Japan. For the rest of the world, location factors are
multiplied, resulting in slightly different assumptions.
*2 Since the base year of the model is 2000, the 2000 price is also shown; the conversion from the 2000
price to the 2018 price is multiplied by 1.46 (based on CPI of U.S.).
*3 The conversion to cost per unit of electricity generated is based on a capacity factor of 85%.
Assumption for CO2 Capture Technology                                                                                   15

                                              Capital costs (price in 2000)            Generating efficiency             CO2 recovery rate
                                                         ($/kW)                             (LHV%)                             (%)
 IGCC/IGFC with CO2 Capture*1                           2800 – 2050                           34.0 – 58.2                       90 – 99
   Natural gas oxy-fuel power*1                       1900 – 1400                             40.7 – 53.3                     90 - 99
                                              Capital costs (price in 2000)                Required power                CO2 recovery rate
                                                   (1000$/(tCO2/hr))                        (MWh/tCO2)                         (%)
  Post-combustion CO2 capture
                                                          851 – 749                         0.308 – 0.154                          90
  from coal-fired power plants*1
  Post-combustion CO2 capture
   from natural gas-fired power                         1309 – 1164                         0.396 – 0.333                          90
              plants*1
   Post-combustion CO2 capture
                                                        1964 – 1728                         0.809 – 0.415                          90
 from biomass-fired power plant*1

  CO2 capture from gasification*1                             62                                 0.218                          90 – 95
   CO2 capture from steelworks
                                                          386 - 319                         0.171 – 0.150                          90
       blast furnace gas*1
                                                                                     Required fuel (GJ/tCO2)
                                              Capital costs (price in 2000)                                              CO2 recovery rate
                                                                                       Recovered power
                                                   (1000$/(tCO2/hr))                                                           (%)
                                                                                          (MWh/tCO2)
      CO2 capture from clinker                                                             4.87 – 3.66
                                                        2485 - 2246                                                                90
         manufacturing*2                                                                 0.199 – 0.150
*1 The range of values in the table indicates improvement from 2015 to 2100.
*2 It is assumed that the assumed values have a range shown in the table depending on the fuel type used in the kiln body, CO2 capture, and
compression equipment.
Note) It is 2000 price. The US consumer price index (CPI) in 2018 is 1.46 when the CPI in 2000 is 1.
Not only the CO2 capture technologies in the power sector, but also CO2 capture from gasification (during hydrogen production) and CO2
capture from steelworks blast furnace gas and from clinker manufacturing are explicitly modeled.
Assumption for CO2 Transportation and Storage                                                                                                                16

                                               CO2 storage potentials (GtCO2)                                【References】
                                                                                                                                                  Storage costs
                                                                                                          IPCC SRCCS (2005)
                                                                                                                                                    ($/tCO2)*1
                                                  Japan                          World                         (GtCO2)
    Depl. oil well (EOR)                             0.0                          112.4                                                              92 – 227*2
                                                                                                                    675–900
        Depl. gas well                               0.0                    147.3 – 241.5                                                               10 – 32

    Deep saline aquifer                             11.3                         3140.1                              103–104                            5 – 85

     Coalbed (ECBMR)                                 0.0                          148.2                               3–200                          47 – 274*2
Note 1: It is assumed that the CO2 storage potentials of depl. gas well could be expanded to the upper limit in the table with the increase of future mining volume.
Note 2: It is assumed that the storage costs could rise within the range in the table with the increase of accumulated storage amount.
*1 The costs for CO2 capture are not included. They are assumed separately.
*2 Oil and gas profits from enhanced oil recovery and enhanced methane recovery are not included in this figure, but they are assumed separately.
 The constraint on CO2 storage expansion is assumed considering the difficulties of its rapid
  expansion, e.g. limited number of drilling rigs; storage can be expanded by 0.02%/yr until 2030 and
  afterwards by 0.04%/yr for domestic/regional total storage implementation in the baseline scenario.
  (The maximum storage potential in 2050 is 91MtCO2/yr in Japan’s case, where CCS is assumed to be
  available after 2030.)
 It can be expanded up to 3 times (273 MtCO2/yr) that in CCUS innovation scenario. (Total storage
  potential is fixed.)
CO2 transportation cost
 CO2 transportation costs from the sources to the reservoirs are assumed separately as 1.36$/tCO 2
  (per 100km) and 300km for average transport distance in Japan’s case.
 For large area countries which are disaggregated in the models (US, Russia, China and Australia),
  the interregional CO2 transportation costs are estimated according to the transportation distance.
 Cross-border CO2 transportation is also assumed. In Reference scenario, the upper limit of export
  from Japan is 235 MtCO2 (equivalent to one-sixth of 2013 GHG emissions). (In CCUS utilization
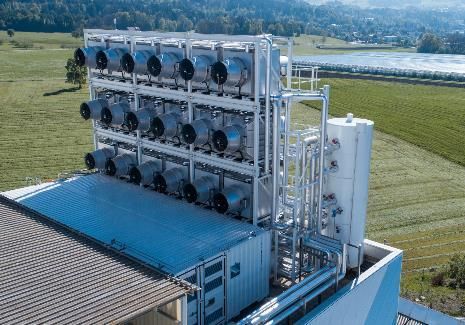
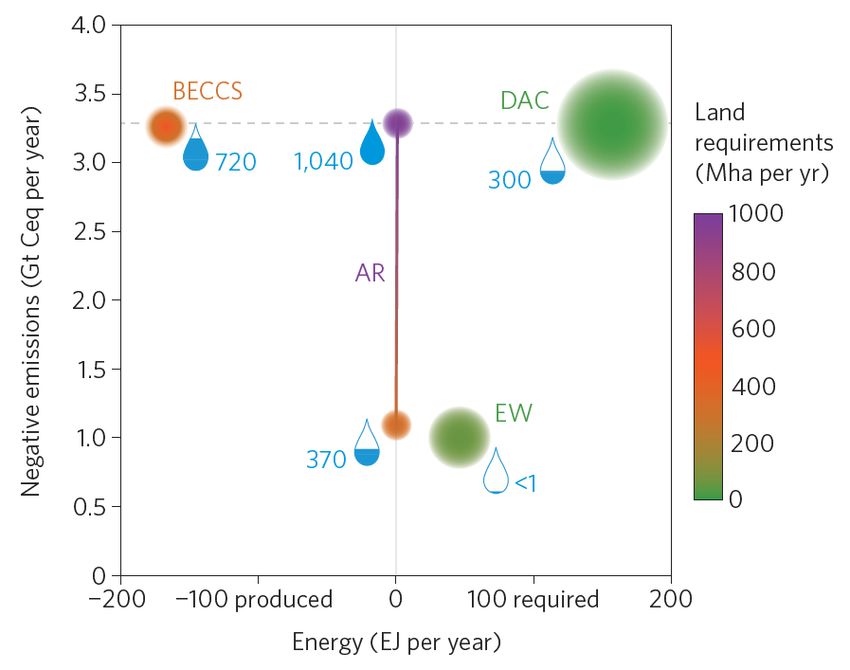
  scenario, it is 282 MtCO2 (equivalent to one-fifth of 2013 emissions)).
Assumption for Direct Air Capture (DAC)
                                                                                                                             17

 DAC is a technology to capture atmospheric CO2 at low level of about 400ppm, requiring
  more amounts of energy than capturing exhaust gas emissions from fossil fuels
  combustion.
 On the other hand, DACCS (up to storage) can achieve negative emissions.
                                                                  Required energy (horizontal
 It is economical to deploy in area close
                                                                  axis), Land areas (color),
  to CO2 storage and where energy supply                          Investments (circle size) etc.
  is available at low cost such as low
                               cost PV.

                                                                                                EW: Enhanced weathering
                                                                                                AR:Afforestation and reforestation
                                                                                                 Smith et al. (2015)
                                             Climeworks
 Assumed energy consumption and facility costs of DAC in 2020 based on M. Fasihi et al., (2019):
 This analyses adopt “Conservative” among 2 scenarios, “Base” and “Conservative”, by Fasihi et al.
                                                      Energy consumption (/tCO2)          Facility costs(Euro/(tCO2/yr))

                                                                   2020            2050      2020                2050
 High temperature (electrification)
                                               Elec. (kWh)         1535            1316       815                 222
 system (HT DAC)
 Low temperature systems                       Heat (GJ)     6.3 (=1750 kWh)       4.0        730
 (LT DAC): use of hydrogen or gas for heat                                                                        199
                                               Elec. (kWh)         250             182
Assumption for Hydrogen Production and
                            Transport-Related Technologies                                                                                                           18

Hydrogen production technologies
                                                                   Facility cost (US$/(toe/yr))                            Conversion efficiency (%)

                 Coal gasification                                           1188 - 752                                                  60%
                  Gas reforming                                              963 - 733                                                   70%
              Biomass gasification                                           1188 - 752                                                  60%
                Water electrolysis                                           2050 - 667                                               64 - 84%

Liquefaction technology
                                                                   Facility cost (US$/(toe/yr))                       Electricity consumption (MWh/toe)

        Natural gas/Synthetic methane                                            226                                                     0.36
                     Hydrogen                                                   1563                                                     1.98

Transport cost
                                                                                       Facility cost                                     Variable cost*1
                                                                                   Electricity: $/kW
                                                                                                                                         Energy: US$/toe
                                                                               Other energy: US$/(toe/yr)
                                                                                                                                         CO2: US$/tCO2
                                                                                  CO2:US$/(tCO2/yr)
                        Electricity*2                                                  283.3+1066.7L                                              -
                                         Pipeline*3                                       210.0L                                                5.0L
        Hydrogen
                                          Tanker                                           69.5L                                            7.26+0.60L
                                         Pipeline*3                                        99.4L                                                2.35L
           CO2
                                          Tanker                                           47.5L                                                1.77L
      Natural gas                        Pipeline*2                                       128.3L                                                3.5L
 (The same applies to
  synthetic methane.)                     Tanker                                           35.1L                                            8.09+0.39L
L: Distance between regions (1000km)
*1 For ships, the distance-independent term assumes fuel costs. For pipelines, the distance-dependent terms assume fuel costs and compression power costs, respectively.
*2 For submarine transmission lines, fixed costs are assumed to be 10 times higher than the above.
*3 For submarine pipelines, fixed costs are assumed to be three times higher than above.
Assumption for Shared Mobility Induced
                           by Fully Autonomous Cars                                                                                                                                                                             19

 In the case where demand decreases through car-sharing, fully autonomous shared
   cars can be available after 2030, and key parameters are assumed as below, mainly
   following Fulton et al. (2017).
                                                               Assumption for ride-sharing                                                                                      Assumption for car-sharing
                                                   40                                                                                                                 200
                Increase in number of passengers

                                                                                                                               Increase in annual distance traveled
                                                   35

                                                                                                                                 per vehicle due to car-sharing [%]
                                                   30                                                                                                                 150
                          per vehicle [%]

                                                   25

                                                   20                                                                                                                 100

                                                   15

                                                   10                                                                                                                  50

                                                   5

                                                   0                                                                                                                    0
                                                        0        1500       3000      4500       6000      7500         9000                                                0         200          400           600      800
                                                            Passenger car travel service per area [thousand p-km/km2]                                                                   Population density [person/km2]

        Items                                                                                        Traditional car (private car)                                                   Fully autonomous car (shared car)
        Car body price                                               2030: +10000$             Assumed precisely depending
                                                                     2050: +5000$              on car types
                                                                     2100: +2800$
                                                                     (compared to traditional cars)
      Lifespan of car                13-20 years                     4-19 years
      Number of passengers per       2050: 1.1-1.5 passengers        2050: 1.17-2.06 passengers
      vehicle                        2100: 1.1-1.3 passengers        2100: 1.11-1.89 passengers
 Opportunity costs of time required for driving and costs related to safety are considered.
 Impacts of the reduction in the number of cars induced by car- & ride-sharing are considered.
Following impacts driven by decrease in the number of cars are considered: 1. decrease in steel
products and plastic products, 2. decrease in concrete and steel products due to the decrease in multi-
storey car park space.
Global Baseline Emissions and
                             Assumed Emissions Scenarios under 2C and 1.5C                                                                                                                            20

                           80
                                                                    CO2 emissions
                           60                                                                                                                                 Net zero CO2 emissions
                                                                                                                                                              around 2050
CO2 emissions [GtCO2/yr]

                           40
                                                                                                                                                               Net zero CO2 emissions
                                                                                                                                                               around 2060
                           20
                                                                                                                                                                Net zero CO2 emissions
                            0                                                                                                                                   around 2100
                                     Historical
                                     Baseline                                                                                                                   Net zero GHG emissions
                           -20       2DS(▲40% GHG in 2050)                                                                                                      around 2065
                                     B2DS(▲70% GHG in 2050)
                                                                                                                                                                            Net zero GHG emissions
                                     Below 1.5℃ in 2100 (>66%)
                           -40                                                                                                                                              around 2100
                              2000   2010         2020   2030    2040   2050   2060   2070                                 2080          2090         2100
                                                                                                                     120
                                                                                                                                                               GHG emissions
                                                                                                                                  Historical
                     Note) Emissions for baseline shows model estimates                                                           Baseline
                                                                                                                     100
                     results under SSP2, not assumed scenario                                                                     2DS(▲40% GHG in 2050)
                                                                                                                                  B2DS(▲70% GHG in 2050)
                  ※ 2DS, B2DS, B1.5OS scenarios assume
                                                                                        GHG emissions [GtCO2eq/yr]

                                                                                                                     80           Below 1.5℃ in 2100 (>66%)

                  emission constraints equivalent to NDCs of
                                                                                                                     60
                  each nation up to 2030
                                                                                                                     40

               In the scenario analyses of Japan’s 2050 carbon neutrality,                                           20

               1.5C global scenarios are assumed in addition to Japan’s
                                                                                                                      0
               emissions reduction scenarios, for the global competition
               for carbon neutral resources to be considered.
                                                                                                                     -20
                                                                                                                        2000      2010         2020    2030   2040   2050   2060   2070   2080   2090   2100
【ref.】Concept of Innovation in Power Supply Ref. Value
                                                                                                                                                                                                                    21
                                       Each power source must overcome a large hurdle to achieve the reference values for power sources in 2050 as
                                        presented at the Strategic Policy Committee.
                                       Under these conditions, for the 30 to 40% of nuclear power and fossil+CCUS, in case the upper limit of nuclear
                                        power is 10%, it is necessary to cover 20-30% with fossill+CCUS, thus it is assumed a considerable amount of CO2
                                        is stored at home/abroad including CCUS required amount other than the electric power sector. For hydrogen/
                                        ammonia and carbon recycled fuel, it is assumed that infrastructure development, etc. is expected to execute a
                                        large-scale transportation without setting the upper limit of supply on the model.
                                       It should be noted that in this analysis, the conditions were set by mechanically assuming such CCS storage
                                        amount based on the above reference values.                                  2020/12/21 Strategic Policy Committee Material

    In order to aim for carbon neutrality in 2050, stable power supply from decarbonized power sources is indispensable. From the perspective of 3E+S, multiple
    scenarios will be analyzed without limiting to the following. In deepening the discussion, the positioning of each power source is suggested as follows.
                                           Renewable Energy                ・ Continue to aim for maximum introduction as the main power source in 2050.
    Established decarbonized

                                                                           ・ Immediately work on issues to promote the maximum introduction such as adjustment amount, transmission capacity, ensuring
                                                                           inertial force, responding to natural conditions and social constraints, maximizing cost control, and increasing social transformation
                                                                           to cost increases.
         power source

                                                                           ・ How about deepening discussions on covering 50-60%(approx.) of the generated power (* 1) with renewable energy in 2050 as a
                                                                           reference value (* 2)?

                                           Nuclear power                   ・As an established decarbonized power source, aim for a certain scale of utilization on the premise of safety.
                                                                           ・ In order to restore public trust, make an increased effort to improve safety, gain understanding and cooperation of the location
                                                                           area, solve back-end problems, secure business feasibility, maintain human resources and technical capabilities, etc. How about
                                                                           deepening discussion on covering 30-40% (approx.) with nuclear power which is a carbon-free power source other than renewable
                                                                           energy and hydrogen/ammonia, along with fossil+CCUS/carbon cycle in 2050 as a reference value (* 2)?

                                                                           ・ While having the advantages of supply capacity, adjustment power, and inertial force, decarbonization of fossil-fired power is the
    Power sources required innovation

                                                           Fossil + CCUS
                                                                           disadvantage.
                                                                           ・Aim to utilize on a certain scale iimmediately by developing technology and suitable sites, expanding applications and reducing
                                                                           cost, etc., toward the implementation of CCUS / carbon recycling. How about deepening discussion on covering 30-40% (approx.)
                                           Thermal power

                                                                           together with nuclear power which is a carbon-free power source other than renewable energy and hydrogen/ammonia in 2050 as a
                                                                           reference value (* 2)?

                                                           Hydrogen,       ・While having the advantages of adjusting power and inertial force without emitting carbon during combustion, the challenges are
                                                           Ammonia         establishing technology for large-scale power generation, reducing costs, and securing supply. Aim to build a stable supply chain
                                                                           immediately by promoting co-firing of gas-/coal-fired power, increasing supply and demand.
                                                                           ・Aim for a certain scale of utilization as a carbon-free power source, taking into account competition with industrial and
                                                                           transportation demand. Based on the fact that procurement required for future power generation is estimated to be 5-10-million ton
                                                                           as basic hydrogen strategy, how about deepening discussion on covering 10% (approx.) of generated power with
                                                                           hydrogen/ammonia in 2050 as a reference value (* 2)?

*1: The amount of power generated in 2050 will be about 1.3-1.5 trillion kwh as a reference value (* 2) based on the power generation estimation by RITE presented at "the 33rd Strategic
Policy Committee".
*2: This is not as a government goal, this is one guideline / option for future discussions. This will be the one of options to deliberate in considering multiple scenarios in the future.
【ref.】Marginal Abatement Cost & Total Energy System Cost
                                                                                                                             22

   ※ The cost curve is illustrated as an image (in reality, it is complicated
   due to the correlation between technologies)                            [Area cost]:
                                                                                     [▲100%Total Energy System Cost]-
                                                                                     [Baseline Total Energy System Cost]

                                                                                                          Energy System
                                                                                                                Cost*1
                                                                                                          (billion US$/yr)
                                                                                      Reference
                                                                                                         1179         ―
                                                                                      case
                                                                                      1.Renewable
                                                                                                         1284       (+106)
                                                                                      Energy 100%
                                                                                      2.Renewable
                                                                                      Energy             1142        (-37)
                                                                                      Innovation
                                                                                      3.Nuclear
                                                                                                        1166~
                                                                                      Power                       (-13~-45)
                                                                                                         1133
                                                                                      Utilization*2
                                                                                      4.Hydrogen
                                                                                                         1160        (-19)
                                                                                      Innovation
                                                                                      5.CCUS
                                                                                                         1150        (-29)
                                                                                      Utilization
                                                                                      6.Case where
                                                                                      demand
                                                                                                         909        (-270)
                                                                                      decreases due
*1:Numbers in parentheses are fluctuations from the reference                         to car sharing
*2:Nuclear utilization scenarios represent results from 20% and 50% nuclear ratios
CO2 Marginal Abatement Costs for carbon neutrality
       in 2050: Japan and other countries              23

                                   2. Renewable
                  Reference Case
                                   Energy Innovation
        Japan            525              469

             US          167              138

             UK          181              141

             EU          211              169

        Others           162              138
[US$/tCO2]
You can also read