Savola Group Earnings Presentation | Q1 2021 - www.savola.com - Amazon AWS
←
→
Page content transcription
If your browser does not render page correctly, please read the page content below

Savola Group
                                  www.savola.com
Earnings Presentation | Q1 2021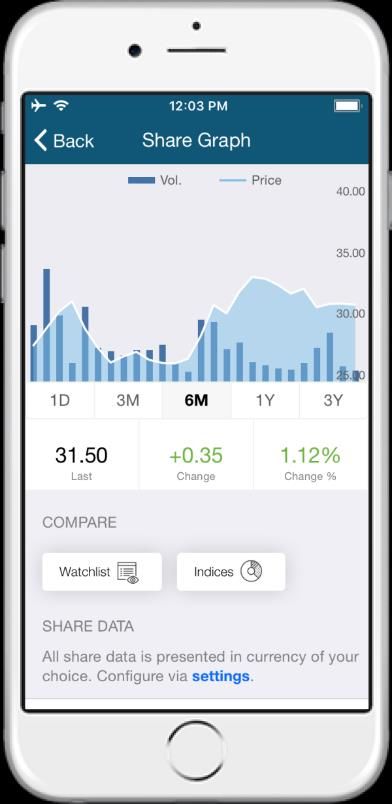
DISCLAIMER

This presentation might contain forward-looking statements which may be identified by the use of words like “plans,”
“expects,” “will,” “anticipates,” “believes,” “intends,” “projects,” “estimates” or other words of similar meaning. All
statements that address expectations or projections about the future, including, but not limited to, statements about the
strategy for growth, market position, expenditures, and financial results, are forward looking statements.

Forward-looking statements are based on certain assumptions and expectations of future events. The Savola Group (Savola
or Group), its subsidiaries and its affiliates (the “Companies”) referred to in this presentation cannot guarantee that these
assumptions and expectations are accurate or will be realized. The actual results, performance or achievements of the
Companies, could thus differ materially from those projected in any such forward-looking statements. The Companies
assume no responsibility to publicly amend, modify or revise any forward looking statements, on the basis of any
subsequent developments, information or events, or otherwise.

Information contained in this presentation is subject to change without further notice, its accuracy is not guaranteed, and it
may not contain all material information concerning The Savola Group and its affiliates. We do not make any
representation regarding, and assume no responsibility or liability for the accuracy or completeness of, or any errors or
omissions in, to any information contained herein.

                                                                                                                                 2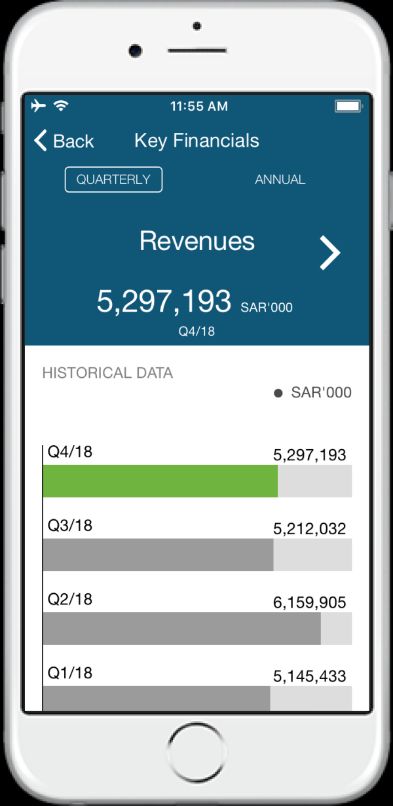
1. Group Overview & Business Model

2. Group Key Financial Highlights

3. Performance by Segment

                                     3
LEADING STRATEGIC INVESTMENT HOLDING COMPANY
Our core focus is on the food and retail space across the MENA region
Turnover of SAR Countries of
22 billion
1 Operations: 9+
Strong & Diversified
+25,000 Employees
Shareholder Base
+SAR
20bn
Market
Cap 2
(1) – As of FY2020
(2) - Tadawul, as at 29 April 2021 4BUSINESS MODEL AND STRATEGY
How we add value
Savola Group is a strategic investment holding with a thematic investment program focused on the food and retail sectors, with
the aim of creating value by enabling and accelerating growth levers in the underlying portfolio to achieve scale and profitability
Leadership & Governance Capital Allocation
Setting Targets and Performance Monitoring Long-term strategic planning
5EXPANSION HISTORY
• Made the largest investment of • Launch of corporate
SAR 2bn by acquiring additional venture capital program
stake of 6.5% in Almarai with two investments
• Established with a paid up • Savola merged with Azizia
• Launch of Afia olive oil in KSA
capital of SAR 40mn Panda United (included Herfy) 2020
1991 2008-’9
1978 1998 2012
• Panda acquired Giant Stores and a
2018
• Acquired 40% stake in Almarai
retail chain in Lebanon • Acquisition of 51% of Al
• Panda Acquired Geant Stores Kabeer Group, a regional
• Acquired oil business in Turkey frozen food player
6KEY STRENGTHS AND GEOGRAPHICAL PRESENCE
Broad and diversified
Extensive consumer and Turkey
geographic footprint and
market understanding product offering
Morocco Iraq Central
Asia
Algeria
Strong and experienced Difficult to replicate
management with Egypt market leadership position
outstanding historical UAE in large and fragmented
financial track record markets
Saudi Arabia
Sudan
Leading brand positions and
Resilient business model
high awareness in majority
based on stable revenue
One of the largest private of markets that Savola is
generation by serving
sector employer of Saudi operating in
consumers’ basic needs
nationals with strong focus
on female employment
Countries with manufacturing presence
71. Group Overview & Business Model
2. Group Key Financial Highlights
3. Performance by Segment
8GROUP - HIGHLIGHTS
• Overall stable performance across the group compared to Q1 2020 due to the
positive uplift related to COVID-19 related dynamics
Business Highlights • In Foods, strong performance led by KSA and Egypt driven by volumes and re-pricing
• Retail segment showed some weakness when compared to the high base of Q1 2020
and pressure from VAT and expat exodus
• Savola Group has recorded marginal top-line growth mainly due to growth in the
Foods segment (+17%) that was offset by a decline in the Retail segment (-12%)
Revenues • Growth in foods was largely driven by KSA and Egypt as a result of increase in volumes
and pricing, while retail sales decreased compared to last year’s high base where food
stocking behavior emerged as the pandemic and curfews materialized
• The Group recorded EBTIDA of SAR 641 mn in Q1 2021
Profitability • Net Income reached SAR 154 mn in Q1 2021 compared to SAR 173 mn last year, on
adjusted basis, net income for Q1 2021 is SAR 177 mn
9GROUP – CONSOLIDATED FINANCIAL HIGHLIGHTS
Margin
SAR in millions Q1-19 Q1-20 Q1-21 Q1-19 Q1-20 Q1-21
+7% +13%
Sales 5,214 5,923 5,954 EBITDA 693 641
505
9.7% 11.7% 10.8%
+7%
Excluding
one-offs*
1,223 1,212 173 154
Gross Profit 1,065 Net Income
6
20.4% 20.6% 20.4% 0.1% 2.9% 2.6%*
*In Q1 2021, Savola Foods provisioned SAR 23 million in emerging markets Note: numbers are rounded
10GROUP – REVENUE MIX, NET DEBT & CAPEX
SAR in millions Revenue by Business Revenue by Geography
Q1-20 Q1-21 Q1-20 Q1-21
5% 5%
3% 2% 5% 11% 4% 11%
41% 10%
48% 17%
45%
51% 69%
74%
Food Processing Retail Food Services Frozen Food KSA Egypt Central Asia Others
YoY Growth +17% -12% +4% -9% -7% +64% -29% 5%
Loans and Net Debt* CAPEX
Q1-20 Q1-21 Q1-20 Q1-21
Net Debt 6,007 6,405
3%
Total Loans 7,282 7,571 84 90 18%
40%
6,276 5,955
39%
1,006 1,616
KSA Non-KSA Foods Retail Food Services Frozen Food
*Net debt excludes lease liabilities Note: numbers are rounded
111. Group Overview & Business Model
2. Group Key Financial Highlights
3. Performance by Segment
12Panda Retail Company
13RETAIL - HIGHLIGHTS
• In Q1 2021, the business witnessed a decline in top-line compared to last year which
Key Highlights was abnormally high due to food stocking behavior exhibited in Q1 2020
• 2021 performance was further impacted by higher VAT, expat exodus and downtrading
Store Count • Store count maintained at 205 stores by Q1 2021, including 4 stores in Egypt
• The segment recorded revenues of SAR 2.7 bn during Q1 2021, 12% lower than last
year, given the high base of March. Revenues are about 9% higher than 2019 levels
Revenues
• In Q1 2021, Panda reported negative LFL mainly driven by lower transactions and – to a
lesser extent – lower basket size compared to last year
• Q1 2021, reported EBITDA of SAR 163 mn, compared to SAR 240 mn last year
Profitability
• Reported losses of SAR 52 mn in Q1 2021, compared to profits of SAR 11 mn last year
14RETAIL – FINANCIAL HIGHLIGHTS
Margin
SAR in millions Q1-19 Q1-20 Q1-21 Q1-19 Q1-20 Q1-21
+57%
+4%
COVID-19
impact
240
3,099 163
Sales 2,497 2,720 EBITDA 66
2.6% 7.8% 6.0%
+4%
11
Gross Profit 705 606 Net Income (52)
557 (193)
22.3% 22.8% 22.3% NA 0.3% NA
Note: numbers are rounded
15RETAIL – NUMBER OF STORES
Super Hyper
Store converted to
fulfillment center
1
145 145 145 60 60 60
(1)
Dec Additions Closures Dec Additions Closures Mar Dec Additions Closures Dec Additions Closures Mar
2019 2020 2021 2019 2020 2021
Total
Dec-19 Dec-20 Mar-20
Selling Area Selling Area Driven by resizing and space optimization Selling Area
634,399 m2 628,189 m2 618,772 m2
205 1 205 205
(1)
Dec Additions Closures Dec Additions Closures Mar
2019 2020 2021
Note: numbers are rounded
16PANDA TURNAROUND UPDATE (1/2)
• Panda is expected to complete the implementation of its turnaround journey by end of 2021
• The key focus is to be the destination for fresh and improve assortment mix for higher visits and basket size through improvement of core
retail operations
Key Focus Areas for 2021 Objectives
1
Fresh Model Reinvention
Customer Count and Basket • Re-invent the fresh model to be the undisputed leader in the category
Category Management
Size Maximization
• Implement data enabled, customer centric category management core capabilities
Shelf Availability • Ensure robust core capabilities to secure consistent, best-in-class shelf availability
2 • Relevant and vibrant footprint network with national coverage to fulfill purpose,
Brick and Mortar Footprint
Market Share and Share of positioning, and be a conduit to sustainably secure market share leadership
Wallet Maximization Omnichannel • Development of a cross-channel ecosystem to allow shoppers to buy the groceries
they want, when they want it and how they want it through a cohesive and innovative
3 omnichannel strategy
In-Store Human Capital Model
Direct and Indirect Costs
Optimization Management Culture
17PANDA TURNAROUND UPDATE (2/2)
Panda has continued to show positive indicators in its turnaround journey across various financial and operational metrics
Sales per sqm (SAR’000/sqm) Sales mix by category (% of sales)
GET: General Merchandise, Electronics and Textile
18.4 9%
GET
15%
Grocery Non-food 17%
16.1 16% 2020
15.5 15.5
Fresh 24% 2017
21%
Grocery Food 51%
2017 2018 2019 2020 48%
Gross margin (% of sales) OPEX (SARmn | % of sales)
3,120
2,962
23.9% 24.4%
20.8% 2,691 2,648
20.0%
Regulatory Fees
26.8% 26.6%
25.2%
22.8%
2017 2018 2019 2020 2017 2018 2019 2020
1) Sales and gross margins presented are as per latest reported figures and includes Pandati sales and promotional income for 2017-2018, 2) sales per sqm is based on average selling space, 3) OPEX refers to selling & distribution and
administrative expenses per audited format that excludes impairments, 4) OPEX for 2019 and 2020 is adjusted for IFRS-16 rent reversal and right of use deprecation expense for comparison purposes, 5) numbers are rounded 18Savola Foods Company
19FOODS - HIGHLIGHTS
• The performance of our foods segment improved over last year from a topline and
Key Highlights
bottom-line perspective mainly driven by our edible oil segment
• Volume has grown by ~9% to 965 KMT in Q1 2021, primarily driven by Egypt and KSA
Volume • Oil volumes grew by ~8% while Sugar and Pasta volumes improved by ~10% and 6%,
respectively.
• Q1 2021 revenues are 17% higher than last year, reaching over SAR 2.9 bn compared
Revenues
to SAR 2.5 bn last year primarily due to growth in volumes and pricing
• EBITDA improved to SAR 261 mn in Q1 2021 compared to SAR 221 mn last year
Profitability
• Q1 2021 net income is at SAR 104 mn, compared to SAR 73 mn last year
20FOODS – SELECTED COMMODITY SNAPSHOTS (FAO)
FAO Food Price Index (rebased)* FAO Vegetable Oils Index (rebased)** FAO Sugar Index (rebased)***
198 130
130
127
190 125
125
180 120 121
120 170 115
160 110
115
150 105
110
140 100
105 130 95
120 90
100
110 85
95
100 80
90 90 75
Jan-19 Jul-19 Jan-20 Jul-20 Jan-21 Jan-19 Jul-19 Jan-20 Jul-20 Jan-21 Jan-19 Jul-19 Jan-20 Jul-20 Jan-21
• The increase marked the tenth consecutive • The persistent strength of the index was driven by
monthly rise in the value of the FFPI to its highest higher values of palm, soy, rape and sunflower oils. • Sugar quotations remained, however, more than
level since June 2014. 30 percent above their levels in the corresponding
• International palm oil prices registered a tenth
• The increase was led by strong gains in vegetable consecutive monthly increase, as lingering concerns period of last year, underpinned by concerns over
oils, meat and dairy sub-indices, while those of over tight inventory levels in major exporting tight global supplies in 2020/21.
cereals and sugar subsided. countries coincided with a gradual import recovery.
*Food Price Index consist of average of 5 commodity group price indices weighted with average export shares of the groups Note: FAO data | 8th April 2021, numbers are rounded
21
**Vegetable Oil Price Index consists of an average of 10 different oils weighted with average export trade shares of each oil product ***Sugar Price Index is an index form of the International Sugar Agreement pricesFOODS – FINANCIAL HIGHLIGHTS
Margin
SAR in millions Q1-19 Q1-20 Q1-21 Q1-19 Q1-20 Q1-21
+10%
+12%
2,476 2,906
Sales 2,408 EBITDA 261
207 221
8.6% 8.9% 9.0%
Excluding
+13% one-offs**
Excluding
one-offs*
Gross Profit 375 466 Net Income 112 104
367 73
15.2% 15.2% 16.0% 4.7%* 3.0% 3.6%**
*In Q1 2019, Savola Foods recorded non-operational income of about SAR 41 million due to reversal of accruals Note: numbers are rounded
**In Q1 2021, Savola Foods provisioned SAR 23 million in emerging markets 22FOODS – OIL SEGMENT ANALYSIS
SAR in millions Volume (MT ‘000) Revenues
Q1-19 Q1-20 Q1-21 Q1-19 Q1-20 Q1-21
+12%
CAGR (’19-’21) 483 CAGR (’19-’21)
6% 1,927 Morocco +21%
Morocco +11% 448 +13%
5% 6% 6% Sudan +67%
Sudan +45%
388 5% 7% 1,654 8% Algeria -15%
Algeria -9%
6% 12% 7% 1,509 6% 6%
Turkey -9% 4% YoY Growth Turkey +6%
3% YoY Growth
6% (Q1 ’21 vs. ’20)
Central Asia +8%
(Q1 ’21 vs. ’20)
3% 11% 11% Central Asia -15%
11% 10% Central Asia
23% 11% Egypt +56%
Egypt +34% 10% Central Asia 10%
12% KSA +1%
KSA +8% 13%
27%
24% 17%
18%
27% 33%
Egypt Egypt
18% 19% 17% 21%
KSA
KSA
27% 23% 25% 32% 26%
28%
Gross Profit / Ton (SAR)
667 616 704
Note: numbers are rounded
23FOODS – SUGAR SEGMENT ANALYSIS
SAR in millions Volume (MT ‘000) Revenues
Q1-19 Q1-20 Q1-21 Q1-19 Q1-20 Q1-21
CAGR (’19-’21) 0%
CAGR (’19-’21)
+6% YoY Growth 381 712 YoY Growth 714
Egypt +31% (Q1 ’21 vs. ’20) (Q1 ’21 vs. ’20)
Egypt +30%
KSA +2%
338 346 Egypt 11% KSA -4%
18% 615 Egypt 19%
9%
12% 10%
KSA
89%
88% 91% 82% KSA 81%
90%
Gross Profit / Ton (SAR)
273 192 231
Note: Sugar volumes and revenues include only the contribution from our consolidated sugar operations (USC and ASC), and include the net volume and revenue from our KSA sugar distribution operations Note: numbers are rounded
24SAVOLA FOODS STRATEGY
• Health, convenience, and youth driven trends are the fastest-growing and future focus segments in our markets
• Savola Foods strategy will revolve around four key pillars, including anchoring and defending its existing core business,
disrupting the offering in the foodservice space, conquer new categories and betting on high-growth opportunities
1) Anchor:
1) Anchor 2) Disrupt 3) Conquer 4) Bet
• Growing today’s businesses • Capitalize mainly on • Entering large, established categories in the • Placing VC investment on
via focused line extensions increasing Foodservice region and disrupt them by targeting health, nascent, high-growth
spend due to secular trends convenience and youth via new product lines youth-focused categories
Edible oils
focusing on olive oil driving shift to convenience and innovative / targeted branding
Prioritized categories Indicative Criteria Snack Bars
Pasta & couscous (multiple snacks a day trend)
Chocolate confectionery Size
youth’s main source of carbs Product Line Expansion
(healthy & artisanal)
Alternative protein
Growth Potential
Seafood (reduced meat consumption)
Packaged cakes/pastries
ambient | ready-to-eat Geographical Expansion (nutritional and on-the-go)
EBIT margin
Sweet biscuits
✓ Expand existing brands, expand (replace breakfast) Presence
Digital presence
into new formats and occasions ✓ Alignment w/ trends
e-commerce Savory snacks
(fourth meal opportunity)
✓ Develop line extensions, health ✓ Competitive position
and wellness focus, functional Herbs & spices
benefits, sustainable packaging (youth love for flavors)Al Kabeer Group of Companies
26FROZEN FOOD - HIGHLIGHTS
• Frozen food segment continued to perform well and managed to maintain strong
Key Highlights performance in Saudi Arabia
• We continue to see preference and consumer demand for the category
• Reported revenues decreased by about 9% reaching SAR 175 mn in Q1 2020
compared to SAR 192 mn last year.
Revenues
• On a like for like basis, revenues decreased by about ~5% driven by pressure on the
lower gulf, while Saudi Arabia largely maintained 2020 levels
• EBITDA increased by 10% compared to last year, reaching SAR 29 mn from SAR 26 mn
last year
Profitability
• Q1 2021 net income registered at about SAR 22 mn, representing growth of about 8%
compared to last year, where net income reached SAR 20 mn in Q1 2020
27FROZEN FOOD – AL KABEER FINANCIAL HIGHLIGHTS
Margin
SAR in millions Q1-19 Q1-20 Q1-21 Q1-19 Q1-20 Q1-21
+17%
+11%
Impact of
IFRS15
Sales 192 175 EBITDA 26 29
129 23
18.2% 13.6% 16.4%
+13% +11%
66 20 22
Gross Profit 61 Net Income 18
48
37.3% 34.5% 34.8% 14.0% 10.5% 12.4%
Note: numbers are rounded
28AL KABEER’S STRATEGY
• Al Kabeer will continue building up on healthy growth trends in the category and will focus on key initiatives that were defined in view of
consumer intelligence and market dynamics to drive growth in top and bottom-lines
• Additionally, in-organic growth opportunities will be pursed in attractive target or subcategories as part of a roll-up strategy
Route-to-market and
How to win
01 Improve Availability 02 Support Brand Equity 03
channel coverage
Revenue / Brand / SKU
04 New Product Development 05
Management
Category
Al Kabeer
Channel • Increase range in core in 5 years
Geography cateogries –
• Improve availability and service level
Al
Where to play
• Strengthen position in KSA in modern trade • Dynamically review product A large
Kabeer portfolio multi-
Today • Maintain leadership in UAE • Expand presence in traditional trade region
• Increase presence in other GCC • Develop new products tailored leader with
Establishe • Focus on profitable and growth- to targeted population a strong
markets
d GCC oriented foodservice opportunities portfolio of
player • Develop unique export • Assess new categories with brands
proposition growth potential
29Financial Summary
30FINANCIALS – Q1 2021
(all figures are in SAR millions)
Segment Wise Financials
Q1 2021 Q1 2020
Revenue Gross Profit EBIT Net Income EBITDA Revenue Gross Profit EBIT Net Income EBITDA
Food*
Oil-Mature Markets 1,539 299 130 71 154 1,305 242 126 78 146
Oil-Start-up Markets** 387 41 20 12 24 349 34 15 8 18
Total Oil 1,926 340 150 83 177 1,654 276 141 86 165
Sugar 714 88 47 19 68 615 67 21 (12) 41
Pasta 190 31 8 4 12 155 29 10 6 14
Emerging Categories*** 75
0 6
0 (0)
0 (2)
0 4
0 51 3 (4) (6) 1
Total Foods 2,906 466 205 104 261 2,476 375 168 73 221
Retail
KSA 2,688 599 6 (51) 160 3,071 700 72 14 239
Egypt 32 7 (0) (0) 3 28 5 (3) (3) 2
Total Retail 2,720 606 6 (52) 163 3,099 705 69 11 240
Herfy 310 82 34 25 75 297 77 35 25 78
Frozen Food 175 61 24 22 29 192 66 21 20 26
Real Estate - - 3 3 3 - - 3 3 3
Al Marai-Savola Share - - 128 128 128 - - 132 132 132
HQ/Elimination/Impairments (157) (3) (26) (75) (17) (140) (0) (20) (92) (8)
Total 5,954 1,212 373 154 641 5,923 1,223 408 173 693
Adjustments
Emerging markets provision 23
Adjusted Profit 177 173
* All the numbers are rounded for the purpose of presentation and have been represented under different categories
** Start-up markets include Algeria, Morocco and Sudan
*** Includes specialty fats, seafood, croissant...etc.
31INVESTOR RELATIONS APPLICATION
Views Savola Group share price,
charts and performance on the go
Savola Group Annual & Quarterly
figures
Savola Group News releases from
Tadawul
Annual/Quarterly Reports
accessible offline
http://www.myirapp.com/savola/
32Thank you www.savola.com 33
You can also read