ROAD SAFETY IN THE SOUTH-EAST ASIA REGION 2015 - World Health ...
←
→
Page content transcription
If your browser does not render page correctly, please read the page content below

ROAD SAFETY IN THE
                              SOUTH-EAST ASIA REGION
                                                2015

Final_Final_16006_Regional Fact sheet on Road Safety_SEAR.indd 1   26/02/2016 14:38
© World Health Organization 2016

          All rights reserved. Requests for publications, or for permission to reproduce or translate WHO publications – whether for sale or for noncommercial distribution – can be obtained
          from SEARO Library, World Health Organization, Regional Office for South-East Asia, Indraprastha Estate, Mahatma Gandhi Marg, New Delhi 110 002, India (fax: +91 11 23370197;
          e-mail: searolibrary@who.int).

          The designations employed and the presentation of the material in this publication do not imply the expression of any opinion whatsoever on the part of the World Health Organization
          concerning the legal status of any country, territory, city or area or of its authorities, or concerning the delimitation of its frontiers or boundaries. Dotted lines on maps represent approximate
          border lines for which there may not yet be full agreement.

          The mention of specific companies or of certain manufacturers’ products does not imply that they are endorsed or recommended by the World Health Organization in preference to
          others of a similar nature that are not mentioned. Errors and omissions excepted, the names of proprietary products are distinguished by initial capital letters.

          All reasonable precautions have been taken by the World Health Organization to verify the information contained in this publication. However, the published material is being distributed
          without warranty of any kind, either expressed or implied. The responsibility for th e interpretation and use of the material lies with the reader. In no event shall the World Health Organization
          be liable for damages arising from its use. This publication does not necessarily represent the decisions or policies of the World Health Organization.

          Cover photo: © Panos/Stuart Freedman

          Design and layout: L’IV Com Sàrl, Villars-sous-Yens, Switzerland.

          Printed in India.

Final_Final_16006_Regional Fact sheet on Road Safety_SEAR.indd 2                                                                                                                                                 26/02/2016 14:38
Contents
               Road safety in the South East Asia Region: key facts                                                                    2

               Background                                                                                                              3

               The Decade of Action for Road Safety and the Global status reports                                                      3

               Road safety and the Sustainable Development Goals (SDGs)                                                                4

               Methodology                                                                                                             4

               Findings                                                                                                                5
               The South East Asia Region contributes 25% of the total global road traffic deaths                                      5
               Countries need to strengthen road safety legislation                                                                    8
               Policymakers must give more attention to making vehicles and roads safer                                               11

               Conclusions and recommendations                                                                                        13

               Country profiles                                                                                                       14

                                                                                             ROAD SAFETY IN THE SOUTH-EAST ASIA REGION, 2015     1

Final_Final_16006_Regional Fact sheet on Road Safety_SEAR.indd 1                                                                        26/02/2016 14:38
Road safety in the South-East Asia
                                                                   Region: key facts
                                                                   • Road traffic injuries kill approximately 316 000 people each year in WHO’s South-
                                                                     East Asia Region. These deaths account for 25% of the global total of road traffic
                                                                     deaths.

                                                                   • The South-East Asia region has a road traffic death rate of 17.0 per 100 000
                                                                     population, compared to the global rate of 17.4. However, there is considerable
                                                                     variation within the region, with rates ranging from 3.5 in the Maldives to 36.2
                                                                     in Thailand.

                                                                   • Pedestrians, cyclists and motorcyclists (“vulnerable road users”) make up 50% of
                                                                     road traffic deaths in the region: in some countries this figure rises to over 80%.
                                                                     The safety needs of these groups must be addressed if a decline in the number
                                                                     of regional deaths is to be achieved.

                                                                   • Currently none of the 10 countries reported on in this Factsheet have national
                                                                     policies to separate vulnerable road users from high-speed traffic.

                                                                   • Legislation is a key strategy to improving road user behaviour but most countries
                                                                     in the region could do much more to bring their laws on key risk factors –
                                                                     speed, drink–driving, helmets, seat-belts and child restraints – into line with
                                                                     international best practice.

                                                                   • Enforcement of laws relating to the 5 key behavioural risk factors is weak across
                                                                     the region: strengthening enforcement is critical to realising the potential gains
                                                                     associated with passing strong laws.

                                                                   • Vehicle standards are a critical part of road safety but only 2 countries in the
                                                                     region currently apply any of the 7 priority international vehicle safety standards,
                                                                     while no country applies all of these 7 vehicle standards.

                                                                   • Improving infrastructure is an effective mechanism for reducing road traffic
                                                                     injuries. Six of the 10 participating countries require road safety audits for new
                                                                     roads, while 4 assess the safety of existing roads.

                                                                   • Improving post-crash care can help to reduce road traffic deaths and the severity
                                                                     of injuries. Currently only 6 countries in the region have an emergency access
                                                                     number, which can be important in activating an emergency response system.

                                                                   • The South-East Asia Region comprises a large proportion of global road deaths.
                                                                     Achieving the recently adopted Sustainable Development Goal on road safety
                                                                     – halving the global number of road traffic deaths and injuries by 2020 – means
                                                                     that countries in this region need to accelerate the pace at which they implement
                                                                     effective road safety measures.

   2      ROAD SAFETY IN THE SOUTH-EAST ASIA REGION, 2015

Final_Final_16006_Regional Fact sheet on Road Safety_SEAR.indd 2                                                                                            26/02/2016 14:38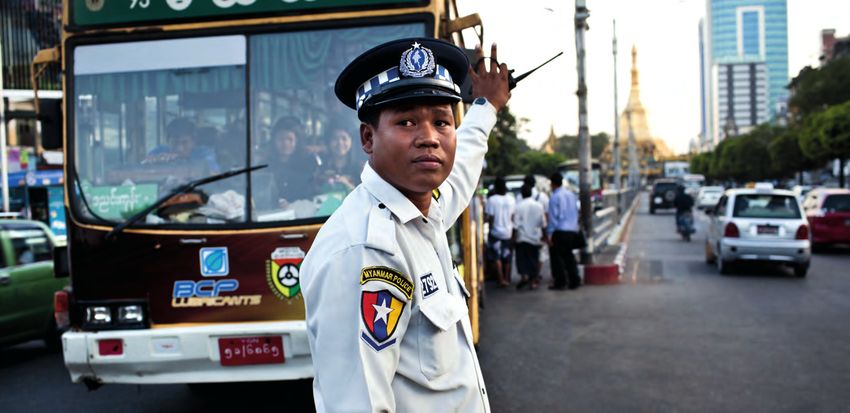
Background
               Globally, road traffic injuries claim more than 1.2 million lives each year and have
               a huge impact on health and development. They are the leading cause of death
               among young people aged between 15 and 29 years, and cost governments
               approximately 3% of GDP, but up to 5% in low- and middle-income countries.

               The rise in global road traffic deaths has been largely driven by the escalating
               death toll on roads in low- and middle-income countries – particularly in emerging
               economies where urbanization and motorization accompany rapid economic
               growth. In many of these countries, necessary infrastructural developments,
               policy changes and levels of enforcement have not kept pace with vehicle use. In
               contrast, many high-income countries have managed to sever the link between
               rising motorization and road traffic deaths, with some managing to dramatically
               reduce such deaths. These achievements are the cumulative result of making
               infrastructure safer, improving the safety of vehicles, and implementing a number
               of other interventions known to be effective at reducing road traffic injuries.
               Having good quality data to monitor the impact of these efforts is also critical to
               demonstrating their success.

               In addition to deaths on the roads, up to 50 million people incur non-fatal injuries
               each year as a result of road traffic crashes, while there are additional indirect
               health consequences that are associated with this growing epidemic. As vehicle
               ownership grows, many countries face the twin problems of traffic congestion
               and rising vehicle tailpipe emissions, resulting in higher rates of respiratory
               illness. Rising car ownership has also resulted in reduced physical activities such
               as walking and cycling, with associated negative health consequences.

               The Decade of Action for Road Safety
               and the Global status reports
               In response to this growing epidemic, in 2010 the UN General Assembly adopted
               Resolution 64/255 to establish the Decade of Action for Road Safety (2011–2020),
               the goal of which is to stabilize and reduce predicted levels of road traffic fatalities
               around the world. A Global Plan of Action provides the roadmap towards this goal,
               promoting proven, cost-effective solutions for making roads safer. The UN General
               Assembly Resolution 64/255 also called for regular monitoring of the impact of
               the Decade of Action through publishing the Global status report on road safety
               series. This report provides an assessment of the situation three years into the
               Decade. The objectives of this third report are to describe the road safety situation
               in all Member States; identify gaps in road safety in all Member States and thereby
               stimulate road safety action; and monitor countries’ progress in implementing
               measures identified in the Global Plan of Action.

                                                                                                   ROAD SAFETY IN THE SOUTH-EAST ASIA REGION, 2015     3

Final_Final_16006_Regional Fact sheet on Road Safety_SEAR.indd 3                                                                              26/02/2016 14:38
Road safety and the Sustainable
Development Goals (SDGs)
In September 2015 the United Nations launched the 2030 Agenda for Sustainable
Development – the development framework that replaces and builds on the
achievements of the Millennium Development Goals. Road safety was absent from
the Millennium Development Goals but road safety targets have been integrated
into the new 2030 Agenda. The SDG 3 target aims to halve the number of global
deaths and injuries from road traffic crashes by 2020, while SDG11 relates to
providing access to sustainable transport systems for all, improving road safety,
SUSTAINABLE and expanding public transport1.
DEVELOPMENT
GOAL 3 Methodology
Ensure healthy lives and
promote well-being for all Data were collected from each participating country through a multi sectoral group
at all ages. of road safety experts. Each expert completed a self-administered questionnaire
with information on key variables and collectively they agreed upon a single
3.6: By 2020, halve the number
dataset that best represented their individual country’s road safety situation. The
of global deaths and injuries
data were validated at the national and regional levels and officially cleared by
from road traffic accidents.
the respective governments. Fatality data, collected through the questionnaires,
were reviewed according to a set of criteria that determined how robust the data
were, and an estimation process was carried out accordingly. New elements in
this (third) Global status report on road safety were the comprehensive collection
of legislative documents from all participating countries and the collection of
data on vehicle standards. For more information on the methodology of these
components please see Explanatory Notes 1–3 in the main report.
Of the 11 countries that comprise WHO’s South-East Asia Region (SEAR),
10 countries (comprising 99% of the region’s population) took part in this survey.
Data for these 10 countries are reported in this factsheet. Data on legislation
and policies represent the country situation in 2014, while data on fatalities
and numbers of vehicles are for 2013, the most recent year for which data were
available.
1 See http://www.globalgoals.org/
4 ROAD SAFETY IN THE SOUTH-EAST ASIA REGION, 2015
Final_Final_16006_Regional Fact sheet on Road Safety_SEAR.indd 4 26/02/2016 14:38Findings
The South-East Asia Region contributes 25% of the
total global road traffic deaths
There are approximately 316 000 road traffic deaths each year that occur in the
South-East Asia Region, accounting for approximately 25% of the world’s road
traffic deaths. This represents a plateau in the number of deaths, from 315 000 in
2010 to 316 000 in 2013: this stabilisation is positive in that it takes place in the
context of increasing motorization and population growth in the region.
The region’s road traffic fatality rate, at 17.0 per 100 000 population, is below the
global rate of 17.4 (see Figure 1). However, there is considerable variation in fatality
rates within the region, ranging from 3.5 per 100 000 in the Maldives to 36.2 per
100 000 population in Thailand.
FIGURE 1
Road traffic fatalities per 100 000 population
40
36.2
35
Road traffic fatality rate per
30
100 000 population
25
20.3
20 17.4
16.6 16.6 17.0 17.0
15.1 15.3
15 13.6
10
5 3.5
0
Maldives Bangladesh Bhutan Indonesia India Timor-Leste Nepal Regional rate Sri Lanka Myanmar Thailand
© Panos/G.M.B. Akash
ROAD SAFETY IN THE SOUTH-EAST ASIA REGION, 2015 5
Final_Final_16006_Regional Fact sheet on Road Safety_SEAR.indd 5 26/02/2016 14:38Road traffic deaths among pedestrians, cyclists and
motorcyclists are intolerably high
Vulnerable road users, (pedestrians, cyclists and motorcyclist make up 50% of all
road traffic deaths in the region (see Figure 2).
FIGURE 2
Deaths by road user type, South-east Asia region
16%
34%
Car occupants
34% Motorized 2-3 wheelers
Cyclists
13%
Pedestrians
Other/unspecified
3%
However, this regional breakdown of deaths understates the overwhelming
burden of deaths among vulnerable road users in all countries except Bhutan
(where car occupants are the most affected). There is also much variation in the
group most affected: in Thailand, for example, 83% of road deaths are among
vulnerable road users (with motorcyclists comprising the bulk of these, at
73%), while in Bangladesh, the Maldives and Sri Lanka pedestrians account for
approximately a third of road traffic deaths (see Figure 3).
FIGURE 3
Distribution of road traffic deaths by type of road user1
Thailand
Sri Lanka
Myanmar
Maldives
Drivers/passengers of
Indonesia
motorized 2-3 wheelers
Cyclists India
Pedestrians
Drivers/paassengers of Bhutan
4-wheeled vehicles
Other/unspecified Bangladesh
I I I I I I
0% 20% 40% 60% 80% 100%
1 Data shown for the 8 countries for which this information was available. Data relate to 2013 or the most recent year for which
data were available.
6 ROAD SAFETY IN THE SOUTH-EAST ASIA REGION, 2015
Final_Final_16006_Regional Fact sheet on Road Safety_SEAR.indd 6 26/02/2016 14:38Data on road traffic fatalities are not robust in many
countries
Data on road traffic fatalities are essential for monitoring country-level trends,
tailoring prevention efforts, assessing progress and comparing the scale of road
traffic deaths relative to deaths from other causes.
Vital registration data fulfil these needs best as they are a record of all officially
registered deaths and are not time-limited. For example, a person who dies from
injury complications a few months after a road traffic crash may or may not be
issued with a death certificate showing the road traffic injury as the contributing
cause of death. Such deaths will therefore not be coded as road traffic death,
leading to distortions in the overall official numbers. In addition, not all countries
have vital registration systems that provide cause of death information: where
countries do not have vital registration data of good quality, police data is often
the best source of information on road traffic fatalities. However, countries still
have no consistent definition of a road traffic death for use in police databases; of
the 10 participating SEAR countries, 5 now use a 30-day definition for their official
road traffic fatality data. Furthermore police data are underreported in many
countries. The number of reported deaths in the SEA Region is 188 819, relative
to the estimated 316 000, suggesting a that underreporting remains a major issue
among the region’s official road traffic death data sources.
Getting the injured to quality care
In high-income countries, delivering emergency care at the scene of the collision
and getting crash victims quickly to a health-care facility is often performed by
professionally trained providers using sophisticated equipment and designated
vehicles. However, in low- and middle-income countries, laypeople such as
community leaders, police, or taxi drivers who are trained in basic injury care and ONLY 6
the coordination of transportation to a health-care facility can also fulfil these roles.
COUNTRIES IN
The most efficient way to activate an emergency response is through a universal, THE REGION
centralized access number with a central dispatch system. However, when have an emergency access
universal access numbers are unavailable (under development or during disasters), number, which can be
partial measures to facilitate access, including simple mechanisms to advise important in activating an
patients on the nearest facility and transport options, such as public broadcasts, emergency response system.
mobile phone applications, electronic billboards or other mechanisms that provide
real-time updates on available care resources are utilised.
In the SEA region, 6 countries have an emergency access number, while 2 countries
have multiple numbers and another 2 have no such numbers.
Health-care staff must be trained in emergency care
Once at a health-care facility, a systematic clinical approach to the management of
road traffic victim’s injuries can improve outcomes. Hospitals in low- and middle-
income countries are often staffed by general practitioners and nurses who treat
a high volume of trauma patients every day, frequently without the support of
dedicated trauma care training. Implementing accredited courses on trauma care
for doctors and nurses in hospitals receiving a high-volume of trauma victims is
an effective way of improving this care. In this assessment, while 9 out of 10 of the
region’s participating countries report having some type of emergency specialty
for doctors, only 4 have equivalent programmes for nurses.
ROAD SAFETY IN THE SOUTH-EAST ASIA REGION, 2015 7
Final_Final_16006_Regional Fact sheet on Road Safety_SEAR.indd 7 26/02/2016 14:38Countries need to strengthen road safety legislation
Road safety laws improve road user behaviour and can be an effective tool in
reducing road traffic crashes, injuries and deaths. The most positive changes to
road user behaviour happen when road safety legislation is supported by strong
and sustained enforcement, and where the public is made aware of the reasons
behind the new law and the consequences of noncompliance.
This section reports on an assessment of countries’ current legislation to meet five
key behavioural risk factors for road traffic injuries: speed, drink–driving, failure to
use motorcycle helmets, seat-belts and child restraints. There is a strong evidence
base showing the positive impacts that legislation on each of these risk factors
can have on reducing crashes, injuries and deaths. A summary of the countries’
legislation on the 5 risk factors is shown in Table 1.
TABLE 1
Summary of legislation on key risk factors
Speed Drink–driving Helmets Seat-belts Child restraints
Bangladesh
Bhutan
India
Indonesia
Maldives
Myanmar
Nepal
Sri Lanka
Thailand
Timor-Leste
Meets criteria for best practice
Meets some of criteria for best practice
No law /law doesn’t meet best practice
Legislation set at subnational level
Speed
As average traffic speed increases, so too does the likelihood of a crash. If a crash
does happen, the risk of death and serious injury is greater at higher speeds,
especially for pedestrians, cyclists and motorcyclists.
Setting and enforcing national speed limits is an important step in reducing speed.
Of the 10 participating countries, 5 set maximum urban speed limits of less than or
equal to 50 km/h, in line with best practice. Given that these urban areas usually
involve a high concentration of pedestrians and cyclists, speeds above 50 km/h
would be unsafe.
Rigorous enforcement of speed limits is essential to make them truly effective.
None of the participating countries rate their enforcement of speed laws as “good”
(8 or above on a scale of 0 to 10), suggesting that without ongoing and visible
enforcement of speed limit legislation, the potential impact of speed legislation
to save lives in the region remains vastly unattained.
8 ROAD SAFETY IN THE SOUTH-EAST ASIA REGION, 2015
Final_Final_16006_Regional Fact sheet on Road Safety_SEAR.indd 8 26/02/2016 14:38It is important that local authorities not only have the legal authority to reduce
national limits, but also to manage local speeds according to particular road
situations and in conjunction with other traffic calming or speed management
policies. However, this survey shows that only 4 of the 10 participating countries
allow local authorities to reduce national speed limits.
Only 2 countries in the region (Bhutan and Myanmar) meet both legislative criteria
for best practice on urban speed management – a national urban maximum
speed limit of 50 km/h, and local authority power to reduce this limit to ensure
safe speeds locally (see Figure 4).
Drink–driving
Drink–driving increases the chance of a road traffic crash, as well as the likelihood
that death or serious injury will result. Drinking and driving is also associated with
other high-risk road use behaviours such as speeding or not using seat-belts.
Young and novice drivers are at a much-increased risk of road traffic crashes when
under the influence of alcohol compared to older and more experienced drivers.
Drink–driving legislation, accompanied by visible, rigorous and rapid enforcement
following enactment, is an effective means of reducing alcohol-related crashes.
WHO recommends that countries implement a drink–driving law based on blood
alcohol concentration (BAC) limits (or or equivalent breath alcohol concentrations)
of 0.05 g/dl for the general population. Laws that establish lower BAC limits
(≤0.02 g/dl) for young and novice drivers can lead to reductions in the number of
crashes involving young people. However, only India, Thailand and Timor Leste
have a BAC of less than or equal to 0.05 g/dl, while, Bhutan is the only country in
the region to have a lower limit for young/novice drivers. No country meets both
criteria considered necessary for best practice (see Figure 4). Enforcement of
existing laws is also weak, with only 1 country rating their enforcement as “good”.
© Panos/Patrick Brown
ROAD SAFETY IN THE SOUTH-EAST ASIA REGION, 2015 9
Final_Final_16006_Regional Fact sheet on Road Safety_SEAR.indd 9 26/02/2016 14:38Motorcycle helmets
Motorcyclists are at an increased risk because they are unprotected and often
share the traffic space with fast-moving cars, buses and trucks, and because they
are less visible. In addition, their lack of physical protection makes them vulnerable
to injury. Injuries to the head and neck are the main cause of death, severe injury
and disability among motorcyclists.
Wearing a motorcycle helmet can reduce the risk of death by almost 40% and the
risk of severe injury by approximately 70%. Effective enforcement of motorcycle
helmet laws can increase helmet-wearing rates and thereby reduce head injuries.
ONLY 3 The effectiveness of national helmet legislation in reducing injuries also depends
COUNTRIES IN on the quality of helmets worn: countries laws should specify that helmets worn
meet an international or national standard to ensure their quality.
THE REGION
have helmet laws that meet best Only 4 countries in the region have national helmet laws that apply to all drivers
practice and apply a helmet and passengers, all road types and all engine types, and require the helmet to
standard. be properly fastened, in line with best practice (see Figure 4). Most countries in
the region do have laws that require helmets to meet a national or international
standard.
However, only 3 countries – Bhutan, Thailand and Timor Leste – representing
69 million people, meet both these criteria, in line with best practice. That is, they
have helmet laws that meet best practice and apply a helmet standard. Three of
the participating countries rate their enforcement of helmet laws as good.
Seat-belts
Wearing a seat-belt reduces the risk of a fatality among drivers and front-seat
occupants by 45–50%, and up to about 25% among rear-seat occupants. Seat-belt
legislation, when combined with strong and sustained enforcement, is an effective
mechanism for increasing seat-belt wearing rates.
While 8 of the 10 participating countries have some type of national seat-belt
law in place, in many of these countries the law is weak, for example, the law is
only applied inside or in the periphery of cities, weakening its potential to save
lives. Currently only 3 countries in the region, Bhutan, India and Timor Leste, have
comprehensive seat-belt laws that apply to both front and rear seat passengers at
all times (see Figure 4), while enforcement across the region needs improvement
– with only 2 countries rating their enforcement as “good” .
Child restraints
Children in appropriate restraint are significantly less likely to be killed or injured
than unrestrained children, and are also less likely to be killed or injured than
children using adult seat-belts. Furthermore, young children are safer sitting in
the rear seat than in the front seat. Only Timor- Leste has laws in line with best
practice with regard to child restraints, specifically that restricts children under a
certain age from sitting in the front and have a child restraint law based on age,
weight and-or height (see Table 1).
10 ROAD SAFETY IN THE SOUTH-EAST ASIA REGION, 2015
Final_Final_16006_Regional Fact sheet on Road Safety_SEAR.indd 10 26/02/2016 14:38Policymakers must give more attention to making
vehicles and roads safer
Vehicle safety standards
Safe vehicles play an important role in averting a crash and reducing the likelihood
of serious consequences in the event of a crash. At the international level,
there are efforts to harmonize the different national systems of regulations,
ultimately facilitating the roll-out of best practice and making practices such
as de-specification of safety features more difficult. The UN World Forum for
Harmonization of Vehicle Regulations is the primary global body responsible for
the development of passenger car safety standards and its regulations provide a NO COUNTRY
legal framework covering a range of vehicle standards for UN Member States to
apply voluntarily.
IN THE REGION
applies all 7 priority vehicle
safety standards.
There are a set of 7 international standards that are increasingly accepted as basic
minimum standards for vehicle manufacture/assembly for passenger vehicles.
Rapid motorization in low- and middle-income countries/areas, where the risk
of a road traffic crash is highest, and the increasing production of vehicles that
is taking place in these emerging economies, means there is an urgent need for
these priority vehicle standards to be implemented globally.
India requires 2 of the 7 priority standards, and Thailand applies one. No other
countries in the region require any of these standards to be met. This suggests
that there is considerable life-saving potential for these priority standards to be
rolled out across the region that has yet to be tapped.
© Panos/G.M.B. Akash
ROAD SAFETY IN THE SOUTH-EAST ASIA REGION, 2015 11
Final_Final_16006_Regional Fact sheet on Road Safety_SEAR.indd 11 26/02/2016 14:38Making roads safer
Road infrastructure has traditionally maximized mobility and economic efficiency
at the expense of safety, particularly for non-motorized road users who are the
most vulnerable. Indeed, as motorization increases worldwide, walking and
cycling have become less common and more dangerous in many countries. The
traffic mix in many countries means that pedestrians and cyclists share the road
with high-speed vehicles, forcing them to negotiate dangerous situations and
fast-moving traffic.
In many industrialized countries these changes are already taking place, generally
at a local level where communities have been involved promoting safe public
transport and non-motorized means of transport. Measures to promote walking
and cycling are also in line with other global moves to fight obesity and reduce
noncommunicable diseases (such as heart disease, diabetes) and improve the
quality of urban life. These changes are more pertinent than ever for low- and
middle-income countries.
This report found that 3 countries in the region have policies to promote walking
and cycling, but if these strategies are not accompanied by other measures – such
as effective speed management and the provision of pedestrian and cycling safety
measures – they could actually lead to increases in road traffic injuries.
A key strategy for achieving a safe traffic system for pedestrians and cyclists is to
separate these different kinds of road use, eliminating conflicts between high-
speed and vulnerable road users. Safety benefits of measures such as building
separate cycle lanes. Separating road users is particularly relevant for the countries
with high proportions of motorcyclists in the South-East Asia Region. Yet none
of the countries in the region have national policies to separate vulnerable road
users from high- speed traffic, although 3 have policies at the subnational level.
Safe road systems consider the needs of all road users
Improving road infrastructure is a key mechanism for making roads safer.
Many high-performing countries have made significant investments in safer
infrastructure. These include designing safer new road projects but also upgrading
existing roads with proven interventions. Action across both these areas has
contributed to declines in road traffic deaths in these countries.
Rapid urbanization, economic growth and the need for improved mobility have
led to increased motorization in many low- and middle-income countries, but
road infrastructure has not kept pace. This means that poor roads are the norm
in many of the countries where the risk of road traffic death is highest, and are
often built without sufficient planning to take into consideration the safety needs
of vulnerable road users and the communities through which these roads pass
Decisions made at the design stage of a project can have a significant impact on
the level of death and injury of the road. Specifying safety standards and acting on
findings of a road safety design audit can all identify if further design modifications
can increase safety. Currently 6 countries in the region require some type of road
safety audit on new roads, although these vary greatly in what they cover, and thus
in quality. Existing road infrastructure should also be regularly assessed for safety,
with a focus on roads with the highest crash risk: 4 countries currently assess parts
of existing road safety networks.
12 ROAD SAFETY IN THE SOUTH-EAST ASIA REGION, 2015
Final_Final_16006_Regional Fact sheet on Road Safety_SEAR.indd 12 26/02/2016 14:38Conclusions and recommendations
• There are approximately 316 000 deaths each year on the roads in South-East
Asia, making road safety a major public health issue in the region. While the
region has an overall road traffic fatality rate of 17.0 per 100 000 population,
lower than the global rate of 17.4, this masks considerable variation in the
situation among different member states.
• This regional summary highlights a number of areas in which progress needs to
be made. Promulgating and enforcing laws based on best practice that relate
to key behavioural risk factors is essential to realizing such change. But this
factsheet shows that most countries in the region have multiple areas of their
legislation that need to be improved. The data presented here also suggest that
lack of enforcement is undermining the potential of existing road safety laws to
reduce injuries and deaths.
• Half of all the road traffic deaths in the region occur among pedestrians, cyclists
and motorcyclists. Making the region’s roads safer will not be possible unless
the needs of these road users are considered in all approaches to road safety –
including the way roads are built and the way vehicles are manufactured.
• The factsheet shows no country in the region applies the 7 priority vehicle
safety standards, despite the fact that some of the region’s middle-income
countries that are increasingly becoming major car manufacturers. Making
cars safer does not only benefit car occupants but is important for avoiding
crashes and mitigating the consequences of crashes that involve vulnerable
road users. Governments must urgently sign up to the minimum international
vehicle standards as requirements for manufacturers and assemblers, and limit
the importing and sale of sub-standard vehicles in their countries.
• The factsheet also highlights that countries need to do more to ensure that
road infrastructure is safe. Road safety audits should be conducted on both
new and existing roads, assessing the safety as it relates to the needs of all road
users, including pedestrians and cyclists. Making walking and cycling safer will
also have other positive co-benefits if these non-motorized forms of transport
become more popular, including more physical exercise, reduced emissions,
and the health benefits associated with such changes.
• As well as preventing crashes the report stresses the role that post-crash care
can make in mitigating the consequences of road traffic crashes. Interventions
that can improve access to care as well as the quality of care administered at
health facilities can have a major impact on outcomes.
• The number of road traffic deaths that occur each year in the South-East Asia
For more information on the
region has stabilised over the past 3 years. While this is positive news in the
methodology and references
context of increasing motorization and population growth, this progress is too
please see the global report at
little, and too slow. If the international road safety targets set for the Sustainable
www.who.int/violence_injury_
Development Goals – a halving of deaths and injuries by 2020 – are to be met,
prevention/road_safety_
then strong political will and rapid action is needed by governments within the
status/2015/en/
South-East Asia Region.
ROAD SAFETY IN THE SOUTH-EAST ASIA REGION, 2015 13
Final_Final_16006_Regional Fact sheet on Road Safety_SEAR.indd 13 26/02/2016 14:3814
Country profiles
Bangladesh • Bhutan • India • Indonesia • Maldives • Myanmar • Nepal • Sri Lanka • Thaiand • Timor-Leste
Final_Final_16006_Regional Fact sheet on Road Safety_SEAR.indd 14
ROAD SAFETY IN THE SOUTH-EAST ASIA REGION, 2015
© Panos/Qilai Shen
26/02/2016 14:38BANGLADESH
Population: 156 594 962 • Income group: Low • Gross national income per capita: US$ 1 010
INSTITUTIONAL FRAMEWORK SAFER ROAD USERS
Lead agency National Road Safety Council (NRSC) National speed limit law Yes
Funded in national budget No Max urban speed limit No
National road safety strategy Yes Max rural speed limit ~112 km/h
Funding to implement strategy Partially funded Max motorway speed limit No
Fatality reduction target 50% (2011–2020) Local authorities can modify limits No
Enforcement 0 1 2 4 5 6 7 8 9 10
SAFER ROADS AND MOBILITY National drink–driving law Yesd,e
Formal audits required for new road construction projects Yes BAC limit – general population —
Regular inspections of existing road infrastructure Yes BAC limit – young or novice drivers —
Policies to promote walking or cycling No Random breath testing carried out No
Policies to encourage investment in public transport Yes Enforcement 0 1 3 4 5 6 7 8 9 10
Policies to separate road users and protect VRUs No % road traffic deaths involving alcohol —
National motorcycle helmet law Yes
SAFER VEHICLES Applies to drivers and passengers Yes
Total registered vehicles for 2014 2 088 566 Law requires helmet to be fastened No
Cars and 4-wheeled light vehicles 547 423 Law refers to helmet standard Yes
Motorized 2- and 3-wheelers 1 336 339 Enforcement 0 1 2 3 5 6 7 8 9 10
Heavy trucks 141 850 Helmet wearing rate —
Buses 59 500 National seat-belt law No
Other 3 454 Applies to front and rear seat occupants —
Vehicle standards applieda Enforcement —
Frontal impact standard No Seat-belt wearing rate —
Electronic stability control No National child restraint law No
Legislative review conducted by WHO. Vehicle safety data from UNECE WP29. Other data collected by questionnaire and cleared by National Institute of Traumatology and Orthopaedic Rehabilitation (NITOR).
Pedestrian protection No Restrictions on children sitting in front seat No
a
UNECE WP29.
Child restraint law based on —
Enforcement —
POST-CRASH CARE
% children using child restraints —
Emergency room injury surveillance system No
None National law on mobile phone use while driving No
Emergency access telephone numbers
— Law prohibits hand-held mobile phone use —
Permanently disabled due to road traffic crash
Law also applies to hands-free phones —
DATA National drug-driving law Yes
d
Not based on BAC.
Reported road traffic fatalities (2012) 2 538b (57% M, 17% F) e
Alcohol consumption legally prohibited.
WHO estimated road traffic fatalities 21 316 (95%CI 17 349–25 283)
WHO estimated rate per 100 000 population 13.6
Estimated GDP lost due to road traffic crashes 1.6%c
b
Police First Information Report (FIR). Defined as died at scene of crash.
c
Transport Research Laboratory, UK (data from 2003).
DEATHS BY ROAD USER CATEGORY TRENDS IN REPORTED ROAD TRAFFIC DEATHS
Drivers/passengers
buses (8%)
3
Drivers 4-wheeled
Drivers/passengers cars and light
heavy trucks (6%) vehicles (13%)
2.5
Deaths per 100 000 population
2
1.5
Passengers 4-wheeled
© Panos/Qilai Shen
cars and light vehicles
(28%) 1
Pedestrians (32%)
0.5
0
Riders motorized 2- | | | | | | | | | |
Cyclists (2%) or 3-wheelers (11%)
2003 2004 2005 2006 2007 2008 2009 2010 2011 2012
Source: Road Transport Authority Annual Report (data from 2012). Source: Road Transport Authority Annual Report (data from 2012).
ROAD SAFETY IN THE SOUTH-EAST ASIA REGION, 2015 1
15
Final_Final_16006_Regional Fact sheet on Road Safety_SEAR.indd 15 26/02/2016 14:38BHUTAN
Population: 753 947 • Income group: Middle • Gross national income per capita: US$ 2 330
INSTITUTIONAL FRAMEWORK SAFER ROAD USERS
Lead agency Road Safety and Transport Authority (RSTA) National speed limit law Yes
Funded in national budget Yes Max urban speed limit 30 km/h
National road safety strategy Yes Max rural speed limit 50 km/h
Funding to implement strategy Partially funded Max motorway speed limit 50 km/h
Fatality reduction target Less than 10 deaths per 10 000 vehicles (2011–2020) Local authorities can modify limits Yes
Enforcement 0 1 2 3 4 6 7 8 9 10
SAFER ROADS AND MOBILITY National drink–driving law Yes
Formal audits required for new road construction projects No BAC limit – general population ≤ 0.08 g/dl
Regular inspections of existing road infrastructure No BAC limit – young or novice drivers 0.00 g/dl
Policies to promote walking or cycling Yes Random breath testing carried out Yes
Policies to encourage investment in public transport Yes Enforcement 0 1 2 3 4 6 7 8 9 10
Policies to separate road users and protect VRUs No % road traffic deaths involving alcohol —
National motorcycle helmet law Yes
SAFER VEHICLES Applies to drivers and passengers Yes
Total registered vehicles for 2014 68 173 Law requires helmet to be fastened Yes
Cars and 4-wheeled light vehicles 46 575 Law refers to helmet standard Yes
Motorized 2- and 3-wheelers 9 758 Enforcement 0123456789
Heavy trucks 9 397 Helmet wearing rate —
Buses 475 National seat-belt law Yes
Other 1 968 Applies to front and rear seat occupants Yes
Vehicle standards applieda Enforcement 0 1 2 4 5 6 7 8 9 10
Frontal impact standard No Seat-belt wearing rate —
Electronic stability control No National child restraint law No
Pedestrian protection No Restrictions on children sitting in front seat No
a
UNECE WP29.
Child restraint law based on —
Enforcement —
POST-CRASH CARE
% children using child restraints —
Emergency room injury surveillance system No
National law on mobile phone use while driving Yes
Legislative review conducted by WHO. Vehicle safety data from UNECE WP29. Other data collected by questionnaire and cleared by Ministry of Information and Communication.
Emergency access telephone numbers 112
— Law prohibits hand-held mobile phone use Yes
Permanently disabled due to road traffic crash
Law also applies to hands-free phones No
DATA National drug-driving law Yes
Reported road traffic fatalities (2013) 59b (76% M, 24% F)
WHO estimated road traffic fatalities 114 (95%CI 98–130)
WHO estimated rate per 100 000 population 15.1
Estimated GDP lost due to road traffic crashes —
b
Royal Bhutan Police (Traffic Division). Defined as died within 30 days of crash.
DEATHS BY ROAD USER CATEGORY TRENDS IN REPORTED ROAD TRAFFIC DEATHS
Pedestrians (3%)
Riders motorized 2- or 16
3-wheelers (2%)
14
12
Deaths per 100 000 population
10
8
Drivers 4-wheeled
cars and light 6
vehicles (46%)
4
Passengers 4-wheeled 2
cars and light vehicles
(49%) 0
| | | | | | | | | |
2004 2005 2006 2007 2008 2009 2010 2011 2012 2013
Source: Royal Bhutan Police (Traffic Division) (data from 2013). Source: Royal Bhutan Police (Traffic Division).
2
16 ROAD SAFETY IN THE SOUTH-EAST ASIA REGION, 2015
Final_Final_16006_Regional Fact sheet on Road Safety_SEAR.indd 16 26/02/2016 14:38INDIA
Population: 1 252 139 596 • Income group: Middle • Gross national income per capita: US$ 1 570
INSTITUTIONAL FRAMEWORK SAFER ROAD USERS
Lead agency Department of Road Safety, Ministry of Road Transport National speed limit law Yesd
and Highways (MORTH) Max urban speed limit No
Funded in national budget Yes Max rural speed limit No
National road safety strategy Yes Max motorway speed limit No
Funding to implement strategy Partially funded Local authorities can modify limits Yes
Fatality reduction target No Enforcement 0 1 2 4 5 6 7 8 9 10
National drink–driving law Yes
SAFER ROADS AND MOBILITY
BAC limit – general population ≤ 0.03 g/dl
Formal audits required for new road construction projects Yes
BAC limit – young or novice drivers ≤ 0.03 g/dl
Regular inspections of existing road infrastructure No
Random breath testing carried out Yes
Policies to promote walking or cycling Yes
Enforcement 0 1 2 3 5 6 7 8 9 10
Policies to encourage investment in public transport Yes
% road traffic deaths involving alcohol 5%e
Policies to separate road users and protect VRUs Subnational
National motorcycle helmet law Yes
Applies to drivers and passengers Yesf
SAFER VEHICLES
Law requires helmet to be fastened No
Total registered vehicles for 2012 159 490 578
Law refers to helmet standard Yes
Cars and 4-wheeled light vehicles 38 338 015
Enforcement 0 1 2 3 5 6 7 8 9 10
Motorized 2- and 3-wheelers 115 419 175
Helmet wearing rate 20–80% All ridersg, 60% Driversg
Heavy trucks 4 056 885
National seat-belt law Yes
Buses 1 676 503
Applies to front and rear seat occupants Yes
Other 0
Enforcement 0 1 2 3 5 6 7 8 9 10
Vehicle standards applieda
Seat-belt wearing rate 26% Drivers (in Bangalore)h, 26% Front seatsh
Frontal impact standard No
National child restraint law Noi
Electronic stability control No
Restrictions on children sitting in front seat No
Pedestrian protection No
a
UNECE WP29. Child restraint law based on —
Enforcement —
POST-CRASH CARE % children using child restraints —
Emergency room injury surveillance system No National law on mobile phone use while driving Yes
Legislative review conducted by WHO. Vehicle safety data from UNECE WP29. Other data collected by questionnaire and cleared by Ministry of Road Transport and Highways.
Emergency access telephone numbers Multiple numbers Law prohibits hand-held mobile phone use Yes
Permanently disabled due to road traffic crash 2.0–3.0% Law also applies to hands-free phones Yes
National drug-driving law Yes
DATA
d
Under the Motor Vehicles Act, state governments in India have the authority to create different speed limits at the
local level.
Reported road traffic fatalities (2013) 137 572 (85% M, 15% F)
b e
Road Accidents in India, Transport Research Wing (TRW), MORTH (data from 2013).
f
Under the Motor Vehicles Act, state governments in India have the authority to adopt rules creating exemptions to
WHO estimated road traffic fatalities 207 551 the national motorcycle helmet requirements.
g
Bangalore Road Safety Programme (data from 2011–2012).
WHO estimated rate per 100 000 population 16.6 h
Bangalore Road Safety Programme (data from 2011).
i
Child restraints must be used as of April 1, 2016 for vehicles manufactured on or after October 1, 2014.
Estimated GDP lost due to road traffic crashes 3.0%c
b
Road Accidents in India; 2013 Transport Research Wing (TRW), Ministry of Road Transport and Highways. Defined as
died within 30 days of crash.
c
2009, 10th 5 Year Plan, Volume 2.
DEATHS BY ROAD USER CATEGORY TRENDS IN REPORTED ROAD TRAFFIC DEATHS
Drivers 4-wheeled
cars and light 14
Other (16%) vehicles (7%)
Passengers 4-wheeled 12
cars and light vehicles
Deaths per 100 000 population
(10%) 10
Drivers/passengers
buses (7%) 8
6
Drivers/passengers 4
heavy trucks (13%) Riders motorized 2- or
3-wheelers (34%) 2
Pedestrians (9%) 0
| | | | | | | | | |
Cyclists (4%) 2004 2005 2006 2007 2008 2009 2010 2011 2012 2013
Source: Road Accidents in India; 2013 Transport Research Wing (TRW), Ministry of Road Transport and Highways Source: Road Accidents in India; 2013 Transport Research Wing (TRW), Ministry of Road Transport and Highways
(data from 2013). (data from 2013).
ROAD SAFETY IN THE SOUTH-EAST ASIA REGION, 2015 3
17
Final_Final_16006_Regional Fact sheet on Road Safety_SEAR.indd 17 26/02/2016 14:38INDONESIA
Population: 249 865 631 • Income group: Middle • Gross national income per capita: US$ 3 580
INSTITUTIONAL FRAMEWORK SAFER ROAD USERS
Lead agency National Planning Agency (Badan Perencanaan National speed limit law Yes
Pembangunan Nasional - BAPPENAS) Max urban speed limit 70 km/h
Funded in national budget Yes Max rural speed limit 100 km/h
National road safety strategy Yes Max motorway speed limit No
Funding to implement strategy Fully funded Local authorities can modify limits Yes
Fatality reduction target 50% (2020) Enforcement 0 1 2 3 4 6 7 8 9 10
National drink–driving law Yesd
SAFER ROADS AND MOBILITY
BAC limit – general population —
Formal audits required for new road construction projects Yes
BAC limit – young or novice drivers —
Regular inspections of existing road infrastructure Yes
Random breath testing carried out Yes
Policies to promote walking or cycling Yes
Enforcement 0 1 2 3 4 6 7 8 9 10
Policies to encourage investment in public transport Yes
% road traffic deaths involving alcohol —
Policies to separate road users and protect VRUs Subnational
National motorcycle helmet law Yes
Applies to drivers and passengers Yes
SAFER VEHICLES
Law requires helmet to be fastened No
Total registered vehicles for 2013 104 211 132
Law refers to helmet standard Yes
Cars and 4-wheeled light vehicles 10 838 592
Enforcement 0 1 2 3 4 5 6 7 9 10
Motorized 2- and 3-wheelers 86 253 257
Helmet wearing rate 80% Driverse, 52% Passengerse
Heavy trucks 5 156 362
National seat-belt law Yes
Buses 1 962 921
Applies to front and rear seat occupants No
Other 0
Enforcement 0 1 2 3 4 5 6 7 9 10
Vehicle standards applieda
Seat-belt wearing rate —
Frontal impact standard No
National child restraint law No
Electronic stability control No
Restrictions on children sitting in front seat No
Pedestrian protection No
a
UNECE WP29. Child restraint law based on —
Enforcement —
POST-CRASH CARE % children using child restraints —
Emergency room injury surveillance system No National law on mobile phone use while driving Yes
Emergency access telephone numbers Multiple numbers Law prohibits hand-held mobile phone use No
Permanently disabled due to road traffic crash — Law also applies to hands-free phones No
National drug-driving law Yes
DATA d
Not based on BAC.
Legislative review conducted by WHO. Vehicle safety data from UNECE WP29. Other data collected by questionnaire and cleared by Ministry of Health.
e
2007, Study on Helmet Wearing, Universitas Indonesia.
Reported road traffic fatalities (2013) 26 416 (78% M, 22% F)
b
WHO estimated road traffic fatalities 38 279 (95%CI 32 079–44 479)
WHO estimated rate per 100 000 population 15.3
Estimated GDP lost due to road traffic crashes 2.9–3.1%c
b
Indonesia National Police. Defined as died within 30 days of crash.
c
Statistics of Indonesia (data from 2010).
DEATHS BY ROAD USER CATEGORY TRENDS IN REPORTED ROAD TRAFFIC DEATHS
Drivers 4-wheeled cars
and light vehicles (1%)
Other (MALDIVES
Population: 345 023 • Income group: Middle • Gross national income per capita: US$ 5 600
INSTITUTIONAL FRAMEWORK SAFER ROAD USERS
Lead agency Transport Authority, Ministry of Economic Development National speed limit law Yes
Funded in national budget No Max urban speed limit 30 km/hc
National road safety strategy No Max rural speed limit 30 km/h
Funding to implement strategy — Max motorway speed limit No
Fatality reduction target — Local authorities can modify limits No
Enforcement 0 1 2 3 4 5 7 8 9 10
SAFER ROADS AND MOBILITY National drink–driving law Nod
Formal audits required for new road construction projects No BAC limit – general population —
Regular inspections of existing road infrastructure No BAC limit – young or novice drivers —
Policies to promote walking or cycling No Random breath testing carried out No
Policies to encourage investment in public transport Subnational Enforcement —
Policies to separate road users and protect VRUs No % road traffic deaths involving alcohol —
National motorcycle helmet law Yese
SAFER VEHICLES Applies to drivers and passengers No
Total registered vehicles for 2013 61 412 Law requires helmet to be fastened No
Cars and 4-wheeled light vehicles 10 256 Law refers to helmet standard No
Motorized 2- and 3-wheelers 50 775 Enforcement 0 1 2 3 4 5 6 8 9 10
Heavy trucks 145 Helmet wearing rate —
Buses 140 National seat-belt law Yese
Other 96 Applies to front and rear seat occupants No
Vehicle standards applieda Enforcement 0 1 2 3 5 6 7 8 9 10
Frontal impact standard No Seat-belt wearing rate —
Electronic stability control No National child restraint law No
Pedestrian protection No Restrictions on children sitting in front seat No
a
UNECE WP29.
Child restraint law based on —
Enforcement —
POST-CRASH CARE
% children using child restraints —
Emergency room injury surveillance system Yes
119 National law on mobile phone use while driving Yes
Emergency access telephone numbers
— Law prohibits hand-held mobile phone use Yes
Permanently disabled due to road traffic crash
Law also applies to hands-free phones No
DATA National drug-driving law No
c
May be increased to an unspecified speed. The speed limit for two-wheeled vehicles is 25 km/h.
Legislative review conducted by WHO. Vehicle safety data from UNECE WP29. Other data collected by questionnaire and cleared by Minsitry of Health.
Reported road traffic fatalities (2013) 12b (75% M, 25% F) d
Alcohol consumption legally prohibited.
e
Only required on roads where vehicles may be driven at a speed higher than the normal limit.
WHO estimated road traffic fatalities 12
WHO estimated rate per 100 000 population 3.5
Estimated GDP lost due to road traffic crashes —
b
Maldives Police Service. Defined as unlimited time period following crash.
DEATHS BY ROAD USER CATEGORY TRENDS IN REPORTED ROAD TRAFFIC DEATHS
Drivers/passengers 4
buses (8%)
Drivers/passengers Passengers 4-wheeled 3.5
heavy trucks (8%) cars and light vehicles
(17%) 3
Deaths per 100 000 population
2.5
Riders motorized 2
2- or 3-wheelers
(17%) 1.5
1
Pedestrians (33%)
0.5
Cyclists (17%) 0
| | | | | | | |
2006 2007 2008 2009 2010 2011 2012 2013
Source: Maldives Police Service (data from 2013). Source: Maldives Police Service.
ROAD SAFETY IN THE SOUTH-EAST ASIA REGION, 2015 5
19
Final_Final_16006_Regional Fact sheet on Road Safety_SEAR.indd 19 26/02/2016 14:38MYANMAR
Population: 53 259 018 • Income group: Low • Gross national income per capita: US$ —
INSTITUTIONAL FRAMEWORK SAFER ROAD USERS
Lead agency Traffic Rules Enforcement Supervisory Committee (TRESC) National speed limit law Yes
Funded in national budget No Max urban speed limit 48 km/h
National road safety strategy Yes Max rural speed limit 80 km/h
Funding to implement strategy Partially funded Max motorway speed limit No
Fatality reduction target 50% (2011–2015) Local authorities can modify limits Yes
Enforcement 0 1 2 3 4 6 7 8 9 10
SAFER ROADS AND MOBILITY National drink–driving law Yes
Formal audits required for new road construction projects Yes BAC limit – general population ≤ 0.08 g/dl
Regular inspections of existing road infrastructure Yes BAC limit – young or novice drivers ≤ 0.08 g/dl
Policies to promote walking or cycling No Random breath testing carried out Yes
Policies to encourage investment in public transport Yes Enforcement —
Policies to separate road users and protect VRUs Subnational % road traffic deaths involving alcohol —
National motorcycle helmet law Yes
SAFER VEHICLES Applies to drivers and passengers Yes
Total registered vehicles for 2014 4 310 112 Law requires helmet to be fastened Yes
Cars and 4-wheeled light vehicles 386 049 Law refers to helmet standard No
Motorized 2- and 3-wheelers 3 712 220 Enforcement 0 1 2 3 4 6 7 8 9 10
Heavy trucks 127 947 Helmet wearing rate 48–51% All ridersd
Buses 22 253 National seat-belt law No
Other 61 643 Applies to front and rear seat occupants —
Vehicle standards applieda Enforcement —
Frontal impact standard No Seat-belt wearing rate —
Electronic stability control No National child restraint law No
Pedestrian protection No Restrictions on children sitting in front seat No
a
UNECE WP29.
Child restraint law based on —
Enforcement —
POST-CRASH CARE
% children using child restraints —
Emergency room injury surveillance system No
192 National law on mobile phone use while driving No
Emergency access telephone numbers
— Law prohibits hand-held mobile phone use —
Permanently disabled due to road traffic crash
Law also applies to hands-free phones —
DATA National drug-driving law No
d
Department of Health, Study carried out by Yangon Hospital (data from 2011).
Legislative review conducted by WHO. Vehicle safety data from UNECE WP29. Other data collected by questionnaire and cleared by Ministry of Health.
Reported road traffic fatalities (2013) 3 612b (75% M, 25% F)
WHO estimated road traffic fatalities 10 809 (95%CI 8 790–12 829)
WHO estimated rate per 100 000 population 20.3
Estimated GDP lost due to road traffic crashes 0.5%c
b
Myanmar Police Force. Defined as died within 30 days of crash.
c
University of Economics (data from 2008).
DEATHS BY ROAD USER CATEGORY TRENDS IN REPORTED ROAD TRAFFIC DEATHS
7
Other (9%)
Drivers 4-wheeled cars
Drivers/passengers and light vehicles (13%) 6
heavy trucks (7%)
Deaths per 100 000 population
5
Passengers 4-wheeled
cars and light vehicles 4
(13%)
3
Pedestrians (26%) 2
Riders motorized 2- or 1
3-wheelers (23%)
0
| | | | | | | | | |
Cyclists (9%) 2004 2005 2006 2007 2008 2009 2010 2011 2012 2013
Source: Myanmar Police Force (data from 2010). Source: Myanmar Police Force.
6
20 ROAD SAFETY IN THE SOUTH-EAST ASIA REGION, 2015
Final_Final_16006_Regional Fact sheet on Road Safety_SEAR.indd 20 26/02/2016 14:38NEPAL
Population: 27 797 457 • Income group: Low • Gross national income per capita: US$ 730
INSTITUTIONAL FRAMEWORK SAFER ROAD USERS
Lead agency Road Safety Council, Ministry of Physical National speed limit law Yes
Infrastructure and Transport Max urban speed limit 80 km/h
Funded in national budget Yes Max rural speed limit 80 km/h
National road safety strategy Yes Max motorway speed limit No
Funding to implement strategy Partially funded Local authorities can modify limits No
Fatality reduction target 35% (2013–2020) Enforcement 0 1 2 3 4 5 6 8 9 10
National drink–driving law Yesd
SAFER ROADS AND MOBILITY
BAC limit – general population —
Formal audits required for new road construction projects Yes
BAC limit – young or novice drivers —
Regular inspections of existing road infrastructure No
Random breath testing carried out Yes
Policies to promote walking or cycling No
Enforcement 0 1 2 3 4 5 6 7 8 10
Policies to encourage investment in public transport No
% road traffic deaths involving alcohol —
Policies to separate road users and protect VRUs No
National motorcycle helmet law Yes
Applies to drivers and passengers Yes
SAFER VEHICLES
Law requires helmet to be fastened No
Total registered vehicles for 2011 1 178 911
Law refers to helmet standard No
Cars and 4-wheeled light vehicles 133 992
Enforcement 0 1 2 3 4 5 6 7 8 10
Motorized 2- and 3-wheelers 891 018
Helmet wearing rate —
Heavy trucks 47 930
National seat-belt law Yes
Buses 35 100
Applies to front and rear seat occupants No
Other 70 871
Enforcement 0 1 2 3 4 6 7 8 9 10
Vehicle standards applieda
Seat-belt wearing rate —
Frontal impact standard No
National child restraint law No
Electronic stability control No
Restrictions on children sitting in front seat No
Pedestrian protection No
a
UNECE WP29. Child restraint law based on —
Enforcement —
POST-CRASH CARE % children using child restraints —
Emergency room injury surveillance system No National law on mobile phone use while driving No
Emergency access telephone numbers None Law prohibits hand-held mobile phone use —
Legislative review conducted by WHO. Vehicle safety data from UNECE WP29. Other data collected by questionnaire and cleared by Ministry of Health and Population.
Permanently disabled due to road traffic crash — Law also applies to hands-free phones —
National drug-driving law Yes
DATA
d
Not based on BAC.
Reported road traffic fatalities (2013) 1 744 (70% M, 30% F)
b
WHO estimated road traffic fatalities 4 713 (95%CI 3 880–5 546)
WHO estimated rate per 100 000 population 17.0
Estimated GDP lost due to road traffic crashes 0.8%c
b
Police Head Quarter (Traffic Division). Defined as died within 35 days of crash.
c
2011, World Health Survey, Final Report on Study of Health Care Cost for RTA.
DEATHS BY ROAD USER CATEGORY TRENDS IN REPORTED ROAD TRAFFIC DEATHS
8
7
6
Deaths per 100 000 population
5
4
d ata n o t ava i l a b l e
3
2
1
0
| | | | | | | | | |
2004– 2005– 2006– 2007– 2008– 2009– 2010– 2011– 2012– 2013–
2005 2006 2007 2008 2009 2010 2011 2012 2013 2014
Source: Police Head Quarter (Traffic Division).
ROAD SAFETY IN THE SOUTH-EAST ASIA REGION, 2015 7
21
Final_Final_16006_Regional Fact sheet on Road Safety_SEAR.indd 21 26/02/2016 14:38You can also read


