Risk Assessment for the Establishment of Vespa mandarinia (Hymenoptera: Vespidae) in the Pacific Northwest, United States
←
→
Page content transcription
If your browser does not render page correctly, please read the page content below

Journal of Insect Science, (2021) 21(4): 10; 1–14
https://doi.org/10.1093/jisesa/ieab052
Research

Risk Assessment for the Establishment of Vespa
mandarinia (Hymenoptera: Vespidae) in the Pacific
Northwest, United States
Erik D. Norderud,1 Scott L. Powell,1 and Robert K. D. Peterson1,2,

                                                                                                                                                                     Downloaded from https://academic.oup.com/jinsectscience/article/21/4/10/6345207 by guest on 18 September 2021
1
 Department of Land Resources and Environmental Sciences, Montana State University, 334 Leon Johnson Hall, Bozeman, MT
59717-3120, USA, and 2Corresponding author, e-mail: bpeterson@montana.edu

Subject Editor: Johanne Brunet

Received 10 May 2021; Editorial decision 7 July 2021

Abstract
The recent introduction of the Asian giant hornet, Vespa mandarinia Smith, in the United States in late 2019 has
raised concerns about its establishment in the Pacific Northwest and its potential deleterious effects on honey
bees, Apis spp., and their pollination services in the region. Therefore, we conducted a risk assessment of the
establishment of V. mandarinia in Washington, Oregon, Montana, and Idaho on a county-by-county basis. Our
highly conservative tier-1 qualitative and semiquantitative risk assessment relied on the biological requirements
and ecological relationships of V. mandarinia in the environments of the Pacific Northwest. Our risk characterization
was based on climate and habitat suitability estimates for V. mandarinia queens to overwinter and colonize nests,
density and distribution of apiaries, and locations of major human-mediated introduction pathways that may
increase establishment of the hornet in the counties. Our results suggest that 32 counties in the region could be at
low risk, 120 at medium risk, and 23 at high risk of establishment. Many of the western counties in the region were
estimated to be at the highest risk of establishment mainly because of their suitable climate for queens to overwinter,
dense forest biomass for nest colonization, and proximity to major port and freight hubs in the region. By design,
our tier-1 risk assessment most likely overestimates the risk of establishment, but considering its negative effects,
these counties should be prioritized in ongoing monitoring and eradication efforts of V. mandarinia.

Key words: honey bee, Apis mellifera, Asian giant hornet, risk analysis, invasive species

Biological invasions can be ecologically and economically damaging                       confirmed sightings since May 2020 have prompted federal and state
phenomena that occur in environments around the world. The intro-                        agricultural officials to initiate eradication programs for the pest be-
duction and establishment of non-native species may disrupt na-                          cause of the insect’s propensity to decimate honey bee populations
tive flora and fauna and their ecosystems and concomitantly may                          and affect human safety with its stings.
cause deleterious consequences to a host of economic sectors and at                           Risk assessments are often used to frame the potential impacts
times even public health and safety. For example, emerald ash borer,                     that invasive species pose to ecosystems, economic sectors and in-
Agrilus planipennis Fairmaire, a buprestid native to Asia was acci-                      dustry, and human health and safety. To characterize these con-
dentally introduced into North America in 2002 and has since killed                      sequences, risk assessments are regularly developed to frame the
millions of ash trees and incurred billions of dollars of economic                       problem and ultimately to confer the degree of risk to regulatory
damage across a number of sectors (Herms and McCullough 2014).                           agencies and industry pertaining to the establishment of the par-
    The recent accidental introduction of the Asian giant hornet,                        ticular invading species. The type of risk assessment used is ultim-
Vespa mandarinia Smith, is one example of an invasive species that                       ately dependent on the data available for a particular stressor. In
poses risks to economic and ecological sectors in the United States.                     cases of a new introduction of an invasive species, where an invasion
V. mandarinia is the largest hornet species in the world and is a pri-                   is in its early onset, tier-1 qualitative and semiquantitative based risk
mary predator of honey bees, Apis spp. (Smith-Pardo et al. 2020). It                     assessments are often employed as a direct result of a lack of quan-
was first detected in North America in Vancouver, British Columbia                       titative and distribution data for the biological invader in question
and then later in the United States in Whatcom County in northern                        (Soliman et al. 2010, 2014). Tier-1 risk assessments are characterized
Washington State in late 2019. It was detected again in May 2020 in                      by deliberate assumptions that represent overestimates of effect and
the same county, indicating the possibility of wider spread establish-                   exposure so that the resulting assessment will be conservative and
ment rather than just a chance introduction and detection. Further                       err on the side of safety (SETAC 1994).

© The Author(s) 2021. Published by Oxford University Press on behalf of Entomological Society of America.
This is an Open Access article distributed under the terms of the Creative Commons Attribution License (http://creativecommons.org/licenses/by/4.0/),
                                                                                                                                                                1
which permits unrestricted reuse, distribution, and reproduction in any medium, provided the original work is properly cited.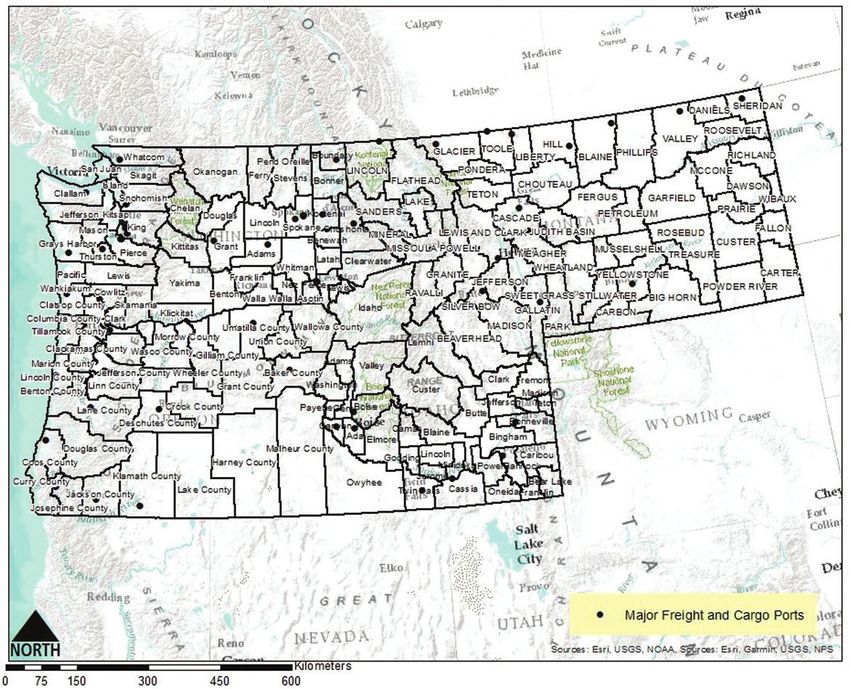
2                                                                                               Journal of Insect Science, 2021, Vol. 21, No. 4

    With these risks in mind, it is critical to properly frame them to        the confines of the nest and continues to lay eggs (Matsuura and
be able to effectively mitigate these hazards to avoid deleterious ef-        Sakagami 1973, Archer 1995, Takahashi et al. 2004).
fects to the environment and economy. Therefore, we performed a                   Mating season for V. mandarinia begins in early fall, with
risk assessment of the establishment of V. mandarinia in the Pacific          both new queens and reproductive males emerging (Matsuura and
Northwest, focusing on Washington, Oregon, Montana, and Idaho.                Sakagami 1973, Archer 1995). Males leave the nest before the
                                                                              queens to forage and to wait to mate with the newly emerging
                                                                              queens at the entrance of the nesting site (Matsuura 1984). The
Risk Assessment                                                               activity of the colony gradually decreases in the late fall before
Risk assessment is a formalized process for the objective evaluation          ceasing in the early winter, when queens need to find a site to over-
of risk in which assumptions and uncertainties are considered and             winter (Archer 1995). Maturity from egg to adult is approximately
presented (NRC 1983). Although precise steps and terminology vary,            40 d (Matsuura 1984) and the colony cycle lasts approximately 6
risk assessments typically follow the following steps: (1) problem            mo, with the males and workers living for approximately 3 wk,
                                                                              while queens live as long as 12 mo when accounting for their

                                                                                                                                                         Downloaded from https://academic.oup.com/jinsectscience/article/21/4/10/6345207 by guest on 18 September 2021
formulation, (2) analysis phase, and (3) risk characterization. The
analysis phase consists of effect and exposure assessments (NRC               overwintering period (Archer 1995).
1983, SETAC 1994, NRC 1996). Here, using terminology from                         The nests are assembled primarily in pre-existing ground-based
EPA (1998), we provide a problem formulation (which establishes               cavities, such as burrows, snake holes, or rotting tree roots (Archer
the goals, breadth, and focus of our assessment), an analysis phase           1995). The nests can be fairly complex and vary in size and are
(which has an effects assessment and an exposure assessment), and a           made from foraged wood-based fibers. A larva matures in each cell
risk characterization (which is a consideration of the joint property         (Matsurra and Yamane 1990). Archer (1995) reported a nest con-
of effect and exposure to determine risk or what additional data are          taining approximately 6,000 cells. Although the average nest can
needed to calculate risk or refine risk estimates).                           contain a few thousand separate cells, the actual colony size pro-
                                                                              duced from those cells is usually much smaller. The variable cell
                                                                              count of each nest makes it difficult to estimate the size of the colony
Problem Formulation
                                                                              that will be produced from those cells. Despite this, Archer (1995)
The first step of any risk assessment should begin with the ini-
                                                                              observed that a colony produced an average of approximately 200
tial problem formulation. The problem formulation sets the stage
                                                                              males and 200 queens in a given cycle in addition to hundreds of
in terms of the scope, steps, and methods of the risk assessment,
                                                                              workers.
delineating the ‘stressor’ and its ‘effects’ at its center of focus. In the
                                                                                  Vespa mandarinia seems to be sensitive to high temperatures
case of our risk assessment, that stressor is V. mandarinia in the U.S.
                                                                              and prefers more temperate climates, areas of low elevation, and
Pacific Northwest and its deleterious effects on the region’s ecosys-
                                                                              high amounts of precipitation for its nesting site (Kim et al. 2020,
tems and economy. Accordingly, our establishment risk assessment
                                                                              Zhu et al. 2020, Alaniz et al. 2021). However, there are reports of
begins with the known biological and ecological characteristics of
                                                                              V. mandarinia attacking honey bee colonies at high altitudes, such as
the stressor, V. mandarinia. Additionally, the stressor description also
                                                                              in the Himalayan ranges (Batra 1996). Furthermore, queens prefer
classifies the effect that V. mandarinia has on its surrounding ecosys-
                                                                              ‘green’ environments, such as forested areas, parks, agricultural
tems, focusing on risks to honey bee populations and apiaries. We
                                                                              zones, and other herbaceous settings (Kim et al. 2020, Alaniz et al.
analyzed the extent of these effects to assess the degree of exposure
                                                                              2021). This finding raises concerns about the risks to wild and cul-
to these risks in the effects and exposure assessment section of the
                                                                              tivated bee populations that are in these environments. In addition,
risk assessment, which primarily analyzed climate and habitat suit-
                                                                              nest colonization within urban greenspaces has the potential to re-
ability for the insect, factors influencing introduction, and risk to
                                                                              sult in human conflicts with V. mandarinia. Liu et al. (2016) reported
honey bee populations. The final section of our risk assessment drew
                                                                              that in only a 4-mo period (July–October when the species is typic-
from the findings of the previous steps, and we ultimately character-
                                                                              ally active), 42 people died and approximately 1,700 people were
ized the risks of the establishment of the V. mandarinia in the U.S.
                                                                              injured from suffering multiple stings in China’s Shaanxi Province.
Pacific Northwest using a risk-rating system.
                                                                                  Once V. mandarinia has occupied its new environment after ini-
                                                                              tial nest colonization, it must feed and forage. Although the spe-
Stressor Description                                                          cies is most known for its predation on social bees, it also feeds
The Asian giant hornet is prevalent throughout Asia, with its range           on sap from a number of different plant species that may lead to
extending from mainland Asia into Taiwan, Japan, and South Korea              crop damage. Overwintering queens initially begin feeding on tree
(Archer 1995). The insect is in the Vespidae family, within the order         sap sources and some fruiting tree species. Quercus (oak) species
Hymenoptera. V. mandarinia is the largest known species of hornet             were identified as an important sap source in which queens will
in the world, ranging from 38 to 50 mm in length (Matsuura and                begin to feed upon in mid-late April (Matsurra and Sakagami 1973,
Sakagami 1973, Lee 2010).                                                     Matsurra 1984, Matsurra and Yamane 1990, Makino 2016). In add-
    V. mandarinia have a caste system made up of queens, workers,             ition, V. mandarinia has also been found to be a competitively dom-
and males, each fulfilling duties integral to the success of the colony       inant species among a number of major diurnal sap-feeding species
(Archer 1995). The life cycle begins with a solitary queen initiating         (Yoshimoto and Nishidia 2009).
nest foundation after overwintering in a self-excavated cavity in a soft          Vespa mandarinia aggressively preys on insect species. It preys
ground-based substrate. Nest formation takes place over a number              on beetles, spiders, other social wasp species, but is most well-
of weeks in the late spring. During this period, the queen builds and         known for its mass attacks on honey bee species and their colonies
develops the nest, prepares to lay eggs, and feeds on arthropods and          (Matsuura 1984, Matsurra and Yamane 1990). V. mandarinia’s pro-
sap (Archer 1995). The colony begins in summer as the queen takes             pensity to hunt honey bees has caused issues worldwide (Matsuura
care of her brood and workers eventually begin to emerge. Once                and Sakagami 1973), especially in instances where it has become es-
the queen has produced enough workers, the duties of the colony               tablished and local honey bee populations have not had the chance
are transferred solely to the workers, while the queen remains in             to adapt to its attacks.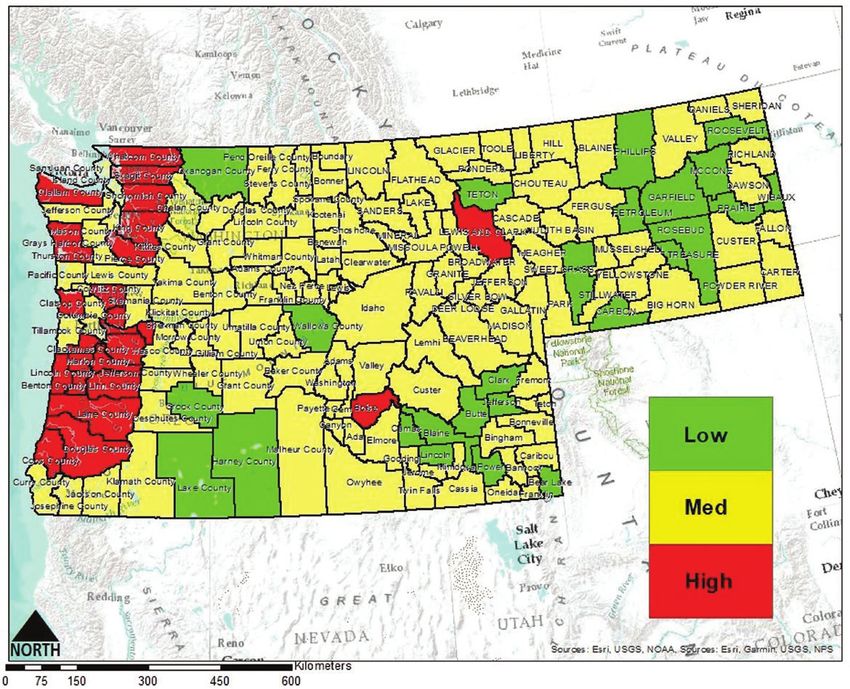
Journal of Insect Science, 2021, Vol. 21, No. 4                                                                                                            3

    Introduction of non-native species to new territories through                Columbia and Washington were likely from separate mated queens,
natural dispersal such as flying or foraging is unlikely to occur                although the data could not ascertain whether these specimens were
over large geographic distances. However, unlike natural methods                 from the same populations or were introduced at the same time
of non-native species introduction into new environments, human-                 (Wilson et al. 2020). Despite this, the data seem to substantiate the
mediated introduction is considered the leading cause of non-native              role that human-mediated transport through economic trade has
biological invasions, not only in the United States, but also around             played in the introduction of V. mandarinia to North America and
the world (Vitousek et al. 1997). This is a result of extensive land             the Pacific Northwest.
transformations producing favorable conditions for invasion and ac-                   Beyond global economic trade, cultural pursuits may serve as po-
cidental introductions due to international export and import com-               tential pathways for the introduction of V. mandarinia. The species
mercial trade (Vitousek et al. 1997). Human-mediated introduction                is considered a delicacy in its endemic ranges in Asia and pupae and
through economic trade is the likely reason V. mandarinia was acci-              adults alike are consumed as food in multiple dishes and are often
dentally introduced in northern Washington, considering the species              semidomesticated for these purposes (Mozhui et al. 2020). Obviously,
was found close to the U.S./Canadian border near ports of entry and              specimens that are consumed no longer serve as a pest risk, but the

                                                                                                                                                                 Downloaded from https://academic.oup.com/jinsectscience/article/21/4/10/6345207 by guest on 18 September 2021
that the region serves as a destination for commercial trade commod-             transportation of the insect at any life stage where it is still living could
ities from Asia (Wilson et al. 2020) (Fig. 1). This is supported by the          inadvertently result in establishment if it were to escape and colonize
captures of V. mandarinia in both Vancouver, British Columbia and                a new nest site. Most ports of entry within the United States have safe-
Washington that were found to originate from two separate lineages               guarding and inspection measures in place to prevent the importation
(Wilson et al. 2020). The individual captured in British Columbia                of live insects and foreign species in cases like this. However, a 100%
had DNA from a lineage in Yamaguchi, Japan, whereas the captured                 interception rate is highly unlikely, so the transportation of the insect
specimen in Washington had DNA linked to a maternal lineage in                   for cultural purposes must be viewed as a viable potential pathway for
Chungcheonuk-do, South Korea. Both these introductions in British                its introduction to non-native regions of the United States.

Fig. 1. Major freight and cargo ports in the Pacific Northwest. The recent introduction of Vespa mandarinia in North America is thought to have resulted from
economic trade activities between the United States and Asia.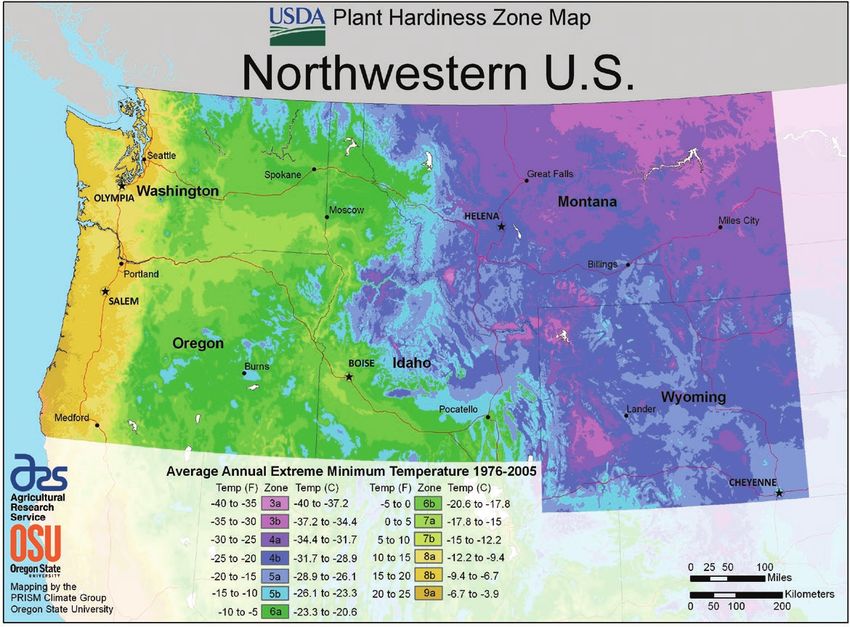
4                                                                                             Journal of Insect Science, 2021, Vol. 21, No. 4

Effects Assessment                                                          A. mellifera, the establishment and naturalization of V. mandarinia
The effects assessment in our risk assessment assumes V. mandarinia         in the Pacific Northwest could pose high risks for agricultural pro-
queens survive their overwintering period and successfully initiate         ducers. Beyond agricultural crop varieties, apiculture is also an agri-
a new nest and establish a colony, potentially causing negative ef-         cultural sector at risk from the establishment of V. mandarinia in
fects to environments in the Pacific Northwest. Those potential             the Pacific Northwest. Furthermore, a recent survey of total honey
deleterious effects occur primarily through feeding and predation           bee colonies within the four states revealed that in June 2020,
strategies of the colony, which result in crop damage and attacks on        Washington State had an estimated 114,000 honey bee colonies,
honey bee populations that can thereby impact pollination services.         Oregon had an estimated 95,000, while Montana and Idaho had
    There are distinct phases that V. mandarinia exhibit to attack a        110,000 and 107,000 colonies, respectively (USDA NASS 2021).
honey bee colony. The first phase begins with a solitary scout chem-            Beyond the potential risks V. mandarinia poses to agricultural
ically marking a bee colony or hive by rubbing her terminal gastrite        and apicultural sectors, the insect also poses a risk to health and
sternite directly on the targeted hive to signal to the rest of the         human safety. The U.S. Census Bureau estimated populations of
                                                                            more than 7.5 million residents in Washington, 4.2 million residents

                                                                                                                                                       Downloaded from https://academic.oup.com/jinsectscience/article/21/4/10/6345207 by guest on 18 September 2021
colony of the availability of a source of food (Ono et al. 1995). Once
the chemical pheromone has alerted other members of the colony,             in Oregon, 1 million residents in Montana, and 1.7 million residents
they will gather en masse and kill the adults in the hive (Matsuura         in Idaho in 2019 (U.S. Census Bureau 2019). Although it is statis-
1984, Ono et al. 1995).                                                     tically unlikely that even a small percentage of those populations
    Honey bee species such as Apis cerana japonica that have                would ever interact with V. mandarinia, the hornet kills dozens of
coevolved with V. mandarinia in their native ranges have the ability        people per year on average in Japan and causes sting-related injuries
to defend themselves against attack by alerting nestmates of incoming       to thousands more (Dooley 2020).
attack using chemical cues (Fujiwara et al. 2018, McClenaghan et al.
2019). They use a defense mechanism termed a ‘hot defensive bee             Exposure Assessment
ball’ in which hundreds of bees swarm a single hornet and gen-              The exposure assessment phase of a risk assessment involves
erate enough heat and carbon dioxide around the attacker to kill it         drawing upon information from the stressor description and effects
(Sugahara and Sakamoto 2009). Ono et al. (1995) observed through            assessment and applies relevant data to the environment or ecosys-
thermal imagery that the hot defensive bee ball was more than 47oC          tems in question for the purpose of analysis to estimate the degree of
(116oF). Similarly, A. c. japonica has been documented to smear             risk, impacts, or potential consequences that the stressor may have
both plant-based materials and animal feces around hive entrances           in those environments. Accordingly, drawing from our stressor de-
to disrupt attacks by V. mandarinia and the closely related species         scription and effects assessment of V. mandarinia, our exposure as-
Vespa soror (Matilla et al. 2020).                                          sessment analyzed the ecosystems and environments of the Pacific
    Once a honey bee colony’s defenses are largely overcome,                Northwest and compared them to the ecological requirements of
V. mandarinia begins its occupation phase and feeds on the colony’s         the hornet.
brood for several days (Ono et al. 1995). For honey bee species that            Our analysis primarily focused on regions that match
have not coevolved with V. mandarinia, such as Apis mellifera, which        V. mandarinia’s climate and habitat suitability requirements and
only have less effective stingers as a defense (Ugajin et al. 2012), com-   the presence and density of honey bee colonies. Suitable climate for
plete annihilation of the colony is a likely outcome when attacked          V. mandarinia was based on minimum and maximum temperatures
en masse by the hornet, termed the ‘slaughter’ phase (Matsuura and          using plant hardiness zone maps of Washington, Oregon, Montana,
Sakagami 1973, Matsurra 1988). The slaughter phase involves mass            and Idaho and comparing them to the climate in its native ranges in
attack in which the hornets can quickly dispatch an entire colony,          Asia because minimum and maximum temperatures have been cited
mostly through decapitation using their mandibles. The slaughter            as necessary abiotic factors critical to the establishment of viable in-
event lasts between 1 and 6 hr and can result in the deaths of thou-        sect populations (Zhu et al. 2020). Therefore, this serves as a good
sands of bees or entire colonies, in which the decapitated bees are         predictor of whether V. mandarinia queens would be able to survive
often left in massive piles inside the hive (Matsuura 1984, Matsuura        their overwintering period.
and Yamane 1990). The occupation and slaughter phase make the                   The United States is divided into 13 separate plant hardiness
hornet a significant risk to vulnerable non-coevolved bee species.          zones across 10oF differences, which are based on minimum winter
Should V. mandarinia become established in ecosystems outside its           temperatures. These zones are further classified into two separate
endemic range, wild bee colonies and apiaries may suffer extremely          zones (A or B) by 5oF differences. Washington’s plant hardiness zones
heavy losses resulting in substantial economic consequences to api-         range from 4A (−34 to −31oC or −30 to −25oF) to 9A (−6 to −3.8oC
arists and the pollination services provided by wild bee and culti-         or 20 to 25oF). Oregon shares similar zone ratings, which ranges
vated honey bees to hundreds of agricultural crops and plant species.       from 4B (−31 to −28.9oC or −25 to −20oF) to 9A (−6 to −3.8oC or 20
    The European honey bee, Apis mellifera, may be at potential             to 25oF) (USDA Agricultural Research Service 2020). Montana’s and
risk from V. mandarinia attack. It is a critically important pollinator     Idaho’s climate is generally much colder, ranging from 3A (−40 to
around the world. In the United States, A. mellifera pollinates hun-        −37.2°C or −40 to −35°F) to 6A (−23.3 to −20.6°C or −10 to −5°F)
dreds of crop species. Honey bees are the foremost insect pollinators       in Montana and 3B (−37.2 to −34.4°C or −35 to −40°F) to 7B (−15
and constitute an estimated economic benefit of nearly $12 billion          to 12.2°C or 5 to 10°F) in Idaho.
or roughly 80% of the total pollination value in the United States              Vespa mandarinia’s native ranges in Eastern and Southeast Asia
(Choi and Kwon 2015).                                                       include plant hardiness zones of 6A–13B (Magarey et al. 2008).
    The Pacific Northwest (primarily Washington and Oregon) is the          However, without thorough and up-to-date distribution data of the
nation’s leader in specialty crops including various varieties of fruits,   insect within its endemic ranges or those regions within the Pacific
nuts, and berries, with a total economic value of $4 billion annu-          Northwest, it is difficult to pinpoint the precise plant hardiness
ally (Houston et al. 2018). Considering that the majority of these          zones that the insect favor, resulting in what is most likely a highly
crops are likely dependent on the pollination services provided by          generalized estimate (Magarey et al. 2008).
Journal of Insect Science, 2021, Vol. 21, No. 4 5
Consequently, there is overlap in plant hardiness zones between United States by percentage. Counties that contained forest cover
V. mandarinia’s natural range and areas in Washington, Oregon, 0–33% were classified as ‘low,’ counties with forest cover estimates
Montana, and Idaho. For the purpose of the analysis, counties which 33–66% were classified as ‘medium,’ and counties estimated to con-
contained PHZ’s below 6A were classified as ‘low’ risk. Counties tain forest cover estimates 66–99% were classified as ‘high.’
with PHZ’s ranging from 6A to 7B were classified as ‘medium’ risk We obtained data on honey bee colony densities and distribution
and counties with PHZ’s of 7B or greater were classified as ‘high’ by county for Washington, Oregon, Montana, and Idaho based on
risk. This overlap is primarily in the western and coastal regions of registered apiaries and number of individual hives of each apiary.
each state, but also in some inland regions as well (Fig. 2). Thus, The information was then summed for each county for a total
there is risk that queens may be able to survive their overwintering number of individual hives in each state, with percentage for each
period within these regions. county relative to the total across the four states.
The Pacific Northwest also has very dense forest cover. Blackard For Washington, the results showed that Grant County, Yakima
et al. (2008) estimated that the Pacific Northwest contained County, and Skagit County comprised the majority of honey bee
the highest densities of forest biomass in the contiguous United colonies at 40.2%, 12.9%, and 11.0%, respectively, accounting
Downloaded from https://academic.oup.com/jinsectscience/article/21/4/10/6345207 by guest on 18 September 2021
States, with an estimated 22 million acres of forested landcover in for 64% of the state’s apicultural populations. The remaining 36%
Washington and 32 million acres of forested landcover for Oregon. of apiary populations among Washington’s counties ranged from
Montana has 25 million acres of forested land cover, while Idaho 0.01 to 3.5% of the state’s total apiary populations (Table 1).
has 21 million acres (USDA 2017). Considering that V. mandarinia For Oregon, the results indicated that Malheur County, Linn
prefers to establish and colonize nests within green, herbaceous en- County, Yamhill County, Clackamas County, and Marion County
vironments, the Pacific Northwest serves as a suitable region within accounted for approximately 75% of the state’s apicultural popu-
the United States for it to establish and proliferate (Fig. 3). To assign lations (Table 1).
forest cover into categories of ‘low,’ ‘medium,’ or ‘high,’ we used a For Montana, the results showed that Richland, Lewis and Clark,
forest cover dataset that classified forest cover in the northwestern and Fergus counties made up approximately 20% of apiaries in the
Fig. 2. Plant hardiness zone (PHZ) map of the U.S. Pacific Northwest. PHZs are based on the average minimum winter temperature across a 30-yr time frame for
a region and are used to help growers determine which plants may grow best depending on the zone they inhabit. This risk assessment used PHZs to determine
suitable climate where Vespa mandarinia may overwinter. Washington and Oregon PHZs share some of the same PHZs that are present in V. mandarinia’s
native ranges. These zones include 6A–9A, which include the majority of Washington and Oregon, indicating suitable climate for V. mandarinia to overwinter in
and predate on honey bee populations. Montana and Idaho only share two of the same PHZs that are present in V. mandarinia’s native ranges. These zones are
6A–7B, found in northwestern Montana and much of northern and southwestern Idaho. (Source: USDA Agricultural Research Service 2020).6 Journal of Insect Science, 2021, Vol. 21, No. 4
Downloaded from https://academic.oup.com/jinsectscience/article/21/4/10/6345207 by guest on 18 September 2021
Fig. 3. Forest cover in the Pacific Northwest with apiary distribution in Washington, Oregon, and Montana. Due to the Idaho Public Record Law, we were not
permitted to obtain or display location of registered apiaries in the state. Vespa mandarinia prefers to colonize nests in ‘greenspaces.’ Considering the density of
forest cover, particularly in the western portions of Washington, Oregon, Montana, and Idaho, these regions may serve as suitable habitat for nest establishment.
Note the apiary distribution in relation to areas of dense forest cover.
state (Table 2). Canyon, Elmore, Gooding, Owyhee, Ada, and Payette one major port or freight hub, it received a risk rating score of ‘2.’
counties accounted for roughly 42% of apiaries among Idaho’s If a county did not contain a major port or freight hub, it received a
44 counties (Table 2). The distribution of apiaries in Washington, risk rating of ‘1’ (Fig. 1).
Oregon, and Montana is displayed graphically (Fig. 3). Per the Idaho Based on the apicultural distribution and the plant hardiness zone
Public Records Law, we were not permitted to obtain or display lo- maps of the four states and the previously stated habitat suitability
cational information of registered apiaries in the state. Apiaries were for overwintering, the majority of Washington’s and Oregon’s coun-
classified into categories of ‘low,’ ‘medium,’ or ‘high’ densities based ties fall within these suitable temperature ranges, with the exception
on a county’s total apiaries relative to the total number of apiaries of northern Okanogan, Ferry, Stevens, Pend Oreille, and portions of
in a given state. Counties that contained an apiary percentage of Wallowa, Baker, Grant, Harney, Lake, Malheur, Crook, Deschutes,
0–2% were classified as ‘low,’ counties with an apiary percentage and Klamath counties (Fig. 2). In Idaho, the majority of the southern
of 3–4% were classified as ‘medium,’ and counties with an apiary and western counties match these suitable temperature ranges (Fig. 2).
percentage of 5% and above were classified as ‘high.’ All percent- In contrast, only parts of Sanders, Mineral, and Lake Counties in
ages were rounded to the nearest whole number for the purpose of Montana provide temperature ranges which match V. mandarinia’s
classification system. endemic environments (Fig. 2).
Lastly, we examined major freight hubs and cargo ports in the Although the plant hardiness zones are likely an overgeneralization
Pacific Northwest by county on the basis that economic trade is his- of suitable habitat for V. mandarinia, it is nonetheless concerning that
torically responsible for numerous accidental invasive species intro- a large portion of Washington’s, Oregon’s, and Idaho’s apicultural in-
ductions. If a county contained more than one major port or freight dustry lies within these zones of potentially suitable climate and prox-
hub, that county received a risk rating of ‘3.’ If a county contained imity to areas of suitable habitat for nest colonization (Figs. 2 and 3).Journal of Insect Science, 2021, Vol. 21, No. 4 7
Table 1. Total honey bee hives by county in Washington State and Oregon
Washington counties Total hives and % relative to state total Oregon counties Total hives and % relative to state total
Adams 100 (0.1%) Baker 0 (0.0%)
Asotin 263 (0.3%) Benton 4,599 (6.0%)
Benton 42 (0.0%) Clackamas 8,026 (10.5%)
Chelan 527 (0.6%) Clatsop 30 (0.0%)
Clallam 167 (0.2%) Columbia 7 (0.0%)
Clark 2,234 (2.5%) Coos 143 (0.2%)
Columbia 1,157 (1.3%) Crook 29 (0.0%)
Cowlitz 201 (0.2%) Curry 18 (0.0%)
Douglas 3,015 (3.3%) Deschutes 23 (0.0%)
Ferry 27 (0.0%) Douglas 432 (0.6%)
Downloaded from https://academic.oup.com/jinsectscience/article/21/4/10/6345207 by guest on 18 September 2021
Franklin 3,009 (3.3%) Gilliam 0 (0.0%)
Garfield 508 (0.6%) Grant 686 (0.9%)
Grant 36,520 (40.2%) Harney 20 (0.0%)
Grays Harbor 94 (0.1%) Hood River 2,600 (3.4%)
Island 467 (0.5%) Jackson 350 (0.5%)
Jefferson 194 (0.2%) Jefferson 12 (0.0%)
King 2,935 (3.2%) Josephine 26 (0.0%)
Kitsap 485 (0.5%) Klamath 40 (0.1%)
Kittitas 203 (0.2%) Lake 15 (0.0%)
Klickitat 29 (0.0%) Lane 742 (1.0%)
Lewis 605 (0.7%) Lincoln 59 (0.1%)
Lincoln 111 (0.1%) Linn 12,457 (16.4%)
Mason 64 (0.1%) Malheur 19,100 (25.1%)
Okanogan 544 (0.6%) Marion 7,832 (10.3%)
Pacific 37 (0.0%) Morrow 0 (0.0%)
Pend Oreille 17 (0.0%) Multnomah 1,230 (1.6%)
Pierce 785 (0.9%) Polk 2,543 (3.3%)
San Juan 95 (0.1%) Sherman 0 (0.0%)
Skagit 10,020 (11.0%) Tillamook 112 (0.1%)
Skamania 101 (0.1%) Umatilla 3,195 (4.2%)
Snohomish 2,898 (3.2%) Union 25 (0.0%)
Spokane 3,623 (4.0%) Wallowa 0 (0.0%)
Stevens 3,169 (3.5%) Wasco 140 (0.2%)
Thurston 1,305 (1.4%) Washington 1,174 (1.5%)
Wahkiakum 36 (0.0%) Wheeler 1,000 (1.3%)
Walla Walla 1,915 (2.1%) Yamhill 9,767 (12.8%)
Whatcom 1,533 (1.7%)
Whitman 25 (0.0%)
Yakima 11,675 (12.9%)
Note the high proportions of honey bee hives in Grant, Skagit, and Yakima counties relative to the rest of Washington state. For Oregon, note Malheur, Linn,
Clackamas, Marion, and Yamhill counties relative to the rest of the state. Additionally, these counties also fall within the plant hardiness zones identified to provide
suitable climate where Vespa mandarinia may overwinter. See Figs. 2 and 3 (Freedom of Information Act Request from Washington Department of Agriculture
and Oregon Department of Agriculture).
Risk Characterization and Discussion containing high totals of honey bee hives received a risk rating of ‘3,’
To estimate the risk V. mandarinia poses to Washington, Oregon, while those containing low numbers of honey bee hives relative to the
Montana, and Idaho, we used a risk rating and scoring system based rest of the state received risk ratings of ‘2’ and ‘1.’ Lastly, the introduc-
on an approach used by Schleier et al. (2008) to rank the relative risk tion pathway score was based on major port and freight hubs con-
of the following categories and criteria: (1) climate suitability for tained in counties of the Pacific Northwest. If a county contained more
V. mandarinia to overwinter based on plant hardiness zones (ideal than one major port or freight hub, that county received a risk rating
plant hardiness zone score in Tables 3–6), (2) habitat suitability to of ‘3.’ If a county contained one major port or freight hub, it received
colonize nests in ‘green’ environments, which was based on dense a risk rating score of ‘2.’ If a county did not contain a major port or
forest cover in the Pacific Northwest, (3) density of apiaries by freight hub, it received a risk rating of ‘1.’
county, and (4) the proximity of introduction pathways (major port The scores were then summed across each risk factor for each
or freight hubs) that may increase the risk of establishment. county for a total possible overall risk score (ORS) of 12. Those
Those counties in each of the four states with high plant hardiness counties which received an ORS of 1–4 received a ‘low’ risk rating,
zone designations received a score of ‘3.’ Counties with medium to low while counties that received an ORS of 5–8 or 9–12 received a risk
plant hardiness zone designations received a risk rating of ‘2’ or ‘1,’ rating of ‘medium’ or ‘high,’ respectively (Tables 3–6). These results
respectively. Similarly, counties with high densities of forest cover re- are also shown visually (Fig. 4). Each factor was weighted equally
ceived a risk rating score of ‘3’ and counties with medium to low forest and it is important to note that this combined with ranking the risk
biomass received risk rating scores of ‘2’ and ‘1,’ respectively. Counties of a particular county as either low, medium, or high introduces8 Journal of Insect Science, 2021, Vol. 21, No. 4
Table 2. Total honey bee hives by county in Montana and Idaho
Montana counties Total hives and % relative to state total Idaho counties Total hives and % relative to state total
Beaverhead 3,349 (1.3%) Ada 5,781 (4.7%)
Big Horn 6,911 (2.6%) Adams 1,320 (1.0%)
Blaine 5,316 (2.0%) Bannock 3,679 (3.0%)
Broadwater 3,353 (1.3%) Bear Lake 2,854 (2.3%)
Carbon 4,509 (1.7%) Benewah 200 (0.1%)
Carter 3,203 (1.2%) Bingham 3,264 (2.6%)
Cascade 8,901 (3.4%) Blaine 1,460 (1.2%)
Choteau 8,841 (3.4%) Boise 3,285 (2.7%)
Custer 2,882 (1.1%) Bonner 748 (0.6%)
Daniels 3,260 (1.2%) Bonneville 3,358 (2.7%)
Downloaded from https://academic.oup.com/jinsectscience/article/21/4/10/6345207 by guest on 18 September 2021
Dawson 4,129 (1.6%) Boundary 1,998 (1.6%)
Deer Lodge 916 (0.3%) Butte 1,661 (1.3%)
Fallon 4,868 (1.8%) Camas 800 (0.6%)
Fergus 12,000 (4.6%) Canyon 10,866 (8.9%)
Flathead 5,486 (2.1%) Caribou 2,843 (2.3%)
Gallatin 5,500 (2.1%) Cassias 2,568 (2.1%)
Garfield 4,572 (1.7%) Clark 750 (0.6%)
Glacier 4,104 (1.5%) Clearwater 802 (0.6%)
Golden Valley 2,919 (1.1%) Custer 1,515 (1.2%)
Granite 1,666 (0.6%) Elmore 7,165 (5.9%)
Hill 1,471 (0.5%) Franklin 3,934 (3.2%)
Jefferson 1,583 (0.6%) Fremont 1,854 (1.5%)
Judith Basin 7,581 (2.9%) Gem 3,306 (2.7%)
Lake 5,612 (2.1%) Gooding 7,157 (5.9%)
Lewis and Clark 15,240 (5.9%) Idaho 2,451 (2.0%)
Liberty 742 (0.2%) Jefferson 1,871 (1.5%)
Lincoln 1,093 (0.4%) Jerome 1,916 (1.5%)
Madison 5,641 (2.1%) Kootenai 1,882 (1.5%)
McCone 916 (0.3%) Latah 1,166 (0.9%)
Meagher 3,486 (1.3%) Lemhi 1,164 (0.9%)
Mineral 1,171 (0.4%) Lewis 945 (0.7%)
Missoula 3,801 (1.4%) Lincoln 1,970 (1.6%)
Musselshell 3,171 (1.2%) Madison 2,651 (2.1%)
Park 6,554 (2.5%) Minidoka 1,211 (0.9%)
Petroleum 2,186 (0.8%) Nez Perce 2,100 (1.7%)
Phillips 4,079 (1.5%) Oneida 3,306 (2.7%)
Pondera 4,826 (1.8%) Owyhee 7,587 (6.2%)
Powder River 3,958 (1.5%) Payette 5,478 (4.5%)
Powell 2,152 (0.8%) Power 2,974 (2.4%)
Prairie 1,370 (0.5%) Shoshone 52 (0.0%)
Ravalli 7,364 (3.0%) Teton 1,250 (1.0%)
Richland 21,723 (8.4%) Twin Falls 2,756 (2.2%)
Roosevelt 3,291 (1.2%) Valley 1,060 (0.8%)
Rosebud 4,379 (1.6%) Washington 4,317 (3.5%)
Sanders 6,215 (2.4%)
Sheridan 4,673 (1.8%)
Silver Bow 906 (0.3%)
Stillwater 6,733 (2.6%)
Sweet Grass 4,817 (1.8%)
Teton 5,058 (1.9%)
Toole 1,227 (0.4%)
Treasure 1,726 (0.6%)
Valley 3,030 (1.1%)
Wheatland 2,889 (1.1%)
Wibaux 1,832 (0.7%)
Yellowstone 8,421 (3.2%)
Note the high proportions of honey bee hives in Richland, Lewis and Clark, and Fergus counties relative to the rest of Montana state. For Idaho, note Canyon,
Elmore, Gooding, Owyhee, Payette, and Ada counties relative to the rest of the state. Additionally, the counties in Idaho also fall within the plant hardiness zones
identified to provide suitable climate where Vespa mandarinia may overwinter. See Figs. 2 and 3 (Freedom of Information Act Request from Montana Department
of Agriculture and Idaho State Department of Agriculture).Journal of Insect Science, 2021, Vol. 21, No. 4 9
Table 3. Risk rating table for Vespa mandarinia establishment in Washington State
County Ideal plant hardiness zone score Apiary density score Dense forest Proximity to introduction Overall risk rating score (ORS)
biomass score pathway score
Adams 2 1 1 2 6
Asotin 2 1 1 2 6
Benton 2 1 1 3 7
Chelan 2 1 3 1 7
Clallam 3 1 3 2 9
Clark 3 2 3 2 10
Columbia 2 2 2 2 8
Cowlitz 3 1 2 3 9
Douglas 2 2 1 1 6
Downloaded from https://academic.oup.com/jinsectscience/article/21/4/10/6345207 by guest on 18 September 2021
Ferry 1 1 2 1 5
Franklin 2 2 1 3 8
Garfield 2 1 1 1 5
Grant 2 3 1 2 8
Grays Harbor 3 1 3 2 9
Island 3 1 2 1 7
Jefferson 3 1 3 1 8
King 3 2 2 3 10
Kitsap 3 1 2 1 7
Kittitas 2 1 2 1 6
Klickitat 2 1 1 1 5
Lewis 3 1 3 1 8
Lincoln 2 1 1 1 5
Mason 3 1 3 1 8
Okanogan 1 1 1 1 4
Pacific 3 1 3 1 8
Pend Oreille 1 1 2 1 5
Pierce 3 1 3 3 10
San Juan 3 1 3 1 8
Skagit 2 3 3 2 10
Skamania 2 1 3 1 7
Snohomish 3 2 3 3 11
Spokane 2 2 1 3 8
Stevens 2 2 2 1 7
Thurston 3 2 2 1 8
Wahkiakum 3 1 3 1 8
Walla Walla 2 2 1 2 7
Whatcom 2 2 3 2 9
Whitman 2 1 1 1 5
Yakima 2 3 2 1 8
An overall risk rating score (ORS) of 1–4 equals low risk. An ORS of 5–8 equals medium risk and an ORS of 9–12 equals high risk. Low ORS is highlighted in
green, medium in yellow, and high in red.
considerable model and parameter uncertainty that may overesti- apiculture and crop-pollinated agriculture sectors. Federal and state
mate risk (discussed in more detail below). regulatory agencies, as well as apicultural and agricultural indus-
Our results identified 23 counties at a high risk of establishment. tries should therefore take immediate action to develop plans and
Washington contained 9 high-risk counties, while Oregon contained methodologies to prevent further naturalization of V. mandarinia in
12. For Washington, these counties were Clallam, Clark, Cowlitz, Washington, Oregon, Montana, and Idaho, with the ultimate goal of
Grays Harbor, King, Pierce, Skagit, Snohomish, and Whatcom. The complete eradication of the species.
high-risk Oregon counties were Benton, Clackamas, Clatsop, Douglas,
Hood River, Lane, Lincoln, Linn, Marion, Multnomah, Polk, and Uncertainty Analysis
Yamhill. Of the remaining 54 counties in Washington and Oregon, 49 Our risk assessment had the goal of delineating the biological re-
were found to be at a medium risk of establishment, while only 5 were quirements of V. mandarinia and analyzing its known ecological
found to be at a low risk of establishment by V. mandarinia. Montana relationships with the environments of the Pacific Northwest to
and Idaho contained one high-risk county each: Lewis and Clark in estimate the establishment risk on a county-by-county basis. The
Montana and Boise in Idaho. Additionally, 17 Montana counties were results suggest a number of potential high, medium, and low risk
low risk, while Idaho contained 10 low-risk counties. The remaining factors that may aid in its establishment in the Pacific Northwest and
72 counties in the two states were estimated to be at medium risk. thereby help key personnel focus on areas for surveillance.
The results of the establishment risk assessment of V. mandarinia However, our risk assessment used a tier-1 or screening-level ap-
in the Pacific Northwest suggest that the establishment may present proach with additive risk factors and equal weights, which is usu-
serious economic consequences for the region, especially for ally employed when there is a lack of quantitative or spatial data.10 Journal of Insect Science, 2021, Vol. 21, No. 4
Table 4. Risk rating table for Vespa mandarinia establishment in Oregon
Oregon Ideal plant hardiness zone Apiary density score Dense forest biomass Proximity to introduction Overall risk rating
counties score score pathway score score (ORS)
Baker 1 1 1 2 5
Benton 3 3 2 2 10
Clackamas 3 3 2 1 9
Clatsop 3 1 3 2 9
Columbia 3 1 3 1 8
Coos 3 1 3 2 8
Crook 1 1 1 1 4
Curry 3 1 3 1 8
Deschutes 1 1 1 2 5
Downloaded from https://academic.oup.com/jinsectscience/article/21/4/10/6345207 by guest on 18 September 2021
Douglas 3 2 3 2 10
Gilliam 2 1 1 1 5
Grant 1 2 1 1 5
Harney 1 1 1 1 4
Hood River 3 2 2 2 9
Jackson 3 1 2 2 8
Jefferson 2 1 1 1 5
Josephine 3 1 3 1 8
Klamath 1 1 2 2 6
Lake 1 1 1 1 4
Lane 3 1 3 2 9
Lincoln 3 1 3 2 9
Linn 3 3 2 2 10
Malheur 1 3 1 1 6
Marion 3 3 2 2 10
Morrow 2 1 1 1 5
Multnomah 3 2 1 3 9
Polk 3 2 3 2 10
Sherman 2 1 1 1 5
Tillamook 3 1 3 1 8
Umatilla 2 2 1 2 7
Union 2 1 1 2 6
Wallowa 1 1 1 1 4
Wasco 2 1 1 1 5
Washington 3 1 1 2 7
Wheeler 2 1 1 1 5
Yamhill 3 3 2 1 9
An overall risk rating score (ORS) of 1–4 equals low risk. An ORS of 5–8 equals medium risk and an ORS of 9–12 equals high risk. Low ORS is highlighted in
green, medium in yellow, and high in red.
Considering that V. mandarinia was recently introduced into the species distribution modeling may prove useful as more world-
Pacific Northwest, there are few data concerning the species’ cur- wide occurrence data and documented physiological tolerances
rent distribution within Washington or elsewhere in the Pacific become available (Kriticos et al. 2015, Kumar et al. 2016, Zhu
Northwest. Moreover, there is very little published literature on et al. 2020). Accordingly, more detailed research regarding the
the species, with most of the published research dating back to the ecological relationships and life cycle of V. mandarinia in the
1970s through the 1990s. Furthermore, although there has been Pacific Northwest needs to be undertaken to form a more com-
somewhat of a recent resurgence in the literature on the species due plete picture of what can actually be defined as suitable habitat
to the recent introduction of the species into North America, most of within this region.
this research also relied heavily on the same aforementioned research Our inclusion of major port and freight hubs and honey bee
that was published decades ago. hive density arguably is not as important as the climate and habitat
With this scarcity of data and lack of knowledge concerning suitability factors (Zhu et al. 2020). In addition, by including port
the species’ ecological relationships and distribution in the Pacific and freight hubs, our establishment risk assessment incorporates
Northwest, our risk assessment relied on only a few of the bi- elements that might be more relevant to an introduction risk as-
otic and abiotic requirements that may sustain or hamper es- sessment. However, we believe including port and freight hubs is
tablishment success of the hornet. For example, the use of plant important because of examples such as Japanese beetle, Popillia
hardiness zones to delineate habitat suitability for V. mandarinia japonica Newman. In Montana, the Japanese beetle was acciden-
in the Pacific Northwest likely considerably overestimates the tally introduced at the Billings airport because of airplane transport
areas in which the species could survive its overwintering period and has only established in a relatively small area surrounding it
and establish new colonies the following year. Instead of using (Montana Department of Agriculture 2014). Consequently, we be-
plant hardiness zones, other approaches may be more accurate lieve port hubs can be important factors not only in introduction,
and, therefore, informative. For example, CLIMEX or Maxent but also establishment.Journal of Insect Science, 2021, Vol. 21, No. 4 11
Table 5. Risk rating table for Vespa mandarinia establishment in Montana
County Ideal plant hardiness Apiary density score Dense forest biomass Proximity to introduction Overall risk rating
zone score score pathway score score (ORS)
Beaverhead 1 1 2 1 5
Big Horn 1 1 1 1 4
Blaine 1 1 1 2 5
Broadwater 1 1 2 1 5
Carbon 1 1 1 1 4
Carter 1 1 1 2 5
Cascade 1 2 1 2 6
Choteau 1 2 1 1 5
Custer 1 1 1 1 4
Downloaded from https://academic.oup.com/jinsectscience/article/21/4/10/6345207 by guest on 18 September 2021
Daniels 1 1 1 2 5
Dawson 1 1 1 1 4
Deer Lodge 1 1 2 1 5
Fallon 1 1 1 1 4
Fergus 1 3 1 2 7
Flathead 1 1 3 2 7
Gallatin 1 1 2 2 6
Garfield 1 1 1 1 4
Glacier 1 1 2 2 6
Golden Valley 1 1 1 1 4
Granite 1 1 3 1 6
Hill 1 1 1 2 5
Jefferson 1 1 3 1 6
Judith Basin 1 2 2 1 6
Lake 2 1 2 1 6
Lewis & Clark 1 3 3 2 9
Liberty 1 1 1 2 5
Lincoln 1 1 3 2 7
Madison 1 1 2 1 5
McCone 1 1 1 1 4
Meagher 1 1 2 1 5
Mineral 2 1 3 1 7
Missoula 1 1 3 2 7
Musselshell 1 1 2 1 5
Park 1 2 2 1 6
Petroleum 1 1 1 1 4
Phillips 1 1 1 1 4
Pondera 1 1 2 1 5
Powder River 1 1 2 1 5
Powell 1 1 3 1 7
Prairie 1 1 1 1 4
Ravalli 1 2 3 1 7
Richland 1 3 1 1 6
Roosevelt 1 1 1 1 4
Rosebud 1 1 1 1 4
Sanders 2 1 3 1 7
Sheridan 1 1 1 2 5
Silver Bow 1 1 3 2 7
Stillwater 1 2 1 1 5
Sweet Grass 1 1 1 1 4
Teton 1 1 2 1 5
Toole 1 1 1 2 5
Treasure 1 1 1 1 4
Valley 1 1 1 2 5
Wheatland 1 1 1 1 4
Wibaux 1 1 1 1 4
Yellowstone 1 2 1 2 6
An overall risk rating score (ORS) of 1–4 equals low risk. An ORS of 5–8 equals medium risk and an ORS of 9–12 equals high risk. Low ORS is highlighted in
green, medium in yellow, and high in red.12 Journal of Insect Science, 2021, Vol. 21, No. 4
Table 6. Risk rating table for Vespa mandarinia establishment in Idaho
County Ideal plant hardiness Apiary density score Dense forest cover Proximity to introduction Overall risk rating
zone score score pathway score score (ORS)
Ada 2 1 1 2 6
Adams 1 1 2 1 5
Bannock 1 2 1 2 6
Bear Lake 1 1 1 1 4
Benewah 2 1 3 1 7
Bingham 1 2 1 1 5
Blaine 1 1 1 1 4
Boise 2 2 3 2 9
Bonner 2 1 3 1 7
Downloaded from https://academic.oup.com/jinsectscience/article/21/4/10/6345207 by guest on 18 September 2021
Bonneville 1 2 2 2 7
Boundary 1 1 3 2 7
Butte 1 1 1 1 4
Camas 1 1 1 1 4
Canyon 2 3 1 2 8
Caribou 1 1 2 1 5
Cassia 2 1 1 2 6
Clark 1 1 1 1 4
Clearwater 2 1 3 1 7
Custer 1 1 2 1 5
Elmore 2 3 1 1 7
Franklin 1 2 1 1 5
Fremont 1 1 2 1 5
Gem 2 2 1 1 6
Gooding 2 3 1 1 7
Idaho 1 1 3 1 6
Jefferson 1 1 1 1 4
Jerome 2 1 1 1 5
Kootenai 2 1 3 2 8
Latah 2 1 2 1 6
Lemhi 1 1 3 1 6
Lewis 2 1 2 1 6
Lincoln 1 1 1 1 4
Madison 1 1 1 1 4
Minidoka 1 1 1 1 4
Nez Perce 2 1 1 2 6
Oneida 2 2 1 1 6
Owyhee 2 3 1 1 7
Payette 2 3 1 1 7
Power 1 1 1 1 4
Shoshone 2 1 3 2 8
Teton 1 1 2 1 5
Twin Falls 2 1 1 2 6
Valley 1 1 3 1 6
Washington 2 2 1 1 6
An overall risk rating score (ORS) of 1–4 equals low risk. An ORS of 5–8 equals medium risk and an ORS of 9–12 equals high risk. Low ORS is highlighted in
green, medium in yellow, and high in red.
Data on honey bee hive distribution and density were based solely differ quantitatively by orders of magnitude (Cox et al. 2005). The
on hives that were managed by registered apiaries and did not take risk rating system also introduces model uncertainty with the four
into account hives that may be managed by unregistered beekeepers. additive risk factors being weighted equally and the assignment of
In addition, although the risk to apiaries may be easier to estimate, low, medium, or high risk classification introduces parameter un-
our risk assessment was not able to assess the risk to the pollination certainty. Combined, this produces outcomes that may considerably
services provided by wild bee populations considering that to our overestimate risk in a given county.
knowledge no data exist on estimates of wild bee populations in the Furthermore, our risk characterization’s reliance on estimating
Pacific Northwest. risk on a county-by-county basis is at a coarse scale, which likely
In addition, risk rating systems in qualitative or semiquantitative results in an over or under estimation of the actual risk in a given
risk assessments often lack the confidence to accurately discern be- area. However, and to reiterate, our assessment is meant to be used
tween quantitatively small and quantitatively large risks. This can by decision makers to identify counties in the region that are poten-
result in errors such as the assignment of higher risk ratings to either tially at high risk of establishment. Future assessments should focus
a particular, or multiple, risk situations, which may in reality actually on estimating risk in the region at a finer scale.Journal of Insect Science, 2021, Vol. 21, No. 4 13
Downloaded from https://academic.oup.com/jinsectscience/article/21/4/10/6345207 by guest on 18 September 2021
Fig. 4. County-by-county color-coded risk map of Vespa mandarinia establishment in the Pacific Northwest.
Acknowledgments Blackard, J. A., M. V. Finco, E. H. Helmer, G. R. Holden, M. L. Hoppus,
D. M. Jacobs, A. J. Lister, G. G. Moisen, M. D. Nelson, R. Riemann,
We thank T. Sterling (Montana State University) for reviewing an earlier ver-
et al. 2008. Mapping U.S. forest biomass using nationwide forest inven-
sion of the manuscript. This research was funded in part by the Montana
tory data and moderate resolution information. Remote. Sens. Environ.
Agriculture Experiment Station and Montana State University. This material is
112:1658–1677.
based on work that is supported by the USDA National Institute of Food and
Choi, M. B., and O. Kwon. 2015. Occurrence of Hymenoptera (wasps and
Agriculture, Hatch Multistate Project No. W-4045.
bees) and their foraging in the southwestern part of Jirisan National Park,
South Korea. J. Ecol. Environ. 38:367–374.
Cox, L. A., Jr, D. Babayev, and W. Huber. 2005. Some limitations of qualitative
Author Contributions risk rating systems. Risk. Anal. 25: 651–662.
Conceived: E.D.N. and R.K.D.P. Analysis: E.D.N., R.K.D.P., and S.L.P. Manu- Dooley, B. 2020. In Japan, the ‘Murder Hornet’ Is Both a Lethal Threat
script preparation and editing: E.D.N., R.K.D.P., and S.L.P. and a Tasty Treat. The New York Times, 20 July 2020. Available from
https://www.nytimes.com/2020/05/05/world/asia/murder-hornet-
japan.html.
References Cited EPA. 1998. Guidelines for Ecological Risk Assessment. EPA/630/R-
Alaniz, A. J., M. A. Carvajal, and P. M. Vergara. 2021. Giants are coming? 95/002F. April 1998. U.S. Federal Register 63(93):26846–26924. U.S.
Predicting the potential spread and impacts of the giant Asian hornet Environmental Protection Agency, Washington, DC. 188 pages.
(Vespa mandarinia, Hymenoptera:Vespidae) in the USA. Pest Manag. Sci. Fujiwara, A., M. Sasaki, and I. Washitani. 2018. First report on the emergency
77: 104–112. dance of Apis cerana japonica, which induces odorous plant material col-
Archer, M. E. 1995. Taxonomy, distribution, and nesting biology of the Vespa lection in response to Vespa mandarinia japonica scouting. Entomol. Sci.
mandarinia group (Hym., Vespinae). Entomol. Mon. Mag. 131: 47–53. 21:93–96.
Batra, S. W. T. 1996. Biology of Apis Laboriosa Smith, a pollinator of ap- Herms, D. A., and D. G. McCullough. 2014. Emerald ash borer invasion
ples at high altitude in the Great Himalaya Range of Garhwal, India, of North America: history, biology, ecology, impacts, and management.
(Hymenoptera: Apidae). J. Kans. Entomol. Soc. 69:177–181. Annu. Rev. Entomol. 59: 13–30.14 Journal of Insect Science, 2021, Vol. 21, No. 4
Houston, L., S. Capalbo, C. Seavert, M. Dalton, D. Bryla, and R. Sagili. 2018. Ono, M., T. Igarashi, E. Ohno, and M. Sasaki. 1995. Unusual thermal defense
Specialty fruit production in the Pacific Northwest: adaptation strategies by a honeybee against mass attack by hornets. Nature. 377:334–336.
for a changing climate. Clim. Change. 146:1159–1171. Schleier, J. J., S. E. Sing, and R. K. D. Peterson. 2008. Regional ecological
Kim, W. M., S. Y. Kim, and W. Song. 2020. Microhabitat characteristics af- risk assessment for the introduction of Gambusia affinis (western
fecting the occurrence and diversity of queen hornets (Genus Vespa) in an mosquitofish) into Montana watersheds. Biol. Invasions. 10:1277–1287.
urban green Area. Landsc. Ecol. Eng. 16:173–186. SETAC. 1994. Aquatic dialogue group: pesticide risk assessment and mitiga-
Kriticos, D., G. Mawald, T. Yonow, E. Zurcher, N. Herrmann, and R. Sutherst. tion. Society for Environmental Toxicology and Chemistry and SETAC
2015. Climex Version 4: exploring the effects of climate on plants, animals Foundation for Environmental Education, Pensacola, FL.
and diseases. CSIRO, Canberra, Australia. Smith-Pardo, A. H., J. M. Carpenter, and L. Kimsey. 2020. The diversity of
Kumar, S., W. L. Yee, and L. G. Neven. 2016. Mapping global potential risk hornets in the genus Vespa (Hymenoptera: Vespidae; Vespinae), their
of establishment of Rhagoletis pomonella (Diptera: Tephritidae) using importance and interceptions in the United States. Insect. Syst. Diver.
MaxEnt and CLIMEX niche models. J. Econ. Entomol. 109: 2043–2053. 4:1–27.
Lee, J. X. Q. 2010. Notes on Vespa analis and Vespa mandarinia (Hymenoptera: Soliman, T., M. C. M. Mourits, A. G. J. M. Oude Lansink, and W. van der Werf.
Vespidae in Hong Kong, and a key to all Vespa species known from the 2010. Economic impact assessment in pest risk analysis. Crop. Prot.
Downloaded from https://academic.oup.com/jinsectscience/article/21/4/10/6345207 by guest on 18 September 2021
SAR. Hong Kong Entomol. Bull. 2:31–36. 29:517–524.
Liu, Z., X. D. Li, B. H. Guo, Y. Li, M. Zhao, H. Y. Shen, Y. Zhai, X. L. Wang, Soliman, T., M. C. M. Mourits, A. G. J. M. Oude Lansink, and
and T. Liu. 2016. Acute interstitial nephritis, toxic hepatitis and toxic myo- W. van der Werf. 2014. Quantitative economic impact assessment of in-
carditis following multiple Asian giant hornet stings in Shaanxi Province, vasive plant pests: what does it require and when is it worth the effort?
China. Environ. Health. Prev. Med. 21: 231–236. Crop. Prot. 69:9–17.
Magarey, R. D., D. M. Borchert, and J. W. Schlegel. 2008. Global plant hardi- Sugahara, M., and F. Sakamoto. 2009. Heat and carbon dioxide generated by
ness zones for phytosanitary risk analysis. Sci. Agric. 65:54–59. honeybees jointly act to kill hornets. Naturwissenschaften. 96: 1133–1136.
Makino, S. 2016. Post-hibernation ovary development in queens of the Takahashi, J., S. Akimoto, S. J. Martin, M. Tumukae, and E. Hasegawa.
Japanese giant hornet Vespa mandarinia (Hymenoptera: Vespidae). 2004. Mating structure and male production in the giant hornet
Entomol. Sci. 19:440–443. Vespa mandarinia (Hymenoptera : Vespidae). Appl. Entomol Zool
Matilla, H., G. Otis, L. Nguyen, H. Pham, O. Knight, and N. Phan. 2020. 39:343–349.
Honey bee (Apis cerana) use animal feces as a tool to defend colonies Ugajin, A., T. Kiya, T. Kunieda, M. Ono, T. Yoshida, and T. Kubo. 2012.
against group attack by giant hornets (Vespa soror). PLoS ONE. 15:1–24. Detection of neural activity in the brains of Japanese honeybee
Matsuura, M. 1984. Comparative biology of the five Japanese species of the workers during the formation of a ‘hot defensive bee ball.’ PLoS ONE.
genus Vespa (Hymenoptera, Vespidae). Bull. Faculty. Agric. 69:1–131. 7:1–12.
Matsurra, M. 1988. Ecological study on Vespine wasps (Hymenoptera: U.S. Census Bureau. 2019. QuickFacts. Washington, Oregon, Montana, Idaho.
Vespidae) attacking honey bee colonies. Seasonal changes in the frequency Available from https://www.census.gov/quickfacts. Accessed Oct. 2020.
of visits to apiaries by Vespine wasps and damage inflicted, especially in USDA. 2017. Forest inventory and analysis, fiscal year 2016 business report.
the absence of artificial protection. Appl. Entomol. Zool. 23:428–440. U. S. Department of Agriculture, Forest Service, Washington, DC. 84 pp.
Matsuura, M., and S. F. Sakagami. 1973. A bionomic sketch of the giant USDA Agricultural Research Service. 2020. Plant hardiness zone map. U.
hornet, Vespa mandarinia, a serious pest for Japanese apiculture. J. Fac. S. Department of Agriculture. Available from https://planthardiness.ars.
Sci Hokaido Univ. (Zoology) 19:125–162. usda.gov/PHZMWeb/Default.aspx#. Accessed Oct. 2020.
Matsurra, M., and S. Yamane. 1990. Biology of the vespine wasps. Springer- USDA NASS. 2021. Quick Stats. U. S. Department of Agriculture, National
Verlag, Berlin, Germany, 1–167. Agricultural Statistics Service. Available from https://data.nal.usda.gov/
McClenaghan, B., M. Schlaf, M. Geddes, J. Mazza, G. Pitman, K. McCallum, dataset/nass-quick-stats. Accessed Apr. 2021.
S. Rawluk, K. Hand, and G. W. Otis. 2019. Behavioral responses of honey Vitousek, P. M., H. A. Mooney, J. Lubchenco, and J. M. Melillo. 1997. Human
bees, Apis cerana and Apis mellifera, to Vespa mandarinia marking and domination of Earth’s ecosystems. Science. 277:494–499.
alarm pheromones. J. Apic. Res. 58:141–148. Wilson, T. M., J. Takahashi, S. E. Spichiger, I. Kim, and P. van Westendorp.
Montana Department of Agriculture. 2014. Cooperative agricultural pest 2020. First reports of Vespa mandarinia (Hymenoptera: Vespidae) in
survey results. Montana State Department of Agriculture, Helena, MT. North America represent two separate maternal lineages in Washington
Mozhui, L., L. N. Kakati, P. Kiewhuo, and S. Changkija. 2020. Traditional State, United States, and British Columbia, Canada. Ann. Entomol. Soc.
knowledge of the utilization of edible insects in Nagaland, North-East Am. 113:468–472.
India. Foods 9:1–17. Yoshimoto, J., and T. Nishidia. 2009. Factors affecting behavioral interactions
NRC. 1983. Risk assessment in the federal government: managing the process. among sap-attracted insects. Ann. Entomol. Soc. Am. 102:201–209.
National Research Council. National Academy Press, Washington, DC. Zhu, G., J. Gutierrez Illan, C. Looney, and D. W. Crowder. 2020. Assessing
NRC. 1996. Understanding risk: informing decisions in a democratic society. the ecological niche and invasion potential of the Asian giant hornet. Proc.
National Research Council. National Academy Press, Washington, DC. Natl. Acad. Sci. U. S. A. 117: 24646–24648.You can also read