Results from Young-of-the-Year Rockfish Surveys in the southern Salish Sea 2015-2020
←
→
Page content transcription
If your browser does not render page correctly, please read the page content below
Results from Young-of-the-Year Rockfish
   Surveys in the southern Salish Sea
               2015-2020

       Adam Obaza, Amanda Bird, Jamey Selleck, and Dan Tonnes

                    Protected Resources Division
                   Puget Sound Ecosystem Branch
                  National Marine Fisheries Service
                         West Coast Region

                            July 20, 2021

                                                                1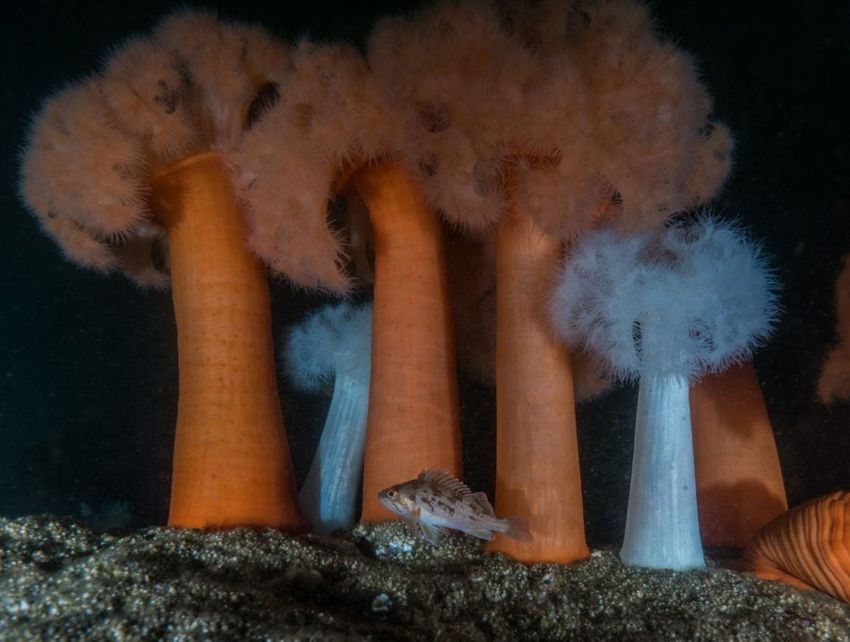
Table of Contents
SUMMARY .......................................................................................................................................................... 4
INTRODUCTION ................................................................................................................................................ 4
METHODS ........................................................................................................................................................... 6
SITE SELECTION .........................................................................................................................................................6
SURVEYS ....................................................................................................................................................................7
DATA ANALYSIS ........................................................................................................................................................8
Survey Effort, Fish, and Habitat ...........................................................................................................................8
Data Integration with Ocean Wise........................................................................................................................8
Citizen Scientist Data Viability .............................................................................................................................9
Influence of Outreach on Citizen Dive Effort .......................................................................................................9
RESULTS ............................................................................................................................................................. 9
SURVEY EFFORT ........................................................................................................................................................9
FISH AND HABITAT .................................................................................................................................................. 10
CITIZEN SCIENTIST DATA VIABILITY ....................................................................................................................... 13
INFLUENCE OF OUTREACH ON CITIZEN DIVE EFFORT .............................................................................................. 13
WAS 2020 A JACKPOT YEAR? .................................................................................................................................. 14
DISCUSSION ..................................................................................................................................................... 15
SURVEY EFFORT, FISH AND HABITAT ...................................................................................................................... 15
DATA INTEGRATION WITH OCEAN WISE .................................................................................................................. 17
CITIZEN SCIENTIST DATA VIABILITY ....................................................................................................................... 17
APPLICATIONS ................................................................................................................................................ 18
CONCLUSIONS ................................................................................................................................................ 18
ACKNOWLEDGEMENTS ................................................................................................................................ 18
LITERATURE CITED ...................................................................................................................................... 20
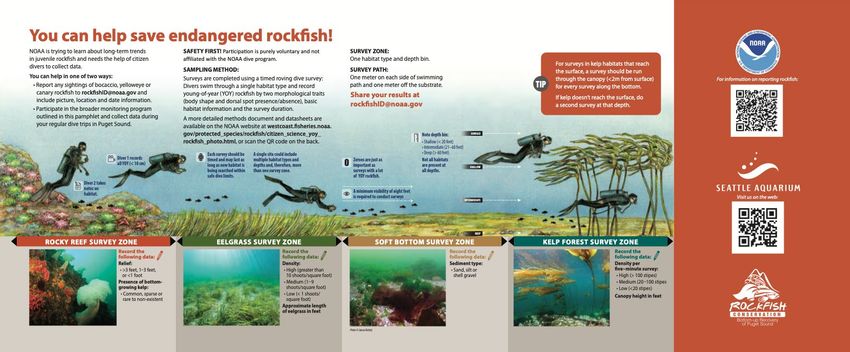
APPENDIX 1 - NOAA YOUNG-OF-YEAR ROCKFISH CITIZEN SCIENCE SURVEY GUIDE ................ 22
List of Tables
Table 1. Habitat type, feature, and metrics used to characterize habitat for rockfish transects…………... 7
List of Figures
Figure 1. Juvenile copper rockfish in eelgrass habitat in Puget Sound, WA……………………………….4
Figure 2. Young-of-year rockfish survey locations in Puget Sound and the San Juan Islands in Washington
from 2015-2020. Point size indicates annual effort and color corresponds to basin………………………. 6
Figure 3. Map delineating south Puget Sound and Strait of Georgia………………………………………8
Figure 4. Survey effort (minutes) for both citizen and professional scientific divers in Puget Sound, WA
from 2015 to 2020 (A) and by regional survey program (B). Note the difference in both x- and y-axis
scales……………………………………………………………………………………………………… 10
2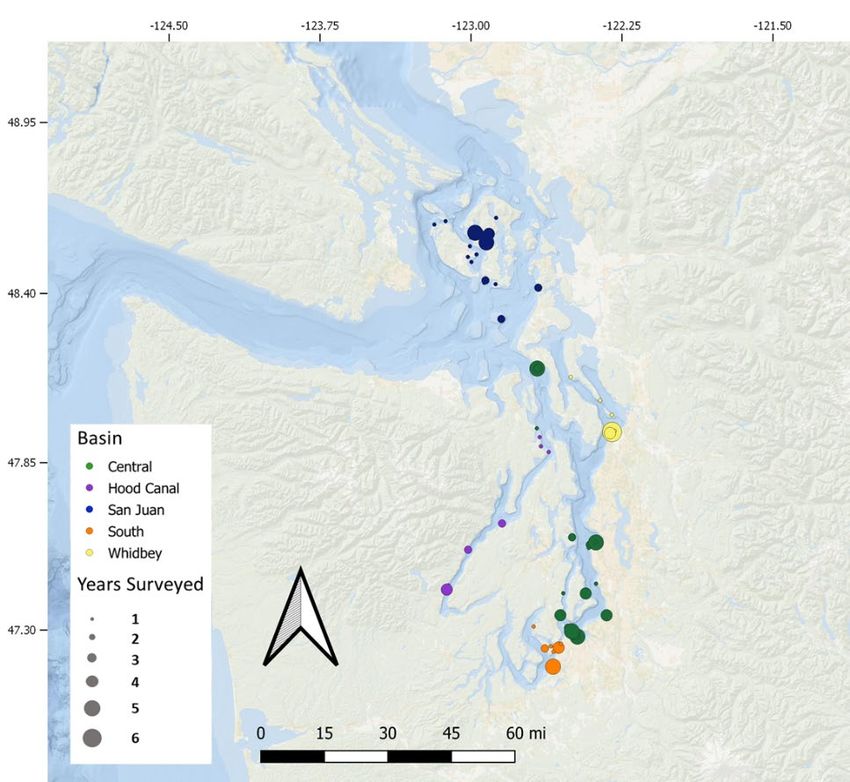
Figure 5. Relative effort as a percent of survey minutes in each basin (A) and by survey time for each
habitat type (B) in Puget Sound, WA from 2015-2020…………………………………………………... 10
Figure 6. Change in mean YOY rockfish encounter rate (solid black line) averaged across all years (2015-
2020) and months contrasted with survey effort (broken line) for surveys in Puget Sound, WA. Error bars
for encounter rate are standard error……………………………………………………………………… 11
Figure 7. Mean YOY rockfish encounter rate by basin (left) and major habitat type (right) in Puget Sound,
WA for all years (2015-2020)…………………………………………………………………………….. 11
Figure 8. Mean young-of-year rockfish encounter rate plotted against mean current speed in knots
(determined from the nearest NOAA buoy) in Puget Sound, WA. Points correspond to mean encounter rate
among all years (2015-2020) for a single site grouped by basin (A) and habitat type (B). The solid vertical
line in A represents 0.75 knots. Note that a single site may contain multiple habitat types surveyed, thus,
encounter rates by habitat type (B) and basin (A) may not be equal……………………………………... 12
Figure 9. Mean young-of-year rockfish encounter rate among the two regions (Puget Sound and the Strait
of Georgia; A) and among four morphological groups based on body shape and presence/absence of a dorsal
spot (B) from 2017 to 2020………………………………………………………………………………..13
Figure 10. A YOY rockfish accurately identified as "Deep body, no spot" (A), and a yellowtail YOY (B)
in Puget Sound, WA in 2019……………………………………………………………………………... 13
Figure 11. Plots of outreach effort against dive activity for A) events in each year and B) cumulative effort
throughout the project summed for all participating groups from 2015 - 2020…………………………...14
Figure 12. Plot of cumulative outreach effort of project PIs and the number of dives conducted annually
by four prominent participating citizen survey groups from 2015 – 2020……………………………….. 14
Figure 13. Comparison of YOY trends between 2020 and a baseline, defined as the mean from all other
years of program. Plots include A) encounter rate by basin B) encounter frequency by basin and C)
encounter rate by morphological type……………………………………………………………………...15

                                                                                                           3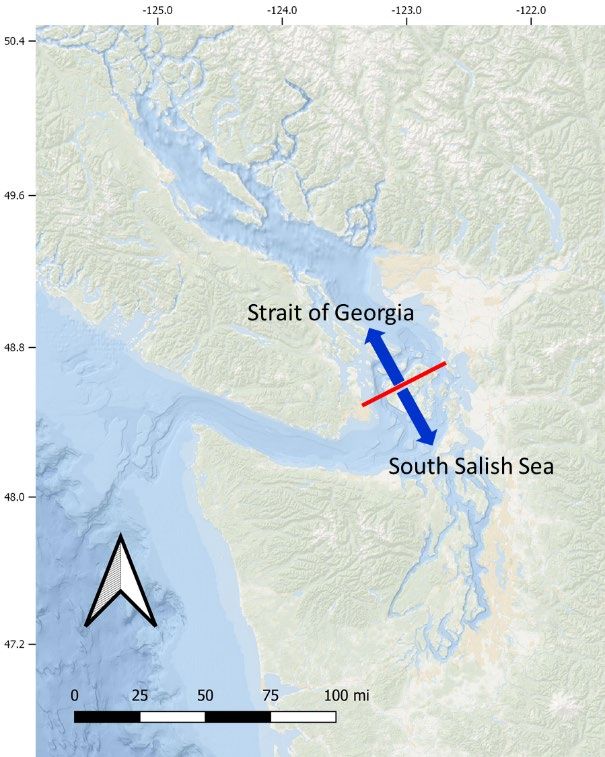
Summary
Knowledge of rockfish recruitment dynamics and habitat utilization by recently settled rockfishes is
valuable for developing appropriate fishery management and recovery actions. Until 2015, no survey
effort sought the spatial and temporal data necessary to fill these gaps in the southern Salish Sea. To
address this need, NMFS collaborated with state and federal agencies, non-profit groups, and academic
institutions to develop a citizen science SCUBA survey program directed at young-of-the-year (YOY)
rockfish. In this program, divers perform timed roving surveys in discrete habitat types, recording data on
rockfish abundance in four morphological classes, as well as qualitative habitat data. Continued and
focused outreach effort has led to increased survey participation over time, while better coordination and
agency support has allowed for more frequent professional surveys. A new partnership has been
established with Ocean Wise, which collects similar YOY data for the Strait of Georgia, allowing for a
more complete analysis of recruitment in the Salish Sea. Data presented in this report quantify the impact
of outreach on partner organization dive productivity and provide a preliminary evaluation of data
consistency across partner groups. General trends in YOY encounter across basins, habitat types, and
seasons are also explored, along with the influence of current on YOY encounter rates and a basic
interpretation of whether 2020 was a jackpot recruitment year. The applications of these data are growing
as partner participation spreads and additional years of data better define a baseline of YOY recruitment
in Puget Sound and connected waters. After six years of program operation, it continues to grow and
provide products that will be integral to recovering rockfish populations in the region.

Introduction
Rockfish comprise a suite of viviparous species within the genus Sebastes that function as mid-level
predators in nearshore marine habitats. While they are found throughout the waters of the west coast of
the United States and Canada, populations in Puget Sound have decreased in the past century, primarily as
a result of overfishing and reductions in habitat quality (Palsson et al. 2009; Williams et al. 2010).
NOAA’s National Marine Fisheries Service (NMFS) listed canary rockfish (Sebastes pinniger),
yelloweye rockfish (S. ruberrimus), and bocaccio (S. paucispinis) under the Endangered Species Act in
2010 (75 FR 22276), but canary rockfish were subsequently delisted based on new genetic evidence (81
FR 43979; Andrews et al. 2018). A final recovery plan for yelloweye rockfish and bocaccio was released
in October of 2017 (NMFS 2017). An important action identified in the recovery plan is to better
understand listed rockfish population abundance and habitat
associations. Included under this action are annual surveys of
young-of-the-year (YOY) rockfish throughout Puget Sound
and connected waters of the Salish Sea. Because listed YOY
rockfish are particularly rare (YOY bocaccio have yet to be
documented in the Puget Sound) a comprehensive effort to
document Sebastes YOY abundance and habitat association
in the region would shed additional light on recruitment
dynamics in association with climatic, oceanic, and habitat
variables, and help shape various management efforts.

Rockfish begin their life cycle as planktonic larvae that drift
                                                                 Figure 1. Juvenile copper rockfish in eelgrass
throughout pelagic habitat. After three to six months, they      habitat in Puget Sound, WA.
settle as juveniles into nearshore or benthic habitats.
Juveniles are known to aggregate in areas of high rugosity or submerged aquatic vegetation, such as kelp
and seagrass (Buckley 1997). Reefs and vegetated areas with low densities of adult and subadult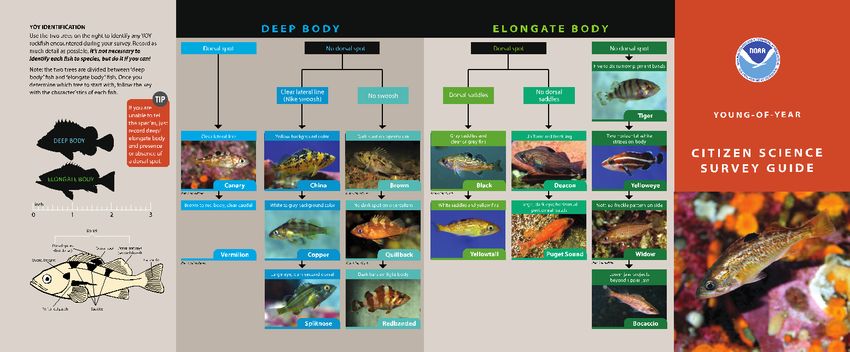
rockfishes have been shown to hold higher densities of YOY (Matthews 1990; West et al. 1994). As
rockfish typically parturate in the spring, YOY are often found in nearshore habitats in the summer and
fall (Doty et al. 1995), though interannual and spatial variation in abundance is high (Sakuma et al. 2006;
Ralston et al. 2013; LeClair et al. 2018). Using this baseline information as a starting point, a robust,
long-term sampling program that quantifies recruitment strength can be developed to support stock
assessments and habitat management.

The utilization of relatively shallow and nearshore habitats by YOY rockfish makes surveys on SCUBA
possible. A visual census on SCUBA allows for direct observation of fishes in vegetated, high-relief,
and/or shallow habitats that may be challenging for other sampling approaches. However, SCUBA
surveys at this scale are resource-intensive, which may pose a challenge for any lone stakeholder
interested in monitoring young rockfish throughout Puget Sound. Engaging with citizen divers provides
an opportunity to collect sufficient data to answer the project’s core questions and engage with a valuable
stakeholder group for rockfish recovery. There are numerous examples of recreational divers effectively
collecting scientific data on biodiversity (Goffredo et al. 2010), elasmobranchs (Ward-Paige and Lotze
2011), and fish abundance (Bodilis et al. 2014). In addition, the Seattle area has an active dive community
that could support such an effort. Given the biology of rockfish, demonstrated effectiveness of citizen
dive surveys, and pool of available divers, NMFS initiated a program to monitor YOY rockfish
abundance throughout Puget Sound.

In 2014, a survey program was developed in response to the data requirements outlined in the draft
recovery plan and the first data were collected in 2015. Methodology was drafted with input from
multiple regional experts including the Washington Department of Fish and Wildlife, The Northwest
Straits Initiative, the Seattle Aquarium, The SeaDoc Society, NOAA’s Northwest Fisheries Science
Center, and the Reef Environmental Education Foundation (REEF) (Obaza and Tonnes 2017). Project
leaders began the program with the goal of maximizing accurate data collection from across Puget Sound
and not achieving a set requirement of citizen diver participation. That guiding principle has allowed for
plasticity in program development, to go where the interested divers are and build a collaborative
relationship. Therefore, the program does not exist as a pure citizen science venture; diver experience
levels range from highly capable recreational divers to field biologists with decades of experience. All
participants collect data using the same methodology. This spectrum of expertise not only allows citizen
divers the gratification of their contributions being on equal footing as professionals, but also presents
unique data comparison opportunities as the database grows.

As the program has grown over time, the ability to address an expanding range of questions has
developed. For example, Puget Sound and the Strait of Georgia are components of the larger Salish Sea
Ecosystem (US Board on Geographic Names 2009; MacCready et al. 2020), as formally recognized by
both the US and Canada, and to investigate only one of these regions will inevitably yield conclusions
based on incomplete data. The need for coordination across borders to most effectively manage shared
marine resources has long been recognized (Fraser et al. 2006). Ocean Wise, a research Institute in
Vancouver, Canada, conducts a similar rockfish survey program in the Strait of Georgia. The methods
align, as does the incorporation of data from citizen surveyors, making data comparable across regions. In
order to better understand rockfish dynamics across the Salish Sea, Ocean Wise and NOAA agreed to
collaborate on this project in 2020. Without continued growth of the program, this collaboration would
not have been possible. Database expansion to date may also allow researchers to answer whether any
given survey year is a jackpot for YOY recruitment. Identifying drivers of rockfish recruitment is a
primary goal of this project and the first step is to quantitatively classify jackpot years.

This report serves to evaluate the survey program itself, along with the data it provides. Preliminary data
on overall survey effort, participation of partner groups, along with the validity of the data they collect,
are presented to assess the need for any changes in program implementation. Trends in YOY abundance,

                                                                                                               5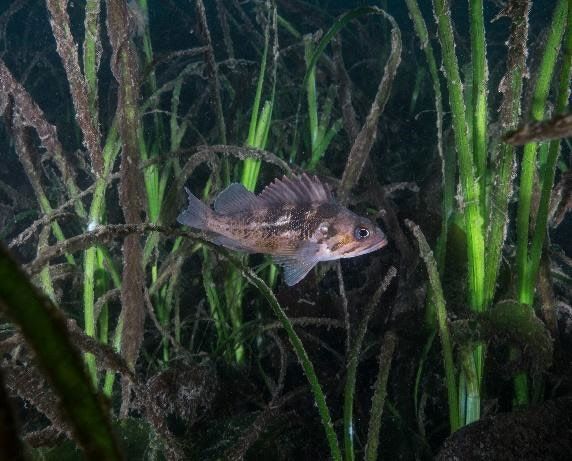
comparison across regions, and, to the best of these data’s capacity, determination as to whether 2020 was
a jackpot year for rockfish recruitment, are also highlighted to provide the most up-to-date information on
a key element for rockfish recovery in the Salish Sea.

Methods
Site Selection
Survey sites in Puget Sound were initially chosen for presence of suitable YOY habitat, ease of access,
and popularity as regularly visited dive sites. This approach was adopted to encourage divers to
consistently survey the same sites throughout the year and improve temporal coverage at select sites. Over
time, as both citizen and professional diver survey effort increased, additional sites were added within
each of five sub-basins (Central Sound, South Sound, Whidbey, San Juan Islands, and Hood Canal). The
purpose of adding sites was twofold: 1) to increase spatial coverage and capture regional trends in
recruitment and, potentially, inter-basin dynamics, and 2) to expand the diversity of habitat types within
each region known to support YOY, including kelp forests, eelgrass beds, rocky and artificial reefs, and
other beneficial geological features (e.g., rugose soft-bottom). Not all sites and habitats are equally used
by rockfish, oftentimes for reasons that are not fully understood. However, it may still be useful to include
these sites to evaluate if YOY rockfish ever arrive in the case of a major recruitment event or changes in
species distribution. Figure 2 identifies all sites within the southern Salish Sea surveyed from 2015 to
2020, with point size corresponding to annual effort and color to sub-basin surveyed.

        Figure 2. Young-of-year rockfish survey locations in the southern Salish Sea from 2015-2020. Point size
        indicates annual effort and color corresponds to basin.

                                                                                                                  6
Surveys
Surveyors collect data using a timed roving dive approach in discrete habitat and depth bins. Tasks may
be divided among a buddy pair, where one member records fish and the other tracks habitat, depth, and
survey time, or completed entirely by a single diver. The diver recording fish documents all visible
YOY/juvenile rockfish (individuals < 10 cm) within 1 m on either side of their swimming path and 1 m
above the substrate. This survey is timed and lasts as long as a single habitat and depth bin is being
searched. During 2015, the swimming path was a five minute transect (i.e., a single heading) while in
2016-20 divers conducted transects of any length as long as novel habitat was still being searched. If
habitat is patchy (i.e., areas of one habitat type are separated by a distinctly different habitat type), distinct
patches are counted as separate surveys. If macroalgae or eelgrass are being surveyed, the diver lightly
disturbs the vegetation to better expose individuals. If rocky substrate is present, the surveyor should use
a flashlight to illuminate potential hiding places. YOY rockfish do not need to be recorded to species.
Instead, they are classified into one of four morphological categories based on NOAA’s YOY survey
guide (Appendix 1): 1) deep body with dorsal spot; 2) deep body without dorsal spot; 3) elongate body
with dorsal spot; and 4) elongate body without dorsal spot. If the diver cannot classify the individual to
one of those groups, “YOY” is simply noted.

As each survey is completed in an area dominated by a single habitat type, the sampler may record
several categorical metrics to further describe each habitat type encountered (Table 1). These metrics are
general and may be completed following the dive, particularly if discussion between a buddy pair may
clarify assignment. Video or still images may also be taken to improve evaluation of habitat type metrics.
Survey depths are recorded and contained within one of three bins: shallow (18m). Therefore, each survey will have an associated habitat type and depth bin.

Table 1. Habitat type, feature, and metrics used to characterize habitat for rockfish transects.

 Habitat Type          Habitat Feature                                        Metrics
 Rocky Reef            Relief (height in meters above seafloor)               Low (1)
                       Benthic macroalgae abundance                           Common, Sparse, Rare to Non-Existent

 Eelgrass              Density (# turions / m2)                               High (>10); Medium (1-9); Low (100); Medium (20-100); Low (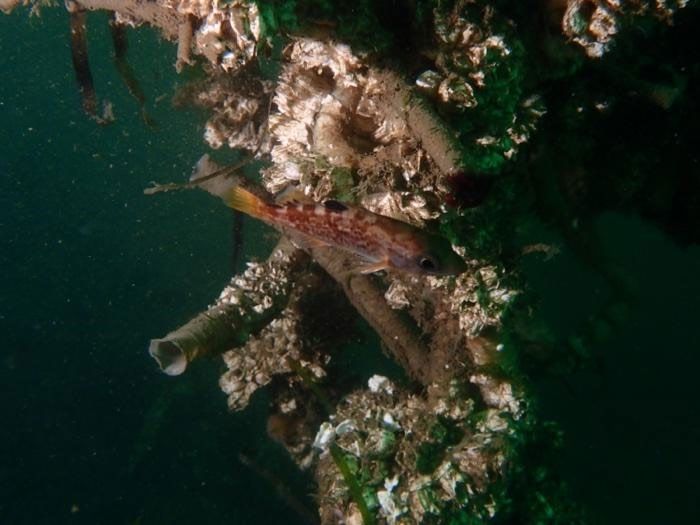
process involved a survey dive where participants would locate and accurately identify YOY to the more
experienced surveyor, as well as show methodological proficiency.

Data Analysis

Survey Effort, Fish, and Habitat

Survey effort, or the total bottom time expended actively searching for YOY, was evaluated at multiple
levels. Survey times were summed for each year and evaluated by: 1) surveyor type (citizen or
professional); 2) sub-basin; 3) habitat type; 4) month; and 5) region (Puget Sound and Strait of Georgia).
The response variable of these surveys is encounter rate, calculated as the number of YOY observed per
minute of survey time. Encounter rates were evaluated against several explanatory variables including,
season (monthly), year, sub-basin, habitat type, depth bin, and morphological type (body shape and
presence/absence of dorsal spot).

To assess an additional potential explanatory factor, encounter rates were compared with tidal current
data. NOAA maintains a series of buoys in the survey area that collect data on current speed
(https://tidesandcurrents.noaa.gov/noaacurrents/Stations?g=698). The absolute value of the mean
maximum ebb current or mean maximum flood current were averaged across the entire year of 2020 to
return a single current speed representative of relative tidal energy at each site. Buoys were selected by
proximity to survey sites and are considered the best representation of tidal energy available. Current data
calculated from the above were merged with the mean YOY encounter rate by site for all years combined.
These data were then evaluated by sub-basin and habitat type.

Data Integration with Ocean Wise

Since 2005, the Ocean Wise Research Institute has led a
citizen rockfish survey effort in the months from August to
October. Data are collected by SCUBA divers swimming
timed roving surveys. All recorded rockfish are identified
to species and broken into age classes of adult (> 20 cm),
juvenile (10-20 cm) and baby (< 10 cm). Results are split
regionally; a total of twenty-eight survey regions stretch
from British Columbia’s central coast to Puget Sound and
Washington’s outer coast. Within the Salish Sea, twenty
regions are identified on the Canadian side and four on the
US side. Distinct habitat types and depth bins are not
included as part of the survey, though surveys on soft
bottom habitat are discouraged. Encounter rates are
recorded as rockfish observed per survey hour.

Because surveys by Ocean Wise and those in the present
study return encounter rate as their response variable, data
integration is mathematically straightforward. In order to
standardize data, results from Ocean Wise were filtered to
include only YOY rockfish and surveys from the Strait of
                                                                  Figure 3. Delineation of survey effort
Georgia, and their results were converted to YOY observed
                                                                  between Ocean Wise in Strait of Georgia
each minute. Also, species recorded by Ocean Wise were            and NOAA in South Salish Sea
converted to morphological group. NOAA data were filtered
to include only eelgrass, kelp forest, and reef habitats, as

                                                                                                             8
well as only those surveys conducted during August through October (approximately 33% of transects).
Years 2015 and 2016 of the NOAA data were excluded from comparison because low survey effort at the
program’s outset may bias results. Note, data filtering was conducted for comparison with Ocean Wise
surveys only, and all other analyses in this report include the full complement of NOAA surveys. NOAA
and Ocean Wise data were combined to examine survey effort and mean YOY encounter rates by region
over time and encounter rates by morphological group.

Citizen Scientist Data Viability

During the 2019 and 2020 seasons, two new protocols were implemented to evaluate the accuracy of
YOY identification and encounter rates using data collected by citizen surveyors. First, the lead project PI
evaluated photos or videos of YOY shared by citizen divers. Each diver submitted media along with the
identification and number of YOY in the photo/video. Where possible, the diver would identify to
species, otherwise YOY were classified based on morphological type or simply as “YOY.” Photos and
identification data were assessed by the lead project PI for accuracy using a simple “Yes” or “No”
classification scheme.

The second evaluation protocol involved a comparison among data collected by a team of professional
divers and a separate team of citizen divers for surveys at the same site and on the same day. Because
these events were rare, there were insufficient data to conduct a formal analysis, though a coarse
comparison provided some useful information.

Influence of Outreach on Citizen Dive Effort

Outreach to partner groups in the form of presentations, guided dives, and meeting attendance was used to
generate interest in program participation. Events performed for consistently participating groups were
summed over each year and compared with the total dives each group completed in that year for 2015-
19. Not included were emails, phone calls, and development of outreach materials. Those aspects of
outreach take time and undeniably contribute to participation, but quantifying them is substantially more
difficult as calls and emails were not logged and several prominent outreach materials were distributed in
2019, leaving too little time to analyze their effectiveness. The relationship between outreach and dive
effort was quantified using a linear regression. Because project leads have noticed long-term relationships
are also important in driving participation, a cumulative effort regression was also calculated.

Results
Survey Effort
Survey time increased annually in the south Salish Sea for both citizen and professional scientific divers,
with the exception of 2020 for professional surveys, due to SARS-CoV2 Pandemic travel restrictions
(Figure 4A). This trend in increased survey effort was consistent with the total number of transects
completed, which increased from 185 in 2018 to 348 in 2019, with a small decrease to 335 in 2020. Effort
data from Ocean Wise, which has been conducting rockfish surveys since 2005, show a similar striking
trend of increased survey effort over time in the Strait of Georgia (Figure 4B). The highest proportion of
surveys in the southern Salish Sea were completed in the Central and San Juan sub-basins for all years
(Figure 5A). Unfortunately, partners were unable to conduct annual surveys in the San Juan Islands in
2020, also due to COVID restrictions. Kelp forests were the least sampled habitat from 2016 to 2020,
remaining relatively low in effort, while survey time in all other habitat types increased. Artificial reefs

                                                                                                           9
continued to receive the highest amount of effort, likely owing to the number of popular dive sites
featuring these structures (Figure 5B).

  A                                                            B

Figure 4. Survey effort (minutes) for both citizen and professional scientific divers in South Salish Sea from 2015 to
2020 (A) and by regional survey program (B). Note the difference in both x- and y-axis scales.

Fish and Habitat                                           A

In 2019 and 2020, a total of 1,081 total YOY were
observed, as compared with 669 total YOY
recorded during the first four years of the program
(2015-18). The majority of these fishes (82.2%) for
all years were in the deep body with no dorsal spot
category, followed by elongate with no dorsal spot
(8.6%). The deep body with no dorsal spot category
comprises some of the most common shallow,
nearshore, benthic rockfish species (e.g., copper,
quillback, and brown; Appendix 1). Though
rockfish may be found throughout the calendar
year, an increase in encounter rate is evident in the   B
summer and fall months, as well as March (Figure
6). A dip in August and September may be the
result of annual intensive surveys in the San Juan
Islands that frequently record few YOY rockfish,
introducing spatial bias and leading to an artificially
low overall encounter rate when data are
aggregated.

                                                               Figure 5. Relative effort as a percent of survey
                                                               minutes in each basin (A) and by survey time for each
                                                               habitat type (B) in Puget Sound, WA from 2015-2020.

                                                                                                                   10
Figure 6. Change in mean YOY rockfish encounter rate (solid black line) averaged across all years (2015-20) and
months contrasted with survey effort (broken line) for surveys in Puget Sound, WA. Error bars for encounter rate are
standard error.
Encounter rate was most consistent in the Central and San Juan sub-basins (Figure 7A), possibly resulting
from both site familiarity due to repeat visits (Figure 2) and higher sampling effort prior to 2020 (Figure
4A). Encounter rate in both the San Juan and Hood Canal sub-basins remains very low. Annual trips to
the San Juan Islands consisting of 2-3 consecutive dive days by at least two surveyors encountered at
most four YOY. This result is curious given the extensive natural reef habitat in the region, considered
high quality rockfish habitat. Hood Canal consistently has the fewest encounters of YOY, with two being
the greatest number recorded in a single year, though survey effort in that basin has been limited to date.
YOY were encountered most frequently in artificial reef habitat in all but one year, though it is
noteworthy that YOY were found in all sampled habitats (Figure 7B). Also, kelp forests, often considered
high quality YOY habitat, exhibited low encounter rates. Encounter rate was higher than expected in soft-
bottom habitats, as those areas lack rigid physical structure that provides shelter.
A B
Figure 7. Mean YOY rockfish encounter rate by basin (left) and major habitat type (right) in Puget
Sound, WA for all years (2015-20).
11An analysis of mean YOY encounter rate by site for all years surveyed and current speed indicates that,
except for one site, YOY are less frequently encountered at sites with a mean current speed greater than
0.75 knots (indicated by the solid vertical line in Figure 8A; t = 2.82, df = 55.8, p < 0.01). Mean
encounter at sites with average maximum currents less than 0.75 knots was 0.11 YOY/minute +/- 0.13
YOY/minute (standard deviation) and 0.03 YOY/minute +/- 0.09 YOY/minute at sites greater than 0.75
knots. One outlier site, Keystone Jetty, located within the Whidbey basin, which has a mean current speed
of 3.12 knots, also had one of the highest encounter rates (0.46 YOY/minute) among all years. Keystone
Jetty is also the only artificial reef site surveyed in an area with a mean current speed greater than 0.75
knots.
A B
Figure 8. Young-of-year rockfish encounter rate plotted against mean current speed in knots (determined from the
nearest NOAA buoy) in the southern Salish Sea. Points correspond to mean encounter rate among all years (2015-
2020) for a single site grouped by basin (A) and habitat type (B). The solid vertical line in A represents 0.75 knots.
Note that a single site may contain multiple habitat types surveyed, thus, encounter rates by basin (A) and habitat
type (B) may not be equal.
Regionally, YOY rockfish encounter rates among Puget Sound and the Strait of Georgia are similar from
2017-19, but dramatically increase in the Strait of Georgia in 2020 (Figure 9A). An analysis of encounter
rate broken down by region and morphological type shows that elongate YOY with no dorsal spot are
responsible for that spike (Figure 9B). The large standard error as compared with other years in both
regions suggest it may be a small subset of samples that lead to such a high mean encounter rate. Further
investigation found that seven surveys, of the 127 total conducted in the Strait of Georgia in 2020,
recorded between 500 and 4,000 YOY widow rockfish (Sebastes entomelas).
12A B
Figure 9. Mean young-of-year rockfish encounter rate between the two regions (Puget Sound and the Strait of
Georgia; A) and among four morphological groups based on body shape and presence/absence of a dorsal spot (B)
from 2017 to 2020.
Citizen Scientist Data Viability
A group of five citizen surveyors submitted photos and videos depicting a total of 27 YOY. Each diver
identified at least three YOY among their photos and all surveyors identified YOY in photos with 100%
accuracy. Identifications included “unidentified YOY,” particularly for very small individuals or in
videos, by morphological type (e.g., “deep body, no spot;” Figure 10A) or to species (Figure 10B).
A B
Figure 10. A YOY rockfish accurately identified as "Deep body, no spot" by photographer Jerry Dollar (A), and a
yellowtail YOY identified by photographer Edgar Graudins (B) in Puget Sound, WA in 2019.
Only three transects were conducted that met the strict location and temporal proximity requirements for
comparisons between professional and citizen surveyors. The first was at Fox Island West Wall and the
second was artificial structure and eelgrass habitat at Edmonds Underwater Park. In all cases, the
professional recorded more YOY than the citizen, with a difference in encounter rate of 0.09
YOY/minute.
Influence of Outreach on Citizen Dive Effort
A strong relationship exists between annual outreach effort and dive participation (Figure 11A), though
the fit is stronger using cumulative effort (Figure 11B). Regression line slopes are 6.49 for yearly
outreach and 1.88 for cumulative outreach. Therefore, over the range of outreach for which we have data,
13one outreach event in a year leads to a little more than six additional dives while one more cumulative
outreach event adds nearly two. Splitting the effect of cumulative outreach effects on specific
participating groups shows that it took between three and five total outreach events for a group’s
participation to elevate (Figure 12).
A B
F1,4 = 23.41 F1,4 = 63.45
p = 0.008 p = 0.001
R2 = 0.93
R2 = 0.82
Figure 11. Plots of outreach effort against dive activity for A) events in each year and B) cumulative effort
throughout the project summed for all participating groups from 2015-20. Each point represents a single year.
Figure 12. Plot of cumulative outreach effort of project PIs and the number of dives conducted annually by four
prominent participating citizen survey groups from 2015-20. Each point represents a single year of dives for each
corresponding organization.
Was 2020 a Jackpot Year?
By three different metrics, 2020 was not a jackpot year for rockfish recruitment in Puget Sound.
Encounter rate in 2020 was not higher than the mean across all other survey years (baseline) in three of
four sub-basins (Figure 13A). The fifth sub-basin, San Juan Islands, was not included given its low effort
in 2020 resulting from COVID restrictions. Whidbey Basin did exhibit a higher encounter rate in 2020,
14though was within a standard error of the baseline. Divers were more likely to encounter YOY in
Whidbey Basin and South Sound, but less likely in Hood Canal and Central Sound (Figure 13B). Deep
body YOY without a dorsal spot, the most common morphological type throughout all surveys, were
substantially less frequently encountered in 2020. Elongate YOY with a dorsal spot, specifically
yellowtail and black rockfish, were more frequently encountered in 2020. While some metrics of YOY
recruitment were greater in 2020, more were roughly even or below baseline, suggesting 2020 was not an
overall jackpot recruitment year.
A B
C
Figure 13. Comparison of YOY trends between
2020 and a baseline, defined as the mean from
all other years of the program. Plots include A)
encounter rate by sub-basin B) encounter
frequency by sub-basin and C) encounter rate by
morphological type. Error bars are standard
error. The San Juan sub-basin is not included
given low effort in 2020 due to COVID
restrictions
Discussion
Survey Effort, Fish and Habitat
Now in its sixth year, the southern Salish Sea YOY survey effort continues to grow, more effectively
meeting its goals of providing robust data for recovery applications and engaging divers within the region.
A positive sign of program health is the continued dedication of participants, despite the challenges
presented by the SARS-CoV2 pandemic. Though project leads were unable to conduct several trips or in-
person outreach, partners still frequently got in the water to [safely!] count fish. Effort among partners
increased to its greatest extent in the short history of this program. However, the focus of surveys remains
in artificial reef habitats. This trend makes sense for several reasons: artificial reefs provide a higher
likelihood of seeing charismatic fauna than many nearby habitats (e.g., relatively featureless soft-bottom),
15these reefs are often in close proximity to facilities that promote dive activities (e.g. parking, restrooms,
and shoreline access), and, therefore, these sites may be more frequently promoted by local dive shops,
online dive guides, etc. To be clear, the authors believe data from artificial reefs are valuable and this
effort would be lacking without them. These habitats are often used by adult rockfish and this study has
found many YOY rockfish recruiting to them. However, they make up a very small subset of the overall
habitat available in Puget Sound. Additional effort on natural substrates, such as reefs and kelp forests,
would be helpful. The authors recognize diving in these areas may be challenging from lack of access,
along with overall reductions in kelp coverage (Dunagan 2018; Berry et al. 2021). Similarly, much of the
survey effort is focused in Central Sound, where greater population density and NOAA infrastructure are
located. To create a more comprehensive review of rockfish recruitment in Puget Sound, this program
will need to grow survey efforts in less-visited sub-basins and among more natural habitats while
maintaining, if not continuing to grow, present levels in Central Sound. Project leads are addressing this
issue by providing charter opportunities and scheduling group dives for partners at less accessible sites.
That outreach has a positive effect on participation validates the utility of these efforts. The most
interesting trend in the data shows that consistent contact needs to occur with groups if reliable
participation is desired, supporting a grass-roots approach to program construction. Emerald Dive Club
and Harbor WildWatch have both passed an outreach threshold while Point Defiance Zoo and Aquarium
appears poised for a strong increase in the near future. Despite a strong relationship between outreach
effort and citizen survey dives, many caveats exist in this exercise. For example, no two organizations are
exactly the same. Lighthouse Dive group’s participation is led by a single instructor using this work as a
task for advanced classes and this difference, compared with more traditional non-profits and dive clubs,
may explain variable trends. The program is also still young and the group with the longest participation
(Harbor WildWatch) has only five data points. Therefore, while the relationship of outreach effort to all
groups may appear tight, a great deal of intergroup variability exists and must be taken into account when
evaluating success and next steps for this program.
YOY Encounter rate was often higher in summer and fall months, which is consistent with Greene and
Godersky’s (2012) survey of larval rockfish in Puget Sound. However, Greene and Godersky (2012)
found larval rockfish abundance in surface waters fell to near zero from November through February,
while the encounter rate of settled YOY in the present study was greater than zero during that time. This
comparison shows larval rockfish may have a more discrete duration in the plankton but use nearshore
habitats to mature over longer periods. Furthermore, because this study uses 10 cm as the cutoff for YOY,
it is possible some rockfish from the previous year class are under that length and counted during surveys.
The encounter rate data provided in the present study are complementary to planktonic larval abundance
and may eventually be used to examine discrepancies. That is, if larval rockfish are abundant in a given
year, but nearshore surveys report average encounter rates in some or all habitat types/regions/depth
zones, researchers could examine that bottleneck. Therefore, continued survey effort throughout the year
provides data on a key developmental stage and fills a data gap in the rockfish life cycle.
That YOY rockfish are encountered more frequently on artificial reefs is not surprising. These structures
are often placed amidst low-relief, soft-bottom habitat and may represent the only refuge for some
distance, serving to aggregate fish. Whether fish that settle on these habitats would have settled elsewhere
or failed to find appropriate habitat and died is unknown, thus effects on overall population demographics
cannot be examined here. Please note that this work is in no way making a statement on the conservation
value or efficacy of artificial reefs. Artificial reefs are also often less expansive than natural habitats, such
as eelgrass beds and rocky reefs, allowing surveyors to examine them more intensely. Similarly, the likely
smaller refuge area available on artificial reefs may increase density and subsequently, encounter rate.
There may also be spillover from artificial reefs onto surrounding soft bottom areas, resulting in elevated
YOY encounters in soft bottom habitat. This inflation may occur because soft bottom surveys are often
done in the vicinity of a reef structure (divers may perform a soft bottom survey on the way to or from a
16reef or adjacent to that reef if multiple divers are present) and an additional habitat category to capture
this reef proximity effect may be necessary in the future. These high encounters on artificial reefs and soft
bottom habitat show care must be taken in interpreting these data.
Encounter rates in the San Juan Basin continue to be low. These results are not for lack of effort, given
that the region has received the second most survey time, behind Central Sound. While adult rockfish
populations are low throughout the majority of the southern Salish Sea, recent surveys have recorded the
presence of adults in the region (Pacunski et al. 2013; Blaine et al. 2020; Pacunski et al. 2020), so low
YOY encounters are not for lack of a source. It is possible the extensive natural reef systems in the region
provide an abundance of high-quality habitat for a limited number of recruits, driving down encounters.
Other regions, such as Central Sound, have very little natural reef within SCUBA depth and the scarce
high-quality habitat (i.e. artificial reefs) may accumulate more YOY, inflating encounters. In addition,
surveys in the San Juan Islands have been limited to intense but short-term sampling events. A more
thorough survey effort throughout the year may increase encounter rate. Regardless of the cause, the low
encounter rates in an area with lower population density is curious and worth further investigation.
Data Integration with Ocean Wise
A review of survey effort over time reveals that both programs have grown support as they have matured
(Figure 3B), suggesting interest in rockfish conservation and that citizen science surveys are considered
worthwhile endeavors across international borders. Encounter rates in both regions are similar from 2017-
19, but dramatically increase in the Strait of Georgia in 2020 (Figure 9A). Encounter rate broken down by
region and morphological type shows that elongate YOY with no dorsal spot are responsible for that
spike (Figure 9B). The large standard error as compared with other years in both regions suggest it may
be a small subset of samples that led to such a high mean encounter rate. Further investigation found that
seven surveys, of the 127 total conducted in the Strait of Georgia in 2020, recorded between 500 and
4,000 YOY widow rockfish (Sebastes entomelas). These anomalously high encounters, located entirely in
the northeast Vancouver Island sub-region and collected between October 2 and October 4, are evidence
of the ephemeral nature of YOY rockfish and highlight the importance of increased survey efforts
undertaken by citizen science projects. Both regions exhibit fluctuations in encounter rate over time,
though deep body rockfish with no dorsal spot are most frequently encountered of all four morphological
groups across regions, and elongate rockfish with a dorsal spot are more frequently encountered in the
Strait of Georgia than in the southern Salish Sea.
This preliminary data integration is an important and necessary step in improving YOY rockfish
monitoring in the Salish Sea. As both databases expand, particularly in the southern portion of the survey
area, the questions that can be asked about rockfish recruitment will expand and the answers will become
more reliable. The authors are deeply grateful for Ocean Wise staff’s commitment to rockfish recovery
and coordination!
Citizen Scientist Data Viability
Preliminary review of data submitted by citizen partners suggest a high level of identification accuracy
and general consistency with professional surveys. While these are encouraging results, they should be
interpreted cautiously. Only a subset of surveyors submitted images and only a tiny fraction of all surveys
had appropriate time and location features for comparison with project leads. The goal of these exercises
is to improve data accuracy. The handful of comparison transects conducted show that project leads
recorded more YOY than citizen partners, resulting in a higher detection probability by professionals at
lower abundance levels. This disparity may be especially crucial when considering detection of rare
species, such as ESA-listed yelloweye and bocaccio. If that trend holds through many more comparison
17transects, a correction factor may be added to results or training may be adapted to help partners better
locate YOY. Regardless, review of data from citizen partners thus far suggest they are providing accurate
data for this program.
Applications
As this program expands, the applications for its data increase. While these YOY data are unique, they
will be more powerful when used in conjunction with other sources of data. For example, one use for
these data is to inform a model (multivariate autoregressive state space model) that utilizes other sources
of rockfish data, to improve overall abundance estimates for rockfish in Puget Sound (Tonnes 2016;
Tolimieri et al. 2017). This modeling exercise was already completed without YOY encounter data in
2016 and the additional source of data will make the pursuant estimates of rockfish abundance more
robust. These results will be essential to determining the effectiveness of rockfish management actions. If
this program expands to such a point that sufficient data are collected annually across season, region, and
habitat type, a baseline will be created for YOY in Puget Sound. Deviations from this baseline may be
quantified and could not only determine when the entire Sound has a strong year, but potentially detect
settlement booms specific to regions and habitat types. The implications of these results for understanding
rockfish biology and conservation are clear: more specific information on recruitment can not only help
determine the effectiveness of existing management but tailor new management approaches to be more
effective.
Conclusions
Setting out to quantify YOY rockfish recruitment dynamics in an area as large as the southern Salish Sea
is an ambitious goal and a great deal of expansion will be required to make meaningful conclusions
regarding recruitment dynamics. The journey towards this goal is already providing meaningful insights
into rockfish recruitment and the use of citizen science to support robust data collection. Sustained effort
is required to form a relationship with a partner group and data contribution should be expected on the
order of years, not months. YOY continue to be found primarily in the summer and fall months,
consistent with the literature, but have been documented in every month of the year. Sites that regularly
experience high currents are less likely to yield high encounter rates of YOY. The data also suggest that
2020 was not a jackpot year for YOY recruitment, though every year this program exists the baseline for
annual comparisons will be more accurate. This progress leverages invaluable outreach with citizen
scientists in a key stakeholder group, SCUBA divers. As this program expands over the coming years, it
will be a key part of rockfish recovery.
Acknowledgements
Developing and sustaining a citizen science monitoring program takes a staunch group of supporters and
selfless volunteers. The authors sincerely thank every diver who contributed to this sampling effort,
including: Dan Abbott, Adria Ali, Simon Barley-Greenfield, Brandon Beetham, Todd Bennett, Bill
Berger, Rick Bertram, Debbie Bingham, David Bruce, Brian Bugge, Chanelle Cadot, Jeff Davis, Anya
Dollar, Jerry Dollar, Darah Donohoe, Joe Drelling, “Buoy” Bob Foster, Tai Fripp, Joe Gaydos, Edgar
Graudins, Zach Gwirtz, Deb Halley, Heidi Hart, John Hoover, Shane Izard, Brook Johanson, Michelle
Jones, Chris Kerr, Jon Kimball, Joanne Kirby, Heidi Kirk, David Landis, Tom Larson, John Leatherman,
Austin Lindsey, Joe Mangiafico, Chris McKenna, Glenn McKenzie, Nick Mead, Gillian Milstein, Nate
18Moore, Glenn Morrison, Nima Moughal, Jen Olson, Julienne Pacheco, Kalloway Page, Alex Parker, Amy
Peltonen, John Peltonen, Anthony Pennington, Rick Proto, Allen Raphael, Jason Raphael, Lauren
Rawlins, Myra Reeves, Sam Riley, Chris Roberts, Steve Rounds, Matt Ryan, Hank Scott, Bob Seaman,
Jackie Selbitschka, Matt Shawhan, Josh Sherman, Scott Steinbright, Steve Stolen, Leigh Stone, Ethan
Terry, Briston Trapp, Pam Treischel, Stena Troyer, Mason Ward, Audrey Weaver, Matt Wiley, Heidi
Wilken, Amy Williams, Mikiko Williams, Randy Williams, Gavin Wuttken. The authors also thank
Amanda Weltman at Ocean Wise for coordinating on data delivery and interpretation. Comments from
Dayv Lowry greatly improved the content and readability of the manuscript. Funding for program
implementation was provided by NOAA Fisheries to Paua Marine Research Group through grant
NA20NMF0080324.
19Literature Cited
Andrews, K.S., K.M. Nichols, A. Elz, N. Tolimieri, C.J. Harvey, R. Pacunski, D. Lowry, K.L. Yamanaka and D.M.
Tonnes. 2018. Cooperative research sheds light on population structure and listing status of threatened and
endangered rockfish species. Conservation Genetics 19(4): 865-878
Berry, H.D., T.F. Mumford, B. Christiaen, P. Dowty, M. Calloway, L. Ferrier, E.E. Grossman, and N.R. Van
Arendonk. 2021. Long-term changes in kelp forests in an inner basin of the Salish Sea. Plos One 16(2):
e0229703
Blaine, J., D. Lowry and R. Pacunski. 2020. 2002-2007 WDFW scientific bottom trawl surveys in the southern
Salish Sea: species distributions, abundance and population trends. Report to Washington Department of
Fish and Wildlife FPT 20-01. 237 pp.
Bodilis, P., P. Louisy, M. Draman, H.O. Arceo and P. Francour. 2014. Can citizen science survey non-indigenous
fish species in the eastern Mediterranean Sea? Environmental Management 53: 172-180
Buckley, R.M. 1997. Substrate associated recruitment of juvenile Sebastes in artificial reef and natural habitats in
Puget Sound and the San Juan Archipelago, Washington. Washington Department of Fish and Wildlife
Technical Report RAD97-06. 320 p.
Doty, D.C., R.M. Buckley and J.E. West. 1995. Identification and protection of nursery habitats for juvenile rockfish
in Puget Sound, Washington. Puget Sound Research ’95 Proceedings. Puget Sound Water Quality
Authority, Olympia, WA
Dunagan, C. 2018. Kelp continues steady decline in Puget Sound. Salish Sea Currents.
https://www.eopugetsound.org/magazine/ssec2018/kelp
Endangered and Threatened Species; Removal of the Puget Sound/Georgia Basin Distinct Population Segment of
Canary Rockfish From the Federal List of Threatened and Endangered Species, and Removal of Designated
Critical Habitat, and Update and Amend the Listing Descriptions for the Yelloweye Rockfish DPS and
Bocaccio DPS. 81 FR 43979 (July 6, 2016) (to be codified at 50 CFR 223 and 224)
Endangered and Threatened Wildlife and Plants: Threatened Status for the Puget Sound/Georgia Basin Distinct
Population Segments of Yelloweye and Canary Rockfish and Endangered Status for the Puget
Sound/Georgia Basin Distinct Population Segment of Bocaccio Rockfish. 75 FR 22276 (July 27, 2010) (to
be codified at 50 CFR 223 and 224)
Fraser, D.A., J.K. Gaydos, E. Karlsen and M.S. Rylko. 2006. Collaborative science, policy development and
program implementation in the transboundary Georgia Basin/Puget Sound Ecosystem. Environmental
Monitoring and Assessment 113: 49-69
Goffredo, S., F. Pensa, P. Neri, A. Orlandi, M.S. Gagliardi, A. Velardi, C. Piccinetti and F. Zaccanti. 2010. Unite
research with what citizens do for fun: “recreational monitoring” of marine biodiversity. Ecological
Applications 20(8): 2170-2187
Greene, C., and A. Goderskey. 2012. Larval rockfish in Puget Sound surface waters. Northwest Fisheries Science
Center, NOAA. 16 pp.
LeClair, L., R. Pacunski, L. Hillier, J. Blaine and D. Lowry. 2018. Summary of findings from periodic SCUBA
surveys of bottomfish conducted over a sixteen-year period at six nearshore sites in central Puget Sound.
Report to Washington Department of Fish and Wildlife. 174 pp.
MacCready, P., R.M. McCabe, S.A. Siedlecki, M. Lorenz, S.N. Giddings, J. Bos, S. Albertson, N.S. Banas, and S.
Garnier. 2020. Estuarine circulation, mixing and residence times in the Salish Sea. Journal of Geophysical
Research: Oceans: e2020JC016738
Matthews, K.R. 1990. A comparative study of habitat use by young-of the year, subadult, and adult rockfishes on
four habitat types in central Puget Sound. Fishery Bulletin 88(2): 223-239
20National Marine Fisheries Service. 2017. Rockfish recovery plan: Puget Sound/Georgia Basin yelloweye rockfish
(Sebastes ruberrimus) and bocaccio (Sebastes paucispinis). 152 pp.
Obaza, A., and D. Tonnes. 2017. Results of young of year rockfish surveys in Puget Sound. National Marine
Fisheries Service, West Coast Region Report. 10 pp.
Pacunski, R., D. Lowry, J. Selleck, J. Beam, A. Hennings, E. Wright, L. Hillier, W. Palsson and T. Tsou. 2020.
Quantification of bottomfish populations, and species-specific habitat associations, in the San Juan Islands,
WA employing a remotely operated vehicle and a systematic survey design. Report to Washington
Department of Fish and Wildlife FPT 20-07. 42 pp.
Pacunski, R.E., W.A. Palsson, and H.G. Greene. 2013. Estimating fish abundance and community composition on
rocky habitats in the San Juan Islands using a small remotely operated vehicle. Report to Washington
Department of Fish and Wildlife. 48 pp.
Palsson, W.A., T. Tsou, G.G. Bargmann, R.M. Buckley, J.E. West, M.L. Mills, Y.W. Cheng and R.E. Pacunski.
2009. The biology and assessment of rockfishes in Puget Sound. Washington Department of Fish and
Wildlife Report FPT-09-04. 208 pp.
Ralston, S., K.M. Sakuma and J.C. Field. 2013. Interannual variation in pelagic juvenile rockfish (Sebastes spp.)
abundance – going with the flow. Fisheries Oceanography 22(4): 288-308
Sakuma, K.M., S. Ralston and V.G. Wespestad. 2006. Interannual and spatial variation in the distribution of young-
of-the-year rockfish (Sebastes spp.): expanding and coordinating a survey sampling frame. CalCOFI Report
47: 127-139
Tolimieri, N., E.E. Holmes, G.D. Williams, R. Pacunski and D. Lowry. 2017. Population assessment using
multivariate time-series analysis: A case study of rockfishes in Puget Sound. Ecology and Evolution, 7(8):
2846-2860
Tonnes, D., M. Bhuthimethee, J. Sawchuck, N. Tolimieri, K. Andrews and K. Nichols. 2016. Yelloweye rockfish
(Sebastes ruberrimus), canary rockfish (Sebastes pinniger), and bocaccio (Sebastes paucispinis) of the
Puget Sound/Georgia Basin: 5-year review: Summary and evaluation. NOAA West Coast Region,
Protected Resources Division. NMFS ARN# 151412WCR2015PR00074
United States Board on Geographic Names. 2009. Geographic Names Post Phase I Board/Staff Revisions,
November 12, 2009. geonames.usgs.gov/apex/f?p=138:3:::NO::P3_FID,P3_TITLE:2573411,Salish%20Sea
Ward-Paige, C.A. and H.K. Lotze 2011. Assessing the value of recreational divers for censusing elasmobranchs.
PLoS One 6(2011) p. e25609
West, J.E., R.M. Buckley, and D.C. Doty. Ecology and habitat use of juvenile rockfishes (Sebastes spp.) associated
with artificial reefs in Puget Sound, Washington. Bulletin of Marine Science 55(2): 344-350.
Williams, G. D., P.S. Levin, and W.A. Palsson. 2010. Rockfish in Puget Sound: An ecological history of
exploitation. Marine Policy 34(5): 1010-1020
21You can also read