Reservoir Pressure and Subsidence Groningen Field update for Production Profile GTS - raming 2021 - March 2021
←
→
Page content transcription
If your browser does not render page correctly, please read the page content below
Seismic Hazard and Risk Assessment of Production Profile “GTS raming 2021”
 for the Groningen field - March 2021

 Reservoir Pressure and Subsidence
 Groningen Field
 update for Production Profile
 GTS - raming 2021

March 2021
Seismic Hazard and Risk Assessment of Production Profile “GTS raming 2021”
 for the Groningen field - March 2021

© EP2021
 Dit rapport is een weerslag van een voortdurend studie- en dataverzamelingsprogramma en bevat de stand
 der kennis van januari 2021. Het copyright van dit rapport ligt bij de Nederlandse Aardolie Maatschappij B.V.
 Het copyright van de onderliggende studies berust bij de respectievelijke auteurs. Dit rapport of delen daaruit
 mogen alleen met een nadrukkelijke status-en bronvermelding worden overgenomen of gepubliceerd.

 2
Seismic Hazard and Risk Assessment of Production Profile “GTS raming 2021”
 for the Groningen field - March 2021

Contents
Samenvatting........................................................................................................................................... 4
Executive Summary ................................................................................................................................. 5
1 Introduction..................................................................................................................................... 6
 1.1 Previous Hazard and Risk Assessment Reports....................................................................... 6
 1.2 Expectation Letter (verwachtingenbrief) 2021 ....................................................................... 6
 1.3 TNO Hazard and Risk Assessment ........................................................................................... 6
2 Reservoir and Pressure Modelling................................................................................................... 9
 2.1 Production: Demand profiles GTS-raming 2021...................................................................... 9
 2.2 Spatial distribution of production ........................................................................................... 9
 2.2.1 Production regions .......................................................................................................... 9
 2.2.2 Start-up sequence ......................................................................................................... 10
 2.3 Modelling setup..................................................................................................................... 11
 2.4 Forecast Scenarios................................................................................................................. 11
 2.4.1 Regional distribution of volumes .................................................................................. 11
 2.4.2 Pressure Maps ............................................................................................................... 13
3 Subsidence..................................................................................................................................... 21
 3.1 Compaction model ................................................................................................................ 22
 3.1.1 Input to compaction model........................................................................................... 22
 3.1.1.1 Pressure scenario for the reservoir and laterally connected aquifers ...................... 23
 3.1.1.2 Reservoir Thickness ................................................................................................... 23
 3.1.1.3 Rock compressibility.................................................................................................. 23
 3.2 Influence model..................................................................................................................... 24
 3.3 Uncertainty estimation.......................................................................................................... 24
 3.4 Subsidence forecast .............................................................................................................. 25
4 References..................................................................................................................................... 29
Appendix A – Relevant Correspondence............................................................................................... 31
 Expectation Letter (Verwachtingenbrief) – 1st February 2021.......................................................... 31
Appendix B – Glossary of Terms............................................................................................................ 38
Appendix C – List of Abbreviations........................................................................................................ 43

 3
Seismic Hazard and Risk Assessment of Production Profile “GTS raming 2021”
 for the Groningen field - March 2021

Samenvatting

 4
Seismic Hazard and Risk Assessment of Production Profile “GTS raming 2021”
 for the Groningen field - March 2021

Executive Summary
The main conclusions from this report are listed below for each Chapter.

Introduction
 ◼ On instruction of the Minister of Economic Affairs and Climate Policy NAM has prepared 10
 Hazard and Risk Assessments (HRAs) since 2012. This year is the first time the HRA is prepared
 by TNO.
 ◼ NAM delivers the reservoir pressure and subsidence forecasts. Reservoir pressure forecasts
 were delivered to TNO on February 15th as input for the HRA.

Reservoir and Pressure Modelling
 ◼ The minister has requested assessments based on a single Operational Strategy (OS) and for
 two temperature scenarios: an average and a cold gas year 2021/2022. For these scenarios
 demand profiles have been provided to NAM (GTS-raming 2021).
 ◼ The Operational Strategy is in line with OS2 as proposed by NAM last year in the HRA2020. The
 OS2 start-up sequence applies until April 1st 2022. Thereafter, production volumes are equally
 distributed over regions South-East and South-West.
 ◼ Forecasted reservoir pressures at the start of gas-year 2021/2022 are slightly higher than
 forecasted for the HRA2020 (based on GTS-raming 2020). This is due to higher than average
 ambient temperatures in 2020 and additional measures to reduce Groningen production
 volume.
 ◼ Forecasted pressures in the active production regions based on the new estimate (GTS-raming
 2021) are slightly lower in the period 2025-2027 than forecasted in 2020 (based on GTS-raming
 2020). This is the result of the small additional production volumes associated with the
 minimum flow requirement to ensure availability of gas production capacity. The pressure
 differences are negligible after 2032.

Subsidence
 ◼ The compaction/subsidence model was calibrated using results from 16 levelling campaigns
 spanning from 1964 to 2018.
 ◼ Subsidence forecasts were made for 2025, 2031 and 2050 based on GTS-raming 2021.
 ◼ In 2031 around 42 cm of surface subsidence (since start of production) is expected in the
 deepest point of the subsidence bowl, with a P95 uncertainty range up to 3 cm.

 5
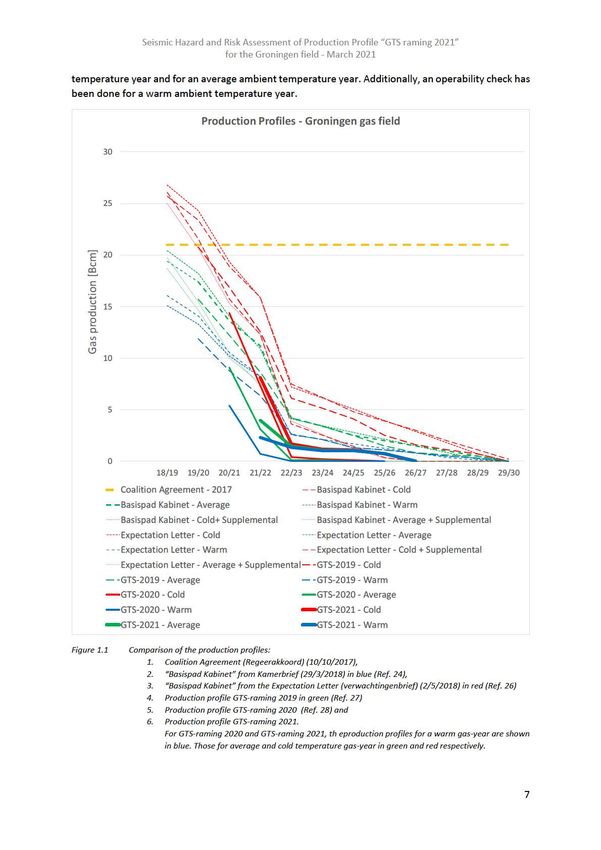
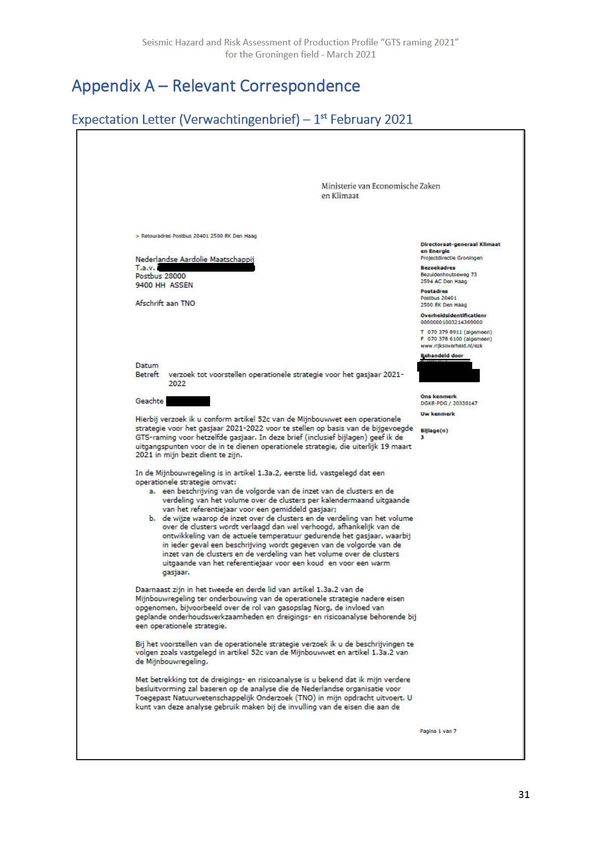
Seismic Hazard and Risk Assessment of Production Profile “GTS raming 2021”
 for the Groningen field - March 2021

1 Introduction
1.1 Previous Hazard and Risk Assessment Reports
Since 2012 NAM has prepared Hazard and Risk Assessments (HRA) for different production scenarios.
Table 1.1 provides an overview of these HRA reports. Currently, the hazard and risk assessment for
induced earthquakes in Groningen is updated annually. The update is initiated each year with an
expectation letter from the Minister of Economic Affairs and Climate Policy sent on the 1st February.
Six weeks later a hazard and risk assessment based on the instructions and production scenarios
presented in this expectation letter would be submitted to SodM and the ministry. In the gas
production profile, the actual production until the previous 1st January is used and for the remainder
of the gas-year of publication of the report (from 1st January to 1st October) the production is based on
the latest ministerial decision.

In figure 1.1 the annual production rates for the previous production profiles; (1) Coalition Agreement,
(2) Basispad Kabinet March 2018 Letter, (3) Basispad Kabinet Expectation May 2018 Letter, (4)
Expectation Letter February 2019, (5) Expectation Letter February 2020 and (6) Expectation Letter
February 2021 are compared. The comparison is shown in this figure for cold, average and warm year
gas demand.

1.2 Expectation Letter (verwachtingenbrief) 2021
In accordance with article 52c of the Mining Law, NAM proposed in previous HRA reports two
operational strategies based on the premises for these strategies contained in the expectation letter.
Due to the very low remaining production, differences in the operational strategy will only have a very
minor impact on hazard and risk. The assessment of risk and building damage will in the coming years
be dominated by the equilibration of reservoir pressure between the North-Western area and the
South-Eastern area of the field. In this report the development of reservoir pressure and subsidence
will be presented. The expectation letter received by NAM on 1st February 2021 has been attached to
this report as Appendix A.

The expectation letter also describes the maps, graphs and tables to be included in this report. In order
to present a clear analysis additional maps, graphs and tables have been included in this report when
required for clarity. The forecast for reservoir pressure has been requested to be presented based on
gas-years. Gas-years are the 12-month period starting at 1st October. The gas-year 2021/2022 is the
period from 1st October 2021 up to and including 30st September 2022. Gas-years are used to avoid
the high gas demand winter period to be split over two reporting periods. The assessment of
subsidence included in this report uses calendar years to be in line with other subsidence reports.

1.3 TNO SDRA – Seismische Deigings- en Risicoanalyse
As part of the wider program to remove NAM from the Groningen earthquake dossier, TNO has taken
over the assessment of hazard and risk from NAM. TNO has built their own modelling tool for the
assessment of hazard and risk in Groningen (de TNO “Modellentrein”) and will use this for the
preparation of the Hazard and Risk Assessment 2021.

NAM has delivered the forecasts for reservoir pressure to TNO for their Hazard and Risk Assessment
on 15th February 2021 and confirmed on 19th February that the assurance had been completed
successfully. Reservoir pressure predictions have been prepared for input into the Hazard and Risk
Assessment based on two production scenarios; a scenario for gas production during a cold ambient

 6
Seismic Hazard and Risk Assessment of Production Profile “GTS raming 2021”
 for the Groningen field - March 2021

2 Reservoir and Pressure Modelling
Modelling the pressure in the Groningen gas reservoir forms the starting point for both the seismic
hazard and risk assessment as well as the subsidence forecast. The future pressure distribution in the
reservoir depends on the amount of gas produced and on how this production is regionally distributed.

2.1 Production: Demand profiles GTS-raming 2021
The Ministry of Economic Affairs and Climate Policy provided demand profiles for Groningen gas with
the Expectation Letter (Verwachtingenbrief - Appendix A) sent to NAM on the 31st of January 2021.
The future demand for Groningen-quality gas has been determined by GTS, incorporating the latest
knowledge around nitrogen blending capacity, conversion in the L-gas market, export requirements
etc. Accounting for the contributions of UGS Norg and PGI Alkmaar results in the net Groningen
production profiles. For gas-year 2021/2022 daily demand profiles have been provided based on
temperature profiles of the last 30 gas-years. Three reference years were chosen, for which longer
term daily as well as monthly demand profiles have been supplied. These reference years correspond
to the temperature profiles of gas-years 1996 (cold year), 2012 (average year), and 2007 (warm year).

The seismic hazard and risk assessment is performed for two scenarios, based on (i) gas demand in the
average temperature scenario, and (ii) gas demand for a cold gas year 2021/2022 followed by average
years. These two demand profiles are used to simulate subsurface pressures and are plotted in Figure
2-1.

Figure 2-1: Groningen field monthly gas production according to GTS-raming 2021. The cold temperature scenario applies
 to gas-year 2021/2022 only.

2.2 Spatial distribution of production

2.2.1 Production regions
In Article 1.3a.1 of the Mining Regulations (“Mijnbouwregeling”), the Groningen production regions
(“clusters”) are defined as follows:

 9

Seismic Hazard and Risk Assessment of Production Profile “GTS raming 2021”
 for the Groningen field - March 2021

 a) Bierum: production location Bierum
 b) Eemskanaal: production location Eemskanaal
 c) East-Central (“Centraal-Oost”): production locations Amsweer, Schaapbulten, Oudeweg,
 Siddeburen, and Tjuchem
 d) South-East (“Zuidoost”): production locations De Eeker, Scheemderzwaag, and Zuiderpolder
 e) South-West (“Zuidwest”): production locations Kooipolder, Slochteren including
 Froombosch, Spitsbergen, Tusschenklappen including Sappemeer, and Zuiderveen
 f) Loppersum: production locations De Paauwen, Leermens, Overschild, ’t Zandt, and Ten Post

 Production regions

Figure 2-2: Production locations and regions.

The production locations are shown in a different color for each region in Figure 2-2. Production from
the Loppersum clusters stopped in February 2018, following the instruction from the Minister of
Economic Affairs and Climate Policy. As decided in the 2020 Vaststellingsbesluit (Article 3), clusters
Bierum, Eemskanaal, and production location Siddeburen are no longer part of the operational
strategy and remain closed in.

2.2.2 Start-up sequence
In 2020 the minister instructed NAM to follow Operational Strategy 2. In this Operational Strategy gas
is produced preferentially from the South-East. If more production is required production locations in
the South-West are first added, followed by the Central-East region when required. The operational
strategy is practically implemented by the use of a start-up sequence; the order in which the
production locations are taken into production, when more production from the field is required. The
start-up sequence for this Operational Strategy is given in Table 2-1.

From April 2022 onwards, when the Zuidbroek nitrogen installation will be operational, the role of the
Groningen field changes and the start-up sequence from Table 2-1 no longer applies. Groningen will

 10
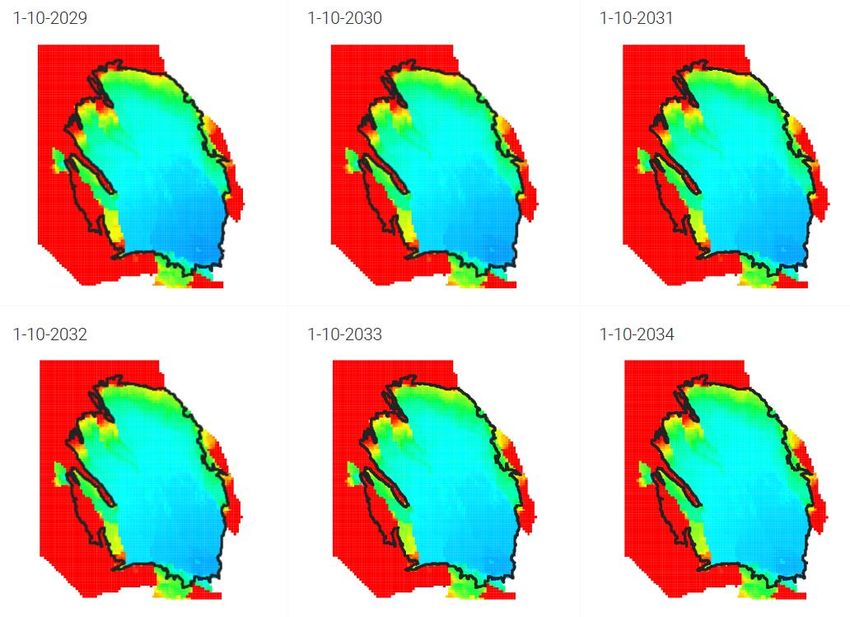
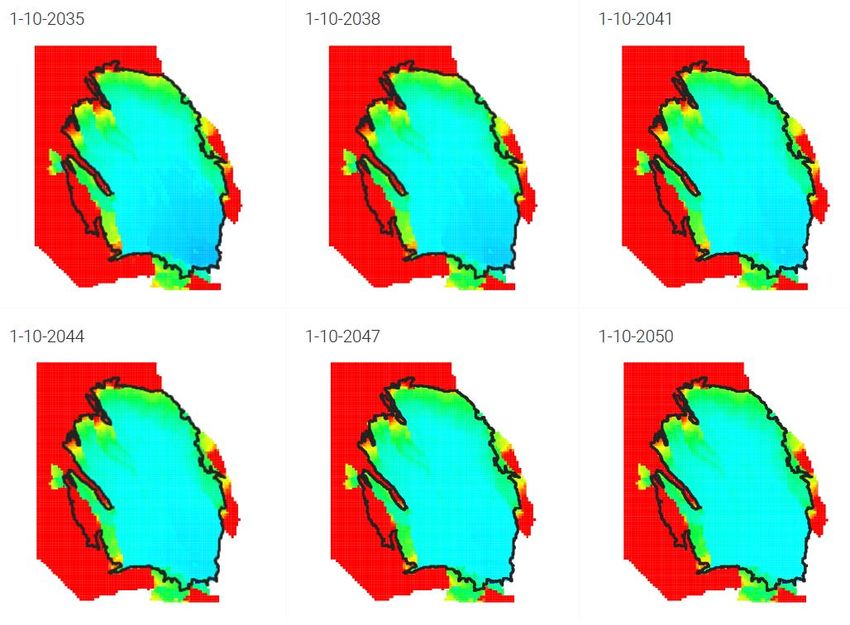
Seismic Hazard and Risk Assessment of Production Profile “GTS raming 2021”
 for the Groningen field - March 2021

Figure 2-5 shows the modelled reservoir pressure distribution on 1-10-2021, which is the start of gas-
year 2021/2022. This pressure distribution is the common starting point in the two temperature
scenarios.

Figure 2-6 plots the difference in pressure on 1-10-2021 compared to last year’s forecast (HRA 2020)
for average temperature and operational strategy 2. This strategy is comparable to the current
operational strategy. Compared to last year’s demand estimate, actual production up to 1-1-2021 and
estimated production for the remainder of the gas year result in less cumulative production at the start
of next gas year on 1-10-2021. This is due to a warmer than average 2020 and additional measures to
reduce Groningen production volume. As a result, a positive pressure difference is seen (i.e. higher
pressure based on the new estimate including actual production up to 1-1-2021), with a maximum
local difference of around 3 bar.

Figure 2-9 shows difference maps for a selection of later years. In the period 2025-2027 the forecast
based on the new estimate has a slightly lower pressure in the active production regions as a result of
the small additional production volume due to the minimum flow requirement. A small difference (of
around 1 bar) can be seen in Borgsweer, due to an update of the water injection forecast. Outside the
boundary of the Groningen field some higher pressures are seen in the Warffum and Kielwindeweer
fields, since production stops earlier in the updated forecast for these fields. From 2032 onwards the
difference in pressure in the Groningen field between the current year and previous year forecast is
negligible.

Figure 2-7 shows the pressure distribution on 01-10-2022 for the average temperature scenario, and
Figure 2-8 for the cold gas year scenario. Figure 2-10 shows the difference in pressure between the
two scenarios at the end of gas year 2021/2022 (top left), and 1, 3, 5, 10, and 20 years later. At the end
of gas year 2021/2022 the local pressure difference between the average and cold scenario has a
maximum of 3.8 bar. Over time this difference dissipates. Twenty years later a maximum local pressure
difference of 0.6 bar remains in the South-East corner of the field.

Pressure maps for subsequent gas years in the average temperature scenario are given in Figure 2-11
(2023-2028), Figure 2-12 (2029-2034), and Figure 2-13 (2035-2050, every 3 years).

 14
Seismic Hazard and Risk Assessment of Production Profile “GTS raming 2021”
 for the Groningen field - March 2021

Figure 2-9: Pressure difference maps for average temperature scenario: pressure HRA 2021 – pressure HRA 2020 (OS2). At end of gas year 2021/2022 (top left) and after 1, 3, 5, 10, and
 20 years (bottom right).

 16
Seismic Hazard and Risk Assessment of Production Profile “GTS raming 2021”
 for the Groningen field - March 2021

Figure 2-10: Pressure difference maps: pressure average scenario – pressure cold scenario. At end of gas year 2021/2022 (top left) and after 1, 3, 5, 10, and 20 years (bottom right).

 17
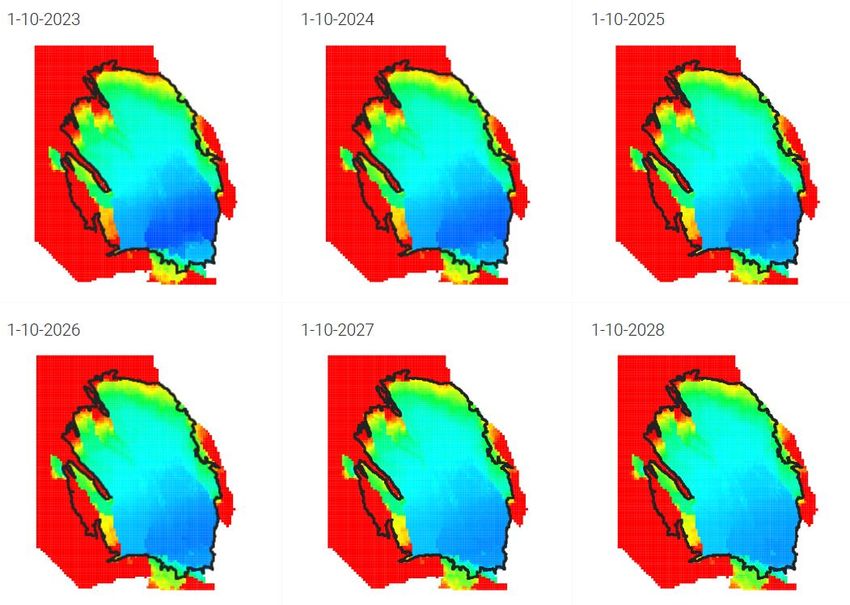
Seismic Hazard and Risk Assessment of Production Profile “GTS raming 2021”
 for the Groningen field - March 2021

Figure 2-11: Pressure distribution at 1st of October 2023-2028 for average temperature scenario. See for colour scale Figure 2-5.

 18
Seismic Hazard and Risk Assessment of Production Profile “GTS raming 2021”
 for the Groningen field - March 2021

Figure 2-12: Pressure distribution at 1st of October 2029-2034 for average temperature scenario. See for colour scale Figure 2-5.

 19
Seismic Hazard and Risk Assessment of Production Profile “GTS raming 2021”
 for the Groningen field - March 2021

Figure 2-13: Pressure distribution at 1st of October 2035-2050 (every 3 years) for average temperature scenario. See for colour scale Figure 2-5.

 20
Seismic Hazard and Risk Assessment of Production Profile “GTS raming 2021”
 for the Groningen field - March 2021

3 Subsidence
In this HRA report for Groningen, subsidence is assessed for the period 2021-2031 for both the gas
field and connected aquifers. Ongoing pressure depletion in the subsurface of the areas is driving the
subsidence. This chapter presents the forecast of surface subsidence based on “GTS-raming 2021”,
average temperature and the Operational Strategy as described in Chapter 2 of this report. In a series
of updates of the Winningsplan Groningen 2016 (Ref. 8 to Ref. 14), this chapter is an updated version
of relevant paragraphs on subsidence.

The study area is defined by the Groningen gas field and the most important connected aquifers
surrounding the field (Figure 3-1). These aquifers are:

 - The “Southern Lauwerszee Trough (Zuidelijke Lauwerszee Trog)” aquifer located between
 the Groningen field and the smaller fields of Vries and Roden.
 - In the north, the “Mowensteert” aquifer is connected to the Groningen gas field causing
 possible subsidence in the Waddenzee.
 - The Rysum aquifer is connected to the eastern part of the field.
 - In the south, an aquifer between Annerveen and Groningen is connected to the Groningen
 field.
The white coloured aquifers in Figure 3-1, e.g. the Goldhoorn aquifer to the east of the Groningen,
have no connection to the gas field due to large offset faults blocking lateral fluid flow and hence
preventing pressure communication. The “Noordelijke Lauwerszee trog” is mainly connected to the
Bedum and Warffum fields.

Possible depletion in the connected aquifers to the Groningen gas field was the main driver for
conducting the Groningen long term subsidence forecast study (Ref. 35) in 2020. The study describes
a statistical workflow that defines the most likely subsidence scenario including the quantification of
the model uncertainty. Results from this study were also used in Ref. 36.

This chapter in the current HRA report uses the calibrated subsidence scenario and uncertainties from
these studies but based on the latest (GTS-raming 2021) pressure forecast. Short summaries per block
in the modelling chain will be provided.

The compaction is described in section 3.1 The influence model translates the compaction in the
subsurface to the earth’s surface and is described in section 3.2.

The calibrated model, the uncertainty estimation and the resulting subsidence forecast are presented
in section 3.3 and 3.4.

 21
Seismic Hazard and Risk Assessment of Production Profile “GTS raming 2021”
 for the Groningen field - March 2021

Figure 3-1 Overview of the most important lateral aquifers attached to the Groningen field. In red the field names that
 are mentioned in the text.

3.1 Compaction model
The RTCiM model (Ref. 38) was used For the subsidence forecast, as it gives the best match to core
deformation experiments when compared to any of the other compaction models. Another advantage
of the RTCiM model is that it spans a wide range of temporal behaviours to reflect the possible visco-
plastic behaviour of the sandstone. The RTCiM model can behave more linear with depletion or exhibit
time decay and temporal characteristics by changing parameter values. None of the other models is as
versatile. This choice concurs as well with the findings of the LTS-II research (Ref. 39).

3.1.1 Input to compaction model
Reservoir compaction is mainly dependent on pressure depletion, reservoir thickness and rock
compressibility. These parameters will be described in the following sections.

 22
Seismic Hazard and Risk Assessment of Production Profile “GTS raming 2021”
 for the Groningen field - March 2021

3.1.1.1 Pressure scenario for the reservoir and laterally connected aquifers
The basis for the pressure scenario is the V6 reservoir model which includes a depleting Carboniferous
as a separate layer (Chapter 3). Following the results from the Groningen long term subsidence study
(Ref. 35), the V6 model also delivers the pressure forecast for the aquifer areas Rysum, Möwensteert,
and South (aquifer between Groningen and Annerveen). The aquifer pressures in the Southern
Lauwerszee Trough are described by a set of 5 box models. Each box model provides 5 possible
pressure realisations. The geodetic measurements above these box models were used to select the
most likely combination of these possible realisations. Pressures from this box-model combination was
stitched to the V6 model. More information on the workflow and selection procedure for the aquifer
realisations can be found in Ref. 35Ref. 15.

3.1.1.2 Reservoir Thickness
A reservoir thickness map from the V6 reservoir model reflecting the net thickness was used as input
for the compaction model in the HRA 2020 update (Figure 3-2). The same information is used as well
in the HRA 2021 update. Net thickness is specified for both the ROSL and DC.

Figure 3-2 Net reservoir thickness [m] of the V6 reservoir model. Left: Net thickness for ROSL. Right: Net thickness for DC.

3.1.1.3 Rock compressibility
Rock compressibility is described by the RTCiM compaction model and the parameter values used for
the HRA 2021 forecasts result from the workflow that is described by Ref. 35 and listed in Table 3-1.
Table 3-1, parameter values of the RTCiM Ref. 35

 Posterior RTCiM
 Value
 parameters

 A [-] 0.85
 d [-] 0.40
 b [-] 0.021

 23
Seismic Hazard and Risk Assessment of Production Profile “GTS raming 2021”
 for the Groningen field - March 2021

Ref. 35 also investigates the likelihood of possible spatial correlations between the compressibility
( ) and other subsurface parameters like velocity and porosity. The updated posterior correlation to
the porosity showed the highest probability in the workflow and was therefore selected. A map of the
prior porosity map and the posterior map (after an inversion step in the workflow) are visualised in
Figure 3-3. The value for the DC Cm value was deduced from recent core experiments. These
experiments show a range of Cm values from 0.1 to 0.6 10 -5bar-1. As no clear relation between
compressibility and e.g. the porosity of the samples was observed, we assumed a constant (average)
value of 0.3 10-5bar-1 for the DC. (Ref. 37).

Figure 3-3 Left: prior Cm-porosity map. Right: Posterior Cm-porosity map.

3.2 Influence model
The influence model translates the compaction of the reservoir into surface subsidence. In Ref. 39, it
was concluded that a thick salt layer above the Ameland reservoir significantly impacts the temporal
behaviour of the subsidence. Compared to the Groningen field, the Ameland field is relatively small,
where compaction leads to stress arching in the overburden, changing the shear stress above the
reservoir. These shear stresses cause creep deformation in the salt resulting in a narrower and more
profound subsidence bowl. Due to its large size, stress arching is nearly absent above the Groningen
field and therefore it is assumed in this study to neglect salt creep. Still the salt can result in a steeper
edge of the subsidence bowl, a phenomenon that already was recognised and described earlier (Error!
Reference source not found.). We adopted therefore the influence model as described in Ref. 35, that
combines a half-space model with a rigid basement (Ref. 40) using a value of 7 km for the rigid
basement and a Poisson’s ratio of 0.2. The effect of this model results in a change of the bowl shape
that is time independent.

3.3 Uncertainty estimation
The uncertainty estimation for the modelled subsidence is described in Ref. 35. The Monte Carlo-
Markov Chain procedure calculates for each subsidence scenario the model uncertainty Σ that is
largely dependent on the modelled subsidence.

The covariance matrix Σ is calculated with only having non-zero values on the diagonal of the
matrix and uses the following equation to describe the error at a given location:

Σ = 0 +

where is the modelled displacement (double difference) for location . For the most likely scenario,
the value for 0 of 0.53 and a value of 0.029 for was calculated in Ref. 35.

 24
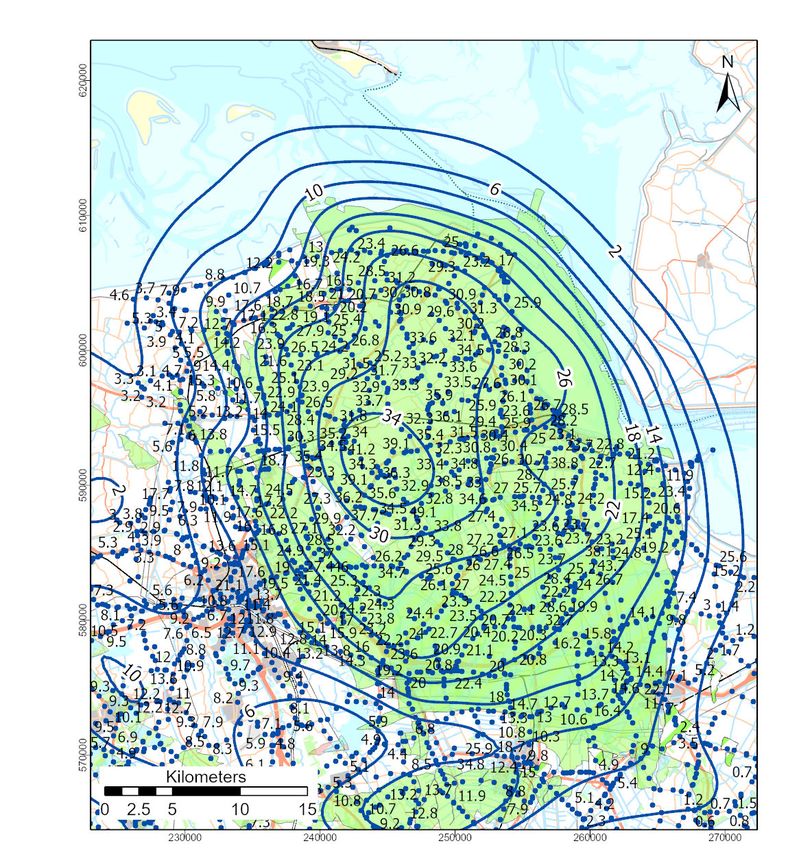
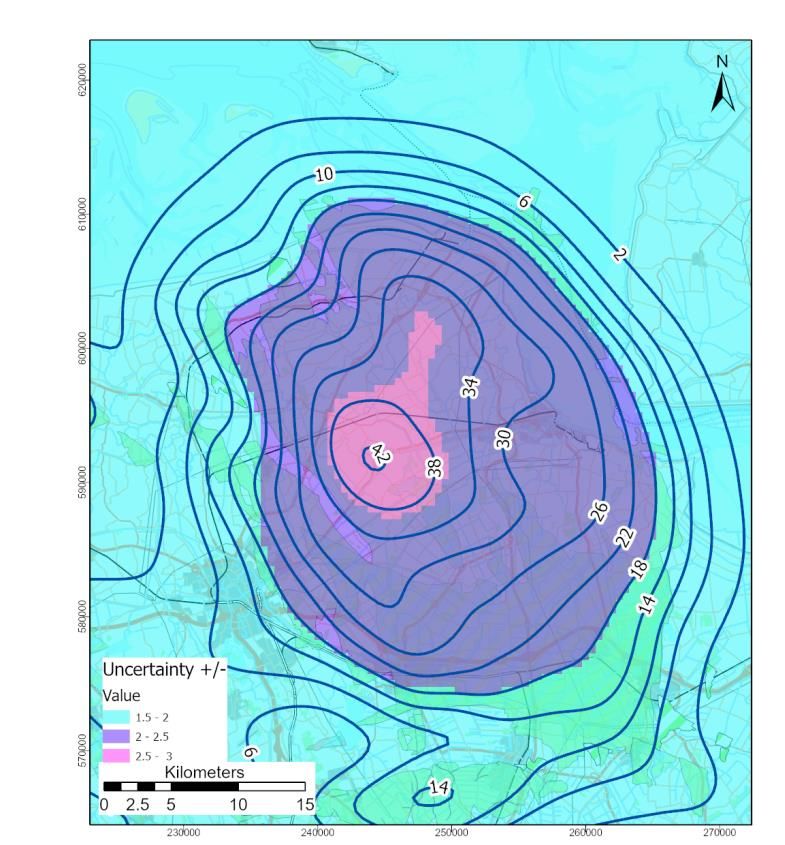
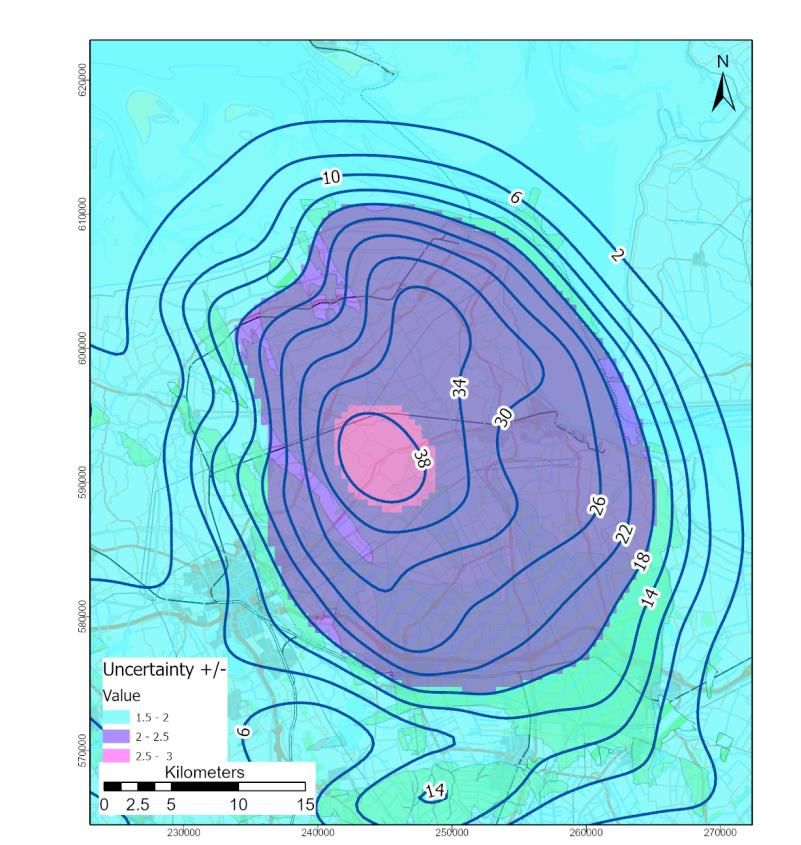
Seismic Hazard and Risk Assessment of Production Profile “GTS raming 2021”
 for the Groningen field - March 2021

3.4 Subsidence forecast
In this section the current status and expected development of subsidence (and uncertainty) up to 1-
1-2032 is presented. Subsidence caused by gas production and aquifer depletion from the Groningen
field is combined with the effects from ongoing gas production from neighbouring fields as published
in Ref. 36.

Figure 3-4 shows the results of the subsidence model in comparison with the measured subsidence in
benchmark locations across the gas field for the period 1972-2018.

Figure 3-4 Contours (solid blue lines) of the modelled subsidence between 1972 and 2018 compared to the measurements
 (green dots with value label) spanning the same period. All values are in cm.

Subsidence forecasts for the end of year 2025, 2031 and 2050 are presented in respectively Figure 3-5,
Figure 3-6 and Figure 3-7. The base case is presented by the contour lines while the P95 uncertainty is
visualized by the coloured overlay. Note that the uncertainty presented is only based on the
subsidence caused by the Groningen field and connected aquifers.

 25
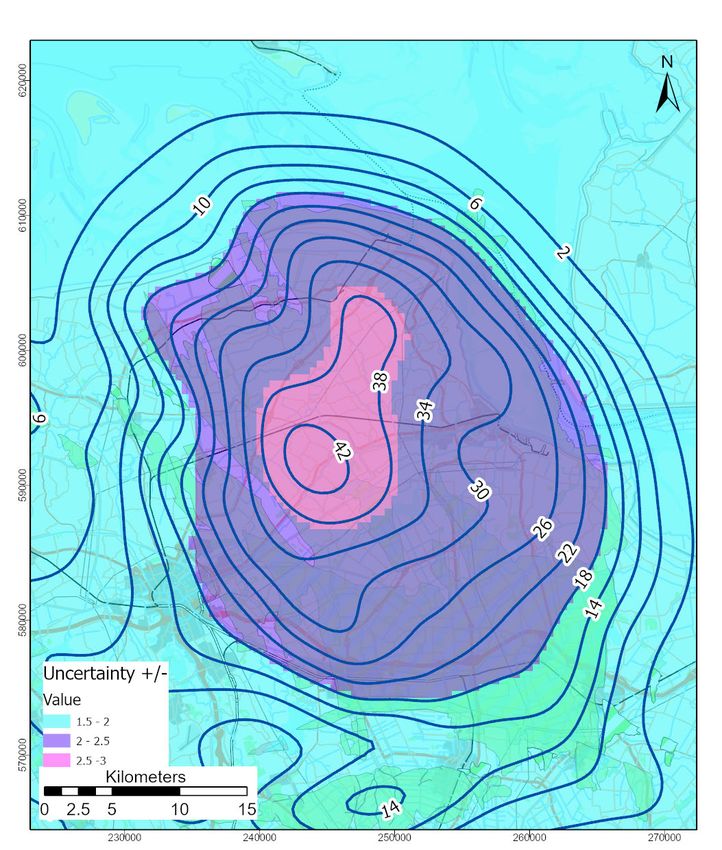
Seismic Hazard and Risk Assessment of Production Profile “GTS raming 2021”
 for the Groningen field - March 2021

Figure 3-5 Subsidence forecast in cm for the end of 2025 (contours). The colours indicate the P95 uncertainty in the
 subsidence.

Figure 3-6 Subsidence in cm for the end of 2031 (contours). The colours indicate the P95 uncertainty in the subsidence.

 26
Seismic Hazard and Risk Assessment of Production Profile “GTS raming 2021”
 for the Groningen field - March 2021

Figure 3-7 Subsidence in cm for the end of 2050 (contours). The colours indicate the P95 uncertainty in the subsidence.

To visualise the match between modelled and measured subsidence over time since the first levelling
surveys, a number of plots are presented in Figure 3-8, showing modelled and measured subsidence
at various benchmark locations over the Groningen field.

 27
Seismic Hazard and Risk Assessment of Production Profile “GTS raming 2021”
 for the Groningen field - March 2021

Figure 3-8 Subsidence at benchmark locations: dark grey line is the predicted subsidence, grey is the P95 uncertainty
 interval, black dots are levelling measurements plus uncertainty, the blue dots are the InSAR measurements.

 28
Seismic Hazard and Risk Assessment of Production Profile “GTS raming 2021”
 for the Groningen field - March 2021

4 References
All reports referenced in this section prepared by NAM can be downloaded from the webpage
“onderzoeksrapporten” on www.nam.nl.
Ref. 1 Het Winningsplan Groningen 2013, NAM, Dec 2013.

Ref. 2 Technical Addendum to the Winningsplan Groningen 2013 - Subsidence, Induced Earthquakes and Seismic
 Hazard Analysis in the Groningen Field and Supplementary Information, Jan van Elk, Dirk Doornhof, Stephen
 Bourne, Steve Oates, Julian Bommer, Clemens Visser, Rob van Eijs and Peter van den Bogert, NAM, Shell and
 Imperial College, Dec 2013.

Ref. 3 Hazard Assessment for the Eemskanaal area of the Groningen field, Jan van Elk and Dirk Doornhof, NAM, Nov
 2014.

Ref. 4 Addendum to: Hazard Assessment for the Eemskanaal area of the Groningen field, Jan van Elk and Dirk
 Doornhof, NAM, Nov 2014.

Ref. 5 Dreigings- en risicoanalyse voor geïnduceerde seismiciteit Groningen - Onderzoek 1 dreigingsanalyse, Jan van
 Elk and Dirk Doornhof, NAM, May 2015.

Ref. 6 Dreigings- en risicoanalyse voor geïnduceerde seismiciteit Groningen - Onderzoek 2 risicoanalyse, Jan van Elk
 and Dirk Doornhof, NAM, May 2015.

Ref. 7 Hazard and Risk Assessment for Induced Seismicity in Groningen, Jan van Elk and Dirk Doornhof, NAM, Nov
 2015.

Ref. 8 Winningsplan Groningen gasveld - 2016, NAM, April 2016. EP201604259068

Ref. 9 Technical Addendum to the Winningsplan Groningen 2016 (chapter 1-5), Jan van Elk and Dirk Doornhof, NAM,
 Apr 2016.

Ref. 10 Technical Addendum to the Winningsplan Groningen 2016 (chapter 6), Jan van Elk and Dirk Doornhof, NAM,
 Apr 2016.

Ref. 11 Technical Addendum to the Winningsplan Groningen 2016 (chapter 7), Jan van Elk and Dirk Doornhof, NAM,
 Apr 2016.

Ref. 12 Technical Addendum to the Winningsplan Groningen 2016 (chapter 8), Jan van Elk and Dirk Doornhof, NAM,
 Apr 2016.

Ref. 13 Technical Addendum to the Winningsplan Groningen 2016 (chapter 9), Jan van Elk and Dirk Doornhof, NAM,
 Apr 2016.

Ref. 14 Supplement to the Winningsplan Groningen 2016, Jan van Elk and Dirk Doornhof, NAM, Apr 2016.

Ref. 15 Assessment of Hazard Building Damage and Risk for Induced Seismicity in Groningen - 2017, Jan van Elk, Dirk
 Doornhof, NAM, Nov 2017.

Ref. 16 Seismic risk assessment for a selection of seismic risk production scenarios for the Groningen field, Jan van Elk,
 Assaf Mar-Or, Leendert Geurtsen, Per Valvatne, Eddy Kuperus and Dirk Doornhof, NAM, Apr 2018.

Ref. 17 Assessment of Hazard, Building Damage and Risk based on Production Scenario Basispad Kabinet for the
 Groningen field, Jeroen Uilenreef, Jan van Elk and Assaf Mar-Or, NAM, July 2018.

Ref. 18 Assessment of Subsidence based on Production Scenario “Basispad Kabinet”, Dirk Doornhof and Onno van der
 Wal, NAM, July 2018. EP201806209337

Ref. 19 Hazard and Risk Assessment - GTS raming 2019, Jan van Elk, Assaf Mar-Or, Leendert Geurtsen, Jeroen Uilenreef
 and Dirk Doornhof, NAM, Mar 2019.

Ref. 20 Hazard and Risk Assessment Groningen Field – update for Production Profile GTS-raming 2020, Jan van Elk,
 Anke Jannie Landman, Jeroen Uilenreef and Dirk Doornhof, NAM, Mar 2020.

 29
Seismic Hazard and Risk Assessment of Production Profile “GTS raming 2021”
 for the Groningen field - March 2021

Ref. 21 Letter to NAM: Mijnbouwwet instemmingsbesluit winningsplan Groningenveld; aanvullingsverzoek, Directeur
 Energy Markt Ministry of Economic Affairs, 20 December 2013.

Ref. 22 Verwachtingenbrief – Winningsplan 2016

Ref. 23 Wijzigingsbesluit 24th May 2017

Ref. 24 Letter to Parliament “Gaswinning Groningen”, 29th March 2018, Minister of Economic Affairs and Climate
 Policy.

Ref. 25 Letter to Parliament “Betreft Voortgang maatregelen gaswinningsbrief”, 6 juni 2018, Minister of Economic
 Affairs and Climate Policy.

Ref. 26 Letter “Verwachtingenbrief aanvulling winningsplan Groningenveld 2016” to NAM, 2nd May 2018, Minister
 of Economic Affairs and Climate Policy.

Ref. 27 Verwachtingenbrief “verzoek tot voorspellen van twee operationele strategieen voor het gas jaar 2019-2020”,
 Ministerie van Economische Zaken en Klimaat met 13 Februari 2019 met bijlage “raming benodigd
 Groningenvolume en capaciteit gasjaar 2019/2020 en verder”, Gasunie Transport Services, Februari 2019.

Ref. 28 Verwachtingenbrief – GTS Raming 2020

Ref. 29 Eerste advies Adviescommissie ‘Omgaan met risico’s van geïnduceerde aardbevingen’ 23rd June 2015

Ref. 30 Tweede advies Omgaan met hazard- en risicoberekeningen in het belang van handelingsperspectief voor
 Groningen Adviescommissie ‘Omgaan met risico’s van geïnduceerde aardbevingen’ 29th October 2015

Ref. 31 Eindadvies Handelingsperspectief voor Groningen Adviescommissie ‘Omgaan met risico’s van geïnduceerde
 aardbevingen’ (Commissie-Meijdam), 14th December 2015

Ref. 32 Groningen Dynamic Model Update 2018 – V6, Quint de Zeeuw and Leendert Geurtsen, NAM, Oct 2018.
 EP201809202872.

Ref. 33 Investigation of gas presence in the aquifer of the Groningen field, Gulfiia Ishmukhametova, NAM, Sept 2018.

Ref. 34 Groningen Basin Model 2018, Hemmo Boscher, NAM, June 2018.

Ref. 35 Groningen long term subsidence forecast, NAM, 2020 EP202008201822, version 2

Ref. 36 Bodemdaling door gaswinning - Bodemdaling door aardgaswinning in Groningen, Friesland en het noorden
 van Drenthe, NAM, 2020, EP202011201629
 https://nam-onderzoeksrapporten.data-app.nl/reports/download/bodemdaling/nl/aa0e05c7-704a-4f9f-
 a02c-ea7ece904905

Ref. 37 van der Linden, A.J., Marcelis, F.H.M., Hol, S. & El Azouzi, K. (2020) Mechanical compression testing
 Carboniferous underburden material from the Zeerijp-3A well, Groningen Field, The Netherlands. Shell report
 SR.20.00670

Ref. 38 Pruiksma, J.P. & Breunese, J.N. & Thienen-Visser, Karin & De Waal, Hans. (2015). Isotach formulation of the
 rate type compaction model for sandstone. International Journal of Rock Mechanics and Mining Sciences. 78.
 127-132. 10.1016/j.ijrmms.2015.06.002.

Ref. 39 NAM (2017) Ensemble Based Subsidence application to the Ameland gas field – long term subsidence study
 part two (LTS-II) continued study.

Ref. 40 Geertsma, J. and van Opstal, G. (1973). A Numerical Technique for Predicting Subsidence Above Compacting
 Reservoirs, Based on the Nucleus of Strain Concept. Verh. Kon. Ned. Geol. Mijnbouwk. Gen., 28, pp. 63-78.

 30
Seismic Hazard and Risk Assessment of Production Profile “GTS raming 2021”
 for the Groningen field - March 2021

 33
Seismic Hazard and Risk Assessment of Production Profile “GTS raming 2021”
 for the Groningen field - March 2021

 34
Seismic Hazard and Risk Assessment of Production Profile “GTS raming 2021”
 for the Groningen field - March 2021

 35
Seismic Hazard and Risk Assessment of Production Profile “GTS raming 2021”
 for the Groningen field - March 2021

 36
Seismic Hazard and Risk Assessment of Production Profile “GTS raming 2021”
 for the Groningen field - March 2021

 37
Seismic Hazard and Risk Assessment of Production Profile “GTS raming 2021”
 for the Groningen field - March 2021

Gas-year Gas-years are the 12-month period starting at 1st October. The gas-year
 2020/2021 is the period from 1st October 2020 up to and including 30st
 September 2021. Gas-years are used to avoid the high gas demand winter
 period to be split over two reporting periods.
Geophone A device that converts ground movement (velocity) into voltage, which
 may be recorded at a recording station. The deviation of this measured
 voltage from the base line is called the seismic response and is analysed
 for structure of the earth.
Ground Motion General term referring to the qualitative or quantitative aspects of
(Shaking) movement of the Earth's surface from earthquakes or explosions. Ground
 motion is produced by waves that are generated by sudden slip on a fault
 or sudden pressure at the explosive source and travel through the Earth
 and along its surface. (USGS)
GTS-raming The hazard and risk assessment is based on a production profile for the
 Groningen field. This is based on a prognosis of demand for Groningen
 gas prepared by GTS. GTS raming 2020 as made in January 2020.
Gutenberg-Richter Earthquakes appear to follow a pattern through time in terms of no. of
 earthquakes vs. magnitude. This is called the Gutenberg-Richter criterion.
 (CEDIM)
Hazard Any physical phenomenon associated with an earthquake that may
 produce adverse effects on human activities. This includes surface
 faulting, ground shaking, landslides, liquefaction, tectonic deformation,
 tsunami, and seiche and their effects on land use, manmade structures,
 and socioeconomic systems. A commonly used restricted definition of
 earthquake hazard is the probability of occurrence of a specified level of
 ground shaking in a specified period of time. (USGS)
Hypocenter The point within the Earth where an earthquake rupture initiates. Also
 commonly termed the focus. (USGS)
 The individual earthquake risk is the annual risk that an individual is
Individual Earthquake
 exposed to in the various structures in or near which this individual is
Risk
 present (See also table 7.1).
Inside Local Personal The probability of death of a fictional unprotected person who is
Risk (ILPR) permanently present in a building (See also table 7.1).
Liquefaction seismology, it refers to the loss of soil strength as a result of an increase
 in pore pressure due to ground motion. This effect can be caused by
 earthquake shaking. (IASPEI)The transformation of a granular material
 from a solid state into a liquefied state as a consequence of increased
 pore water pressures and reduced effective stress. In engineering
 The probability of death of a fictional unprotected person who is
Local Personal Risk permanently present in or near a building. This person is thought to be
(LPR) inside the building 99% of the time and outside near the building 1 % of
 the time (See also table 7.1).
Local site conditions A qualitative or quantitative description of the topography, geology, and
 soil profile at a site that affect ground motions during an earthquake.
 (IASPEI).
Nationale Praktijk This document describes the structural safety of a building in case of
Richtlijn: NPR 9998 earthquake loads. Constructors can use this guideline to calculate how
 strong a building must be in order to comply with the seismic safety
 standard for buildings used in the Netherlands.
Magnitude A number that characterizes the relative size of an earthquake.
 Magnitude is based on measurement of the maximum motion recorded

 39
Seismic Hazard and Risk Assessment of Production Profile “GTS raming 2021”
 for the Groningen field - March 2021

 by a seismograph(sometimes for earthquake waves of a particular
 frequency), corrected for attenuation to a standardized distance. Several
 scales have been defined, but the most commonly used are (1) local
 magnitude (ML), commonly referred to as Richter magnitude, (2) surface-
 wave magnitude (Ms), (3) body-wave magnitude (Mb), and (4) moment
 magnitude (Mw). ML, Ms and Mb have limited range and applicability and
 do not satisfactorily measure the size of the largest earthquakes. The
 moment magnitude (Mw) scale, based on the concept of seismic
 moment, is uniformly applicable to all sizes of earthquakes but is more
 difficult to compute than the other types. In principal, all magnitude
 scales could be cross calibrated to yield the same value for any given
 earthquake, but this expectation has proven to be only approximately
 true, thus the need to specify the magnitude type as well as its value. An
 increase of one unit of magnitude (for example, from 4.6 to 5.6)
 represents a 10-fold increase in wave amplitude on a seismogram or
 approximately a 30-fold increase in the energy released. In other words,
 a magnitude 6.7 earthquake releases over 900 times (30 times 30) the
 energy of a 4.7 earthquake - or it takes about 900 magnitude 4.7
 earthquakes to equal the energy released in a single 6.7 earthquake!
 There is no beginning nor end to this scale. However, rock mechanics
 seem to preclude earthquakes smaller than about -1 or larger than about
 9.5. A magnitude -1.0 event releases about 900 times less energy than a
 magnitude 1.0 quake. Except in special circumstances, earthquakes
 below magnitude 2.5 are not generally not felt by humans. (USGS-IASPEI)
Mijnraad 1500 Lijst These are the ca 1,500 buildings that in the advice of the Mijnraad of mid-
 2018 had a mean LPR > 10-5/year.
Monte-Carlo Simulation The Monte Carlo simulation is a simulation technique whereby a physical
 process is simulated not once but many times, each time with different
 starting conditions. The result of this collection of simulations is a
 distribution function that displays the entire area of possible outcomes.
Object-related The Objectgebonden individual earthquake risk is the risk that an
Individual Risk individual dies in a year due to collapse or falling objects (as a result of an
 earthquake) of a building in which or in the direct vicinity of which this
 person is present. The residence time in/around that building is therefore
 taken into consideration (See also table 7.1).
Outside Local Personal The probability of death of a fictional unprotected person who is
Risk permanently present near a building (See also table 7.1).
P Wave A seismic body wave that involves particle motion (alternating
 compression and extension) in the direction of propagation. (USGS)
P wave A P wave, or compressional wave, is a seismic body wave that shakes the
 ground back and forth in the same direction and the opposite direction
 as the direction the wave is moving.
Peak Acceleration The highest acceleration in terms of value. (USGS)
PGA The maximum acceleration amplitude measured or expected in a strong-
 motion accelerogram of an earthquake. (IASPEI)
Primary Wave See P Wave (CEDIM)
Risk The probabilistic determination of the damages a certain hazard can
 cause given the existing vulnerability, location and time. (UN )
Risk Assessment Definition: A methodology to determine the nature and extent of risk by
 analyzing potential hazards and evaluating existing conditions of
 vulnerability that together could potentially harm exposed people,

 40
Seismic Hazard and Risk Assessment of Production Profile “GTS raming 2021”
 for the Groningen field - March 2021

 property, services, livelihoods and the environment on which they
 depend.Comment: Risk assessments (and associated risk mapping)
 include: a review of the technical characteristics of hazards such as their
 location, intensity, frequency and probability; the analysis of exposure
 and vulnerability including the physical social, health, economic and
 environmental dimensions; and the evaluation of the effectiveness of
 prevailing and alternative coping capacities in respect to likely risk
 scenarios. This series of activities is sometimes known as a risk analysis
 process. (UN/ISDR)
Rupture The instantaneous boundary between the slipping and locked parts of a
 fault during an earthquake. Rupture in one direction on the fault is
 referred to as unilateral. Rupture may radiate outward in a circular
 manner or it may radiate toward the two ends of the fault from an interior
 point, referred to as bilateral. (USGS)
S-wave An S wave, or shear wave, is a seismic body wave that shakes the ground
 back and forth perpendicular to the direction the wave is moving.
S Wave Velocity The velocity of a secondary or S wave. Generally measured in m/s.
 (CEDIM)
Secondary Wave A seismic body wave that involves a shearing motion in a direction
 perpendicular to the direction of propagation. When it is resolved into
 two orthogonal components in the plane perpendicular to the direction
 of propagation, SH denotes the horizontal component and SV denotes the
 orthogonal component. Also known as S waves and shear waves. (PDC)
Seismic hazard Risk of a certain ground motion occurring at a location (this can be
 defined by scenario modeling via stochastic catalogues, DSHA, PSHA or
 other such methods, and can include different types of earthquake
 effects) (CEDIM)
Seismic Risk See earthquake risk, also the probabilistic risk is the odds of an
 earthquake occurring and causing damage within a given time interval
 and region. (EQCanada)
Seismic Station A ground position at which a geophysical instrument is located for an
 observation. (U-Milwaukee)
Seismic Waves An elastic wave generated by an impulse such as an earthquake or an
 explosion. Seismic waves may propagate either along or near the Earth's
 surface (for example, Rayleigh and Love waves) or through the Earth's
 interior (P and S waves). (USGS)
Seismicity 1) The geographic and historical distribution of earthquakes. 2) A term
 introduced by Gutenberg and Richter to describe quantitatively the
 space, time, and magnitude distribution of earthquake occurrences.
 Seismicity within a specific source zone or region is usually quantified in
 terms of a Gutenberg-Richter relationship. (ICWGroup/IASPEI)
Seismogram A record written by a seismograph in response to ground motions
 produced by an earthquake, explosion, or other ground-motion sources.
 (ICW Group)
Seismometer A seismometer is a damped oscillating mass, such as a damped mass-
 spring system, used to detect seismic-wave energy. The motion of the
 mass is commonly transformed into an electrical voltage. The electrical
 voltage is recorded on paper, magnetic tape, or another recording
 medium. This record is proportional to the motion of the seismometer
 mass relative to the Earth, but it can be mathematically converted to a

 41
Seismic Hazard and Risk Assessment of Production Profile “GTS raming 2021”
 for the Groningen field - March 2021

 record of the absolute motion of the ground. Seismograph is a term that
 refers to the seismometer and its recording device as a single unit. (NASA)
Velocity In reference to earthquake shaking, velocity is the time rate of change of
 ground displacement of a reference point during the passage of
 earthquake seismic waves commonly expressed in centimeters per
 second. (USGS)

 42
Seismic Hazard and Risk Assessment of Production Profile “GTS raming 2021”
 for the Groningen field - March 2021

Appendix C – List of Abbreviations

AHN Actueel Hoogtebestand Nederland
ALLEA All European Academies
AGE TNO - adviesgroep economische zaken
ALARP As Low As Reasonably Practicable
ARUP Engineering Company named after founder: Ove Arup
ACVG Adviescollege Veiligheid Groningen
BAG Basisregistratie Adressen en Gebouwen
Bcm N.Bcm refers to a volume of a billion normal cubic meters. Normal means the volume is
 measured at a standard temperature (0 degree C) and pressure (1 bar)
BGS British Geological Survey
BOA Begeleidingscommissie Onderzoek Aardbevingen
BZK Ministry of Internal Affairs (Ministerie van Binnenlandse Zaken)
CBS Centraal Bureau Statistiek
CEA China Earthquake Administration
CEDIM Center for Disaster Management and Risk Reduction Technology
CMI Compaction Monitoring Instrument
CMOC Crack Mouth Opening Displacement
CPT Cone Penetration Test
CVW Centrum Veilig Wonen
DAS Distributed Acoustic Sensing
DEEP.nl Research program led by NWO
DC Carboniferous Formation
DIC Digital Image Correlation
DS Damage State
DSS Distributed Strain Sensing
DTS Distributed Temperature Sensing
DvhN Dagblad van het Noorden (regional newspaper)
EBN Energy Beheer Nederland
EDB Exposure Database
EMS European Macroseismic Scale
EPOS European Plate Observatory System
ERIC European Research Infrastructure Consortium
EVS Extended Visual Screening
EZ Ministerie van Economische Zaken (in English MEA)
EZK Ministerie van Economische Zaken en Klimaat (in English MEAC)
FDSN Federation of Digital Seismograph Networks
Frl Friesland
GBB Groninger Bodembeweging
GEM Global Earthquake Model
GMPE Ground Motion Prediction Equations
GMM Ground Motion Model
GNSS Global Navigation Satellite System
GPS Global Positioning System
GR Group Risk
GWC Gas water contact

 43
Seismic Hazard and Risk Assessment of Production Profile “GTS raming 2021”
 for the Groningen field - March 2021

HRA Hazard and Risk Assessment
HRBE High Risk Building Element
ILPR Inside Local Personal Risk
I&M Ministerie van Infrastructuur en Milieu
InSAR Interferometric Synthetic Aperture Radar
IR Individual Risk
IVO Instituut versterkingsopgave
IU Interrogation Unit
KEM Kenninsprogramma Effecten Mijnbouw (Knowledge program Effects of Mining)
KNAW Koninklijk Nederlands Academie van Wetenschappen (Royal Netherlands Academy of Arts
 and Sciences)
KNGMG Koninklijk Nederlands Geologisch Mijnbouwkundig Genootschap
KNMI Koninklijk Nederlands Meteorologisch Institute
KU Leuven Katholieke Universiteit Leuven (Catholic University Leuven)
LE Latest Estimate
LIDAR Laser Imaging Detection And Ranging
LPR Local Personal Risk
LNEC Laboratorio Nacional de Engenharia Civil (Lisbon)
M Earthquake Magnitude
MEA Ministry of Economic Affairs (prior to 2017)
MEAC Ministry of Economic Affairs and Climate Policy (from 2017 onwards)
MR Maatschappelijk Risico
MASW Multichannel Analysis of Surface Waves
MIT Massachusetts Institute of Technology
NAM Nederlandse Aardolie Maatschappij B.V.
NARS Network of Autonomously Recording Seismographs
NCG Nationaal Coordinator Groningen
NFU Netherlands Federation of University Medical Centres
NGO Non-governmental Organisation
NORSAR Norwegian Seismic Array (Norwegian independent, not-for-profit, research foundation
 within the field of geo-science)
NPR Nationale Practijkrichtlijn
NTNU Norges teknisk-naturvitenskapelige universitet (Norwegian University of Science and
 Technology in Trondheim)
NWO Nederlands Organisatie voor Wetenschappelijk Onderzoek (Dutch National Science
 Foundation)
OECD Organisation of Economic Cooperation and Development
OGP Onafhankelijk Geologen Platform
OIA Objectgebonden Individueel Aardbevingsrisico (Object related individual earthquake risk)
OIR Object-related individual risk (same as OIA)
OVV Onderzoeksraad voor Veiligheid (Safety Board)
PGA Peak Ground Acceleration
PGK Petroleum Geologie Kring
PGV Peak Ground Velocity
PNL Pulsed Neutron log
PRBE Potential High Risk Building Elements
QRM Quantitative Reservoir Management
RFT Repeat Formation Tester

 44
Seismic Hazard and Risk Assessment of Production Profile “GTS raming 2021”
 for the Groningen field - March 2021

RGD Rijksgeologische Dienst (later also TNO-NIGT)
RMSE Roor Mean Square Estimate
RUG Rijksuniversiteit Groningen
RVS Rapid Visual Screening
RvS Raad van State
RWS Rijkswaterstaat
SAC Scientific Advisory Committee
SCAL Special Core Analysis Laboratory
SED Schweizerischer Erdbebendienst (Swiss Seismological Survey)
SINTEF Stiftelsen for industriell og teknisk forskning (Foundation for Scientific and Industrial
 Research)
SMS Samenwerking Mijnbouw Schade
SodM Staatstoezicht op de Mijnen (also SSM State Supervision of Mines)
SPE Society of Petroleum Engineers
SPG Static Pressure Measurement
SPTG Static Pressure and Temperature Measurement
SSHAC Senior Seismic Hazard Analysis Committee
Tcbb Technische commissie bodembeweging
TCMG Tijdelijk Commissie Mijnbouwschade Groningen
TIVO Tijdelijke Instituut versterkingsopgave
TK Tweede Kamer (Dutch equivalent of House of Commons)
TNO Nederlandse Organisatie voor Toegepast Natuurwetenschappelijk Onderzoek,
 Netherlands Organisation for Applied Scientific Research
TNO-AGE Nederlandse Organisatie voor Toegepast Natuurwetenschappelijk Onderzoek – Advies
 Groep Economische Zaken
TO2 Toegepast Onderzoek Organisaties (Federation of Applied Research Institutes); Deltares,
 MARIN, NLR, TNO and WR
TPA Technische Platform Aardbevingen
TU Delft Technische Universiteit Delft
TU/e Technische Universiteit Eindhoven
UU Universiteit Utrecht
UvA Universiteit van Amsterdam
URM Un-reinforced Masonry
USGS United States Geological Survey
USNRC United States Nuclear Regulatory Commission
VoVo Voorlopige voorziening
VSNU Vereniging samenwerkende universiteiten in Nederland (Association of Universities in the
 Netherlands)
Vs800 Shear wave velocity up to a depth of 800 m

 45
Seismic Hazard and Risk Assessment of Production Profile “GTS raming 2021”
 for the Groningen field - March 2021

 46
You can also read