Relationship between the Metadata and Relevance Criteria of Scientific Data
←
→
Page content transcription
If your browser does not render page correctly, please read the page content below
Relationship between the
Metadata and Relevance
Criteria of Scientific Data                                                                  RESEARCH PAPER

GUILAN ZHANG
JIAN WANG
JIANPING LIU
YAO PAN
*Author affiliations can be found in the back matter of this article

ABSTRACT                                                                                     CORRESPONDING AUTHOR:
                                                                                             Jian Wang
The purpose of this study is to explore the information retrieval process in scientific      Agricultural Information
data and to better understand the concepts and internal relationships of metadata and        Institute, Chinese Academy of
relevance criteria. Qualitative and quantitative analyses were performed using interview     Agricultural Sciences, Beijing,
and eye movement data from 36 subjects. The results show that users paid attention to        China; Key Laboratory of
                                                                                             Agricultural Big Data, Ministry
45 types of metadata and used nine relevance criteria to judge the relevance of scientific
                                                                                             of Agriculture and Rural Affairs,
data. There was a complex relationship between the metadata and criteria, mainly             Beijing, China
manifesting as one stimulus–multiple responses and multiple stimuli–one response.
                                                                                             wangjian01@caas.cn
Metadata associated with the relevance criterion of topicality is the most complex, which
includes common metadata and subject-related metadata. Metadata associated with
the other relevance criteria (such as quality and authority) has no obvious professional
                                                                                             KEYWORDS:
characteristics. What’s more, because of the essential difference between scientific
                                                                                             Scientific data; Relevance
data and documents, users use different criteria. When retrieving data, users pay more       criteria; Metadata; Relevance
attention to the availability of data and whether they can be further analyzed and           judgment
processed. This study clarifies the concepts of metadata and relevance criteria as well
as their roles in relevance judgments. In addition, this study deepens the understanding     TO CITE THIS ARTICLE:
of the scientific data relevance judgments and their cognitive process and provides a        Zhang, G, Wang, J, Liu, J and
theoretical basis for improving scientific data-sharing platforms.                           Pan, Y. 2021. Relationship
                                                                                             between the Metadata and
                                                                                             Relevance Criteria of Scientific
                                                                                             Data. Data Science Journal, 20:
                                                                                             5, pp. 1–21. DOI: https://doi.
                                                                                             org/10.5334/dsj-2021-005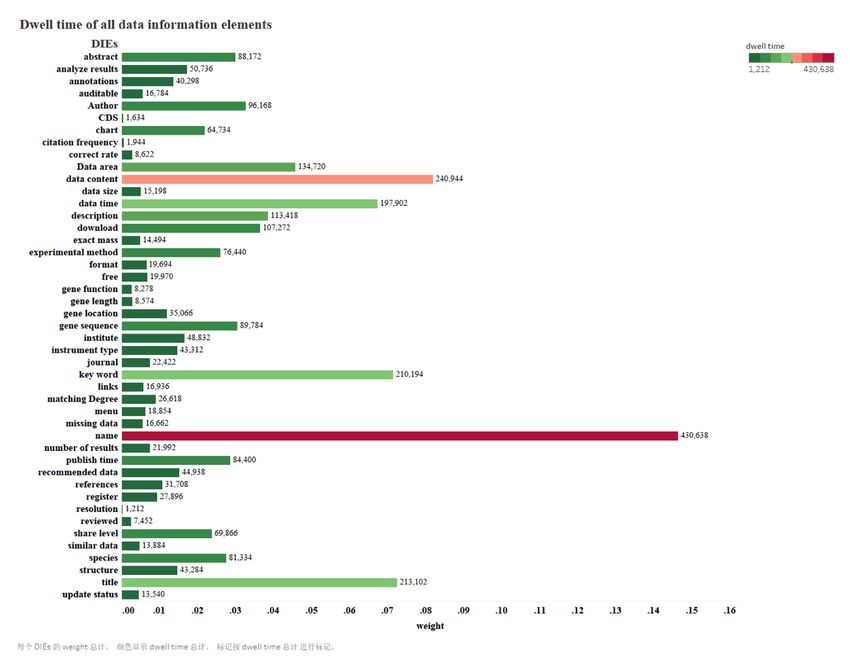
1. INTRODUCTION                                                                                          Zhang
                                                                                                         Data Science Journal
                                                                                                                                  2

                                                                                                         DOI: 10.5334/dsj-2021-
Scientific data are series of original data, processing data, and result data produced by scientists
                                                                                                         005
in the process of scientific research. Metadata are data about data that describes the properties
of the data. The amount and usage of data are booming. Data in science, medicine, business,
and other fields are predicted to soon reach critical mass (Christine, 2014). Mass scientific
data resources are the basis of scientific research. Scientific data sharing is the key to realizing
information value and data reuse, and it is an important way to promote the flow of scientific
data among researchers so that these data may be transformed into scientific conclusions
(Deng Zhonghua, 2017). To better share and reuse scientific research results, which avoids
wasting research funds, scientific communities in all fields are building scientific data sharing
platforms, which provide mass data resources for researchers. Before reusing data, users must
assess the data’s relevance. They seek assurance that the data can be understood, and they
must trust the data (IM Faniel, 2010). In contrast to other information carriers (like literature,
images and videos), scientific data are highly purpose, targeted, subject-related, and technical.
In addition, specialist software tools are usually required to analyze the results of scientific data.
From document retrieval to data retrieval, information types have substantially changed, and
an urgent question is whether the user retrieval modes and strategies have change accordingly.

Relevance is the relationship between the task at hand and the information presented to us. It
is a core concept in the field of information science. A relevance judgment determines whether
such a relationship exists or not, and relevance criteria are factors that affect judgment. In
the age of data, people needed to quickly find information related to their own needs from a
large amount of information, so relevance studies have become increasingly important. Many
previous studies have focused on relevance in various contexts in order to provide a theoretical
basis for various information retrieve systems. The results show that relevance judgment differs
when the research situation changes (Taylor, 2009).

There is a continuous and indivisible cognitive process that extends from gazing at information
to stimulating the brain to use criteria to make a judgment and includes stimulus, attention,
and memory extraction (Gao and Xiaoyun, 2003). When a study focuses on scientific data, a
user’s retrieval behavior may change. How users search for relevant scientific data still needs
further study. To better understand relevance judgment, this study explores the relationship
between metadata and relevance criteria. Its aim is also to determine the following:

(a) what types of metadata users pay attention to when retrieving scientific data;
(b) what criteria are used in scientific data relevance judgment and how they differ from
    document criteria;
(c) the relationship between metadata and relevance criteria and the rules this relationship
    follows.

By answering these three questions, we hope to make the following contributions. First,
the concepts of metadata and relevance criteria will be defined clearly, enriching relevance
research. Second, the IR community will gain a deeper understanding of how users make their
relevance judgment decisions within a data context. Finally, the findings of this study will have
implications on the design of data retrieval systems. A comparison of the relevance criteria used
for different media and situations will guide designers of different IR systems. Because data
users have different needs and motivations, investigating relevance criteria within different
data contexts will help the design of systems that meet their needs.

2. LITERATURE REVIEW
2.1 RELEVANCE JUDGMENT
Relevance judgment was critical in relevance researches. Lots of relevance researches were based
on relevance judgment process (Ingwersen, 2011). From those studies, we could see relevance
judgments were considered highly complex and cognitive (Xie and Benoit, 2013). Relevance
judgment results were dynamic and contextual rather than constant (Anderson, 2005; Saracevic,
2016). The factors affecting judgment were mainly divided into internal and external factors.
Internal factors mainly included individual cognitive differences. External factors mainly included
information types, task, and pressure. Relevance judgment was a continuous process, which was
closely related to the user’s cognitive processing. In order to analyze relevance judgment more
accurately, scholars added lens model and making-decision theory into study (Wang Peiling,             Zhang                    3
                                                                                                       Data Science Journal
1998; Soo Young Rieh, 2002). They thought users used limited environment information to                DOI: 10.5334/dsj-2021-
make rational judgment, and those information could be linearly weighted. In addition, scholars        005
used SEM (Structural Equation Model) to quantitatively analyze the factors’ weight on relevance
judgment (Xu Calvin, 2006; Xiaolun Wang, 2014; Jianping Liu, 2019).

Wang Peiling (1998) proposed document selection model based on lens model, presenting a
relatively clear relevance judgment process. Balatsoukas (2012) recorded user’s AOI(Area of
Interest) using eye movement devices and got web relevance criteria through deep-interview,
making relevance judgment more intuitive and visual. The studies demonstrated that these
judgments were not singular actions but were instead embedded in very diverse and complex
search and research practices (Anderson, 2005).

2.2 METADATA
Metadata was data about data. Metadata contained a lot of information. In the paper, metadata
was limited to data structures, including datasets names, relationships, field, etc. Scholars
preferred to call it metadata, including title, authors, time, abstract, key words, etc. Marchionini
(2009) thought metadata should facilitate sense making during the relevance judgment process
and not act merely as information access points. Metadata’s content and layout would affect
users’ judgment and satisfaction (Drori, 2003). So scholars designed a lot of experiments to study
the influence of metadata on relevance judgement, including dynamic abstract (Paek et al., 2004),
data thumbnail (Dziadosz and Chandrasekar, 2002), and metadata classification (Rele et al., 2005).

Panos Balatsoukas (2010) thought participants preferred metadata that were easy to
understand and grouped into categories. In order to better understand users’ concerns about
metadata, Balatsoukas used eye-tracking device to measure metadata quantitatively. The
results showed different cognitive efforts will lead to different relevance judgments. The main
metadata they focused on included title, abstract, URL, etc.

Curtis Watson (2013) studied how middle school students judge the reliability and relevance
of web information. The study found participants more liked topical metadata and reliable
metadata. Users’ cognitive level and perceived authority, webpage graphic design, writing
style, and authors all could affect users’ relevance judgment.

2.3 RELEVANCE CRITERIA
Schamber (1996) defined relevance criteria :the factors that influenced the user’s data
relevance judgments. In the 1990s, many empirical studies had been carried out to identify
document relevance criteria or factors in different problem domains. For example, Barry (1994) )
interviewed 18 academic users who had requested an information search for documents related
to their work to categorize their relevance criteria. And finally she identified 23 categories in 7
groups. Magluaghlin and Sonnenwald (2002) asked 12 graduate students with real information
needs to judge the relevance of the 20 most recent documents and identified 29 criteria in 6
categories. Other researchers who had done similar research were Park (1993), Cool (1993),
Westbrook (2001) and so on.

In the 21st century, the information carriers were diversified, and the empirical research on the
relevance criteria also developed from literature to image (Markkula & Sormunen, 2000; Sedghi,
2008, 2012; Hamid, 2010, 2016; Tsai-Youn Hung, 2018), WWW (Tombros, 2003, 2005; Crystal
& Greenberg, 2006; Savolainen, 2006; Yang-woo Kim, 2014; Yung-Sheng Chang, 2018), music
(Laplante, 2010; Inskip, 2010), video (Yang, 2010; Albassam, 2017), mobile commerce (Xiaolun
Wang, 2013) etc.

In conclusion, it could be found that the relevance criteria research was consistent with the
development of current mainstream information carriers. There were common criteria across
different contexts and information carriers (Barry & Schamber, 1998; Xu, 2006; Saracevic, 2015).
At the same time, different information carriers have unique relevance criteria (Zhang, Wang
& Liu, 2018). Scientific data has now become an indispensable material for research, work and
study. So, there have been studies on scientific data relevance criteria. Sabbata (2012) carried
out a study on the geographic data relevance, and found that users dealt with geographic entity
data differently from traditional data. Relevance criteria specific to geographic data emerged,
such as directionality, spatio-temporal, visualization. Gao Fei (2017) focused on the relationship Zhang 4
Data Science Journal
between scientific data user relevance criteria and clues. Wei Caoyuan (2018) carried out a DOI: 10.5334/dsj-2021-
research on the relationship between the scientific data relevance criteria and perceived 005
value, and its influence on the relevance judgment. The results showed that the relevance
criteria promoted the formation of perceived value, and the scientific data retrieval behavior
was similar to the purchase behavior of commodities. Zhang Guilan (2018) also conducted a
classification study on the relevance criteria of scientific data.
At the same time, these studies have revealed some limitations. Firstly, different scholars
put forward different relevance criteria, and there were great differences in classification. For
example, in the image relevance criteria study, Youngok (2000) presented 9 criteria and Hung
(2005) presented 12 criteria. Secondly, The expression of terms is vague, and the relevance
criteria of the same meaning have different expressions in different studies, for example,
accuracy and reliability, utility and usefulness (Xu, 2006). An important reason for this limitation
was that scholars didn’t have a consistent understanding of the concept of relevance criteria
and didn’t make a clear distinction between metadata, clues and criteria. Wang Peiling (1994)
proposed a document selection model based on the lens theory, presenting a relatively clear
relevance judgment process. In the model, the literatures’ information elements and relevance
criteria were clearly defined. Information elements provided clues for users, and the relevance
criteria were the product of cognitive processing in the mind. Balatsoukas (2012) recorded the
user’s AOI (area of interest) in the retrieval process through eye tracker, and explored the web
page relevance criteria through in-depth interview, making the relevance judgment process
more intuitive and visual.
Scholars have done a lot of research on metadata and relevance criteria. Various empirical
studies proved that both metadata and relevance criteria affected user relevance judgment.
And there must be a relationship between metadata and relevance criteria. But there were
few studies focused on this point. So the paper would concentrate on the relationship between
metadata and relevance criteria to help better understand relevance judgment process.
3. METHODS
3.1 CONCEPT MODEL AND RESEARCH HYPOTHESIS
Strictly speaking, relevance does not behave; people behave (Saracevic, 2015). Scholars have
carried out a large number of experiments to explain relevance by observing and describing a
user’s behavior in the relevance judgment of information. Relevance judgment is an information
cognitive process (Gwizdka, 2014). Wang Peiling proposed a document selection model in
which users process the information to form relevance criteria. David Bodoff’s integrated
model of browsing and search relevance argues that users make judgements after focusing on
document characteristics. According to cognitive psychology, in the retrieval process, a user’s
eyes will constantly focus on metadata from the outside world. The metadata then stimulates
the user’s brain to process the received information.
Psychologist Egon Brunswik proposed the lens model to solve the problem of limited human
rational judgment. The environment information that the user pays attention to is the lens, and
the perceived stimuli form the clue. The objects that the clue reflect in the memory are mental
representations. Based on this theory, the concept model was proposed (Figure 1). Scientific
data metadata make up the object environment information, which can then stimulate users.
Relevance criteria are mental representations, which are the users’ responses.
External environment Internal cognition
Metadata stimulate Clues reaction Relevance criteria
Figure 1 Concept model.This study hypothesizes that metadata and relevance criteria are joined through clues. The Zhang 5
Data Science Journal
objective stimuli the users feel is the clue, and the responses that the brain forms after DOI: 10.5334/dsj-2021-
processing clues are relevance criteria. Relevance criteria are influenced by external objective 005
metadata information. The scientific data metadata form the independent variable, and
the relevance criterion is the dependent variable. This study mainly explores the relationship
between the independent variable and dependent variable.
Variable definitions
(a) Scientific metadata describe and interpret the content, attributes, and characteristics of
scientific data. They are objective and real.
(b) Clues are the interaction product between the objective world and the subjective
individual, and are the intuitive reactions formed by brain responding to the metadata
stimulus.
(c) Relevance criteria: These criteria are created by the further processing of clues, and they
are the factor that influences users to make relevance judgments.
3.2 EXPERIMENT AND METHODS
The purpose of this experiment was to explore the relationship between scientific data metadata
and relevance criteria. The experiment evaluated each type of metadata and its fixation dwell
time, the relevance criteria users employed to make relevance judgment, and the relationship
between them. The study combined contextual experiments with interviews to obtain data
(Figure 2). An eye tracker was used to record each user’s fixation behavior during retrieval, and
screen-capture video recorded the user’s browsing and clicking behavior. The information
processing in each user’s mind was obtained through video playback and in-depth interviews.
Figure 2 Contextual
Time 5 min Time unlimited 30-60min experiment process.
Interview End and
Pre- Data
Process Strat with receive
interview retrieval
context payment
1.Experimenters and users
1.Introduced the
1.Eye tracking recorded the looked back at the eye-movement
experiment
user browsing process video
Content 2.Gathered users’
2.Thinking aloud 2.Asked users about relevance
demographic data
3.Observed user behavior judgment process of scientific
3.Chose task types
data
In our contextual experiment, first, each user’s professional background and how frequently
they used scientific data were obtained through a questionnaire. Next, the researchers
introduced the eye movement equipment and explained the experiment. Then, users started
searching for data according their topic, and this was recorded by video. Finally, the researchers
interviewed the users while replaying the video.
3.2.1 Participants
The participants’ choice followed three principles. First, participants often retrieve scientific
data. Second, participants took part in experiment voluntarily. Finally, the retrieval task didn’t
involve scientific secrets. By referring to the number of subjects in previous studies and the
amount of tasks involved in later data processing, we finally selected 36 participants.
Questionnaires were handed out to students of a data analysis course to recruit appropriate
subjects. According to their answers, 36 graduate students who often used scientific data
sharing platforms (such as NCBI,1 NBS,2 or the national meteorological data network3)
1 National Center for Biotechnology Information: https://www.ncbi.nlm.nih.gov/.
2 National Bureau of Statistics of China: http://www.stats.gov.cn/enGliSH/.
3 http://data.cma.cn/site/index.html.were chosen to participate in our experiment. They were majors in agricultural economics, Zhang 6
Data Science Journal
crop science, regional development, biological science, feed nutrition, and environmental DOI: 10.5334/dsj-2021-
development. They were between 22 and 30 years old. The participants represented the young 005
scientific data retrieval group.
We promised to respect participants’ privacy and that the data will only be used for research.
At the end of the experiment, the participants were paid.
3.2.2 Task
Scientific data is highly specialized. Different research areas have different data platforms. In
order to meet their actual retrieval needs, participants were given the right to make their own
choices. Participants chose research task that they were interested in. And they determined the
data sharing platform needed to complete the task. At the same time, each participant must
retrieve at least 3 related scientific data to keep the task challenging.
The participants searched for scientific data according to their usual retrieval habits, without
any limits on the type and number of data sharing platforms. And search time was not limited
so that the participants would feel no pressure to complete the task.
3.2.3 Data Collection
Eye movement collection
Participants’ eye movements were captured through an eye-tracking device (EyeLink 1000
plus) as they searched for scientific data. The device had a 17-inch screen with the eye tracker
embedded in it and permitted a 250-Hz sampling rate with gaze point accuracy down to 0.15°.
Before the retrieval, each participant’s eyes were adjusted to ensure the accuracy of their
fixation points. In general, a saccade lasts no more than 100 ms (Duchowski, 2007). Hence,
we set the minimum fixation to 200 ms, which is the average time people need to read when
solving problems (Rayner, 2009; Lorigo, 2008). This means that a steady fixation must last
more than 200 ms (Balatsoukas, 2014).
Interview data collection
After data retrieval, participants were invited to participate in semi-structured interviews based
on the video of the retrieval process. The questions were as follows.
(a) Platform choices and data relevance. Why did you choose this platform? Were the data
relevant or satisfactory? Did the data support the task? If not, what other data did you
need?
(b) Data choices process. What information did you pay attention to during browsing? Why
did you focus on this information? How did this information affect you? Why did you click
on these data?
(c) Inactivity after attention. Why didn’t you choose to click on the data that you already
focused on? What information made you decide not to click on them?
3.3 EYE TRACKER
The eye tracker hypothesis – that the tasks users choose are determined what they see –is
based on brain–eye consistency (Nielsen, 2010). The examination of eye movements (such as
the number of fixations and fixation length) has been used in psychology and cognitive science
research as a means of understanding the processes of reasoning and decision making (Rayner,
2009). Since then, the movements of our eyes have been studied to uncover the relationship
between eye movement and cognitive processes as well as to identify how visual stimuli affects us
and influences the decisions we make (Jacob and Karn, 2003). Relevance judgment is a cognitive
process, which is difficult to observe and measure. To better study relevance judgment, an eye
tracker is a good solution, because cognitive processes such as mental effort and attention can
be inferred using eye movement data such as saccades and fixations. In an information retrieval
context, the number and length of fixations have been used to study the attention and energy
users have focused on search results lists and web pages. The experiment proved that cognitive
effort is the highest for partially relevant documents and lowest for irrelevant documents
(Gwizdka, 2014, 2015; CT Yang, 2011). Bucher (2006) studied attention patterns in the process
of news content selection with an eye tracker, and the results show that some obvious visual
stimuli (prominent pictures or graphics) actively attract attention. Using eye movement devices,Papaeconomou (2008) studied how users with different learning styles use relevance criteria to Zhang 7
Data Science Journal
judge the usefulness of web pages. Balatsoukas (2010, 2010) studied relevance criteria usage in DOI: 10.5334/dsj-2021-
the relevance judgment process using an eye tracker. The results showed the effects of ranking 005
order and metadata (title, summary, and URL) on the use of relevance criteria. Wenjing Pian
(2016) used an eye tracker system to capture participant eye movements and found that people
focus on different information and used different criteria in three types of use contexts.
An eye tracker is a good tool for recording the data information input of users in the retrieval
process. This study combines eye tracker data with interview data, thus bringing together
cognitive and behavioral approaches in the study of relevance judgment behavior within the
context of user–search engine interaction.
3.4 DATA ANALYSIS
3.4.1 Eye movement data collection
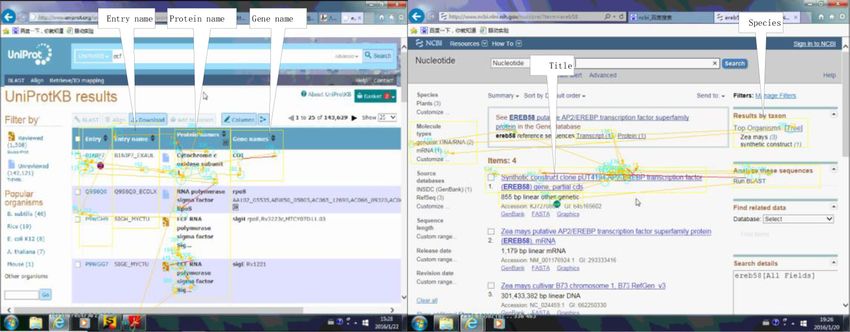
This research focuses on the metadata to which users pay attention. Similar metadata (e.g.,
“title,” “abstract,” and “name”) can be grouped together As shown in Figure 3, each column was
treated as the same area of interest (AOI) in the data list (e.g., “entry name,” “protein name,”
or “gene name”). The scientific data AOIs users paid attention to were labeled by Data Viewer,
which is a commercial eye movement analysis tool. The data processing removed extraneous
data such as post-click comments, residual comments, errors, and ads. A total of 3,359 final
AOIs were obtained, which were divided into 45 types of metadata, such as “name,” “data
content,” “title,” “keyword,” “author,” “publish time,” “links,” and “data time.” The recorded
eye-movement data include the dwell time as well as the number and percentage of fixations.
Figure 3 Division of AOIs.
3.4.2 Interview data analysis
Interview data were coded by three coders using NVivo 11 to ensure coding consistency and
objectivity. The coding process included three stages. First, coders discussed and designed
a coding table through precoding. Second, the interview data were coded according to the
coding table (Appendix 1). Finally, relational nodes were coded by combining interview and eye
movement data.
Node coding
This experiment involved three variables based on the concept model: metadata of interest,
clue responses to presented information, and the relevance criteria used in the relevance
judgment (Table 1). The code was divided into five tree-like nodes: criteria, clues, data type,
databases, and metadata. According to the interview content and AOIs, the secondary nodes
were constantly revised (Appendix 1).
Table 1 Example coding.
INTERVIEW DATA METADATA CLUES CRITERIA
This is the voltage and also the condition. We need to experimental more effective
compare which one works better. method
We want to retrieve humidity, temperature. I want Name match my study topicality
these indices.
Do not need to pay, agricultural academy Intranet Share level I can share it availability
can enter. Free whether it is freeThrough coding, a total of 376 criteria nodes were obtained, including criteria such as Zhang 8
Data Science Journal
topicality, authority, quality, currency, availability, standardization, usability, convenience, and DOI: 10.5334/dsj-2021-
comprehensiveness. A further 320 clue nodes were obtained, including 66 node types such as 005
“better” or “can’t be opened.” Finally, 628 information elements were obtained that included
45 node types such as “title,” “name,” “abstract,” and “data time” (Table 2).
Table 2 Number of coding
NODE MATERIAL SOURCES NUMBER
nodes.
criteria 33 376
clues 32 320
data type 22 31
databases 18 43
metadata 33 628
Relationship node coding
We found there were some relationship between metadata and criteria in a certain sentence.
Metadata always come first, then criteria will come. And the sentences reflect the cognitive
process of scientific data. So the study encoded the relationship between the metadata and
criteria (Table 3).
(a) Auxin is the keyword. The term is gene transcription protein. Then, I found the protein
name that I’m looking for in the title. So, the data is relevant.
(b) We need the data from 2010 to 2020. But these data are too old, and this source does
not have data from 2010. We would have to spend money to access these data, which is
more trouble.
Table 3 Example relation code.
METADATA RELATIONSHIP CLUES RELATIONSHIP CRITERIA
1 Key word stimulate I’m looking for process Topicality
Title
Name
2.1 Data time stimulate Time span process Topicality
Update time Currency
2.2 Cost stimulate Spend money to buy process Convenience
Metadata, clues, and relevance criteria were linked together through relational node coding
in order to link user attention with a series of cognitive responses. Cross node analysis was
performed on relational nodes to obtain weights. For instance, in Table 4, which shows an example
of partial cross analysis, when users saw data time, they thought about the time dimension
seven times, thought the data are new once, and thought the data are old three times.
Table 4 Example of partial
METADATA CROSSOVER CLUES DATA TIME AUTHOR PUBLISH TIME
cross analysis.
NODES
time dimension 7
time is new 1 4
time is too old 3 2
time span 7
continuous data 4
difficult to obtain 1
research content is similar 1
Skepticism 1
better known 24. RESULTS Zhang
Data Science Journal
9
DOI: 10.5334/dsj-2021-
Through the contextual experiment and interview, the following results were obtained. (1) Users
005
mainly paid attention to 45 types of scientific metadata, and used a total of nine relevance
criteria to make relevance judgments when searching for data. (2) The conceptual model was
validated. In a relevance judgment, the clues were the stimulus felt by the users when seeing
the metadata, and the relevance criterion was the response formed by the clues.
4.1 SCIENTIFIC DATA METADATA AND RELEVANCE CRITERIA
4.1.1 Scientific data metadata
As shown in Figure 4, 45 types of metadata and their dwell times were obtained. The longest
dwell time was for “name” (430,638 ms). The percentage of total dwell time spent on “name”
was 14.65%. The other metadata with the most dwell times were “data content” (8.2%),
“title” (7.25%), “keyword” (7.15%), and “data time (6.73%). The results in Figure 5 further
show that topicality was mainly invoked when the users saw metadata such as “name,” “data
content,” “title,” and “keyword.” Hence users spent most of their energy on topical judgment
(Balatsoukas, 2012). These metadata were common across all fields of study.
Figure 4 Dwell time for each
type of metadata.
Figure 5 Differences in AOI
data for the two groups.Users paid less attention to metadata with shorter dwell times. The shortest dwell time was Zhang 10
Data Science Journal
for “resolution” (1,212 ms), which accounted for 0.04% of the total dwell time. In addition, the DOI: 10.5334/dsj-2021-
dwell times for “CDs,”4 “citation frequency,” “reviewed,” and “gene function” were respectively 005
1,634 ms, 1,944 ms, 7,452 ms, and 8,278 ms, which accounted for 0.06%, 0.07%, 0.25%, and
0.28% of the total dwell time, respectively. These metadata varied according to field of study.
Users majoring in meteorological remote sensing paid attention to “resolution.” Users majoring
in biological genetics paid attention to “reviewed” and “gene function.”
Therefore, a comparative analysis was made on the different fields of study of the users. The users
majoring in bioscience, crop science, and feed research were classified as the “experimental”
group, because their main data were obtained from laboratory experiments, and the purpose of
data retrieval was mainly to compare those data with their own research data. The users majoring
in agriculture economics, meteorology, and regional development research were classified as
the “investigational” group, because their main data were collected from data-sharing platforms
such as NBS, NCBI, and the National Earth System Science Data Sharing Infrastructure.
The results of this comparative analysis show that there are significant differences in the
dwell times of some subject-relevant metadata, such as “data time,” “data content,” “gene
location,” “gene sequence,” “gene function,” and “experimental methods.” Investigational
users paid more attention to “data time and “data content” because data from the search
were their research objects and the research always had certain requirements with respect to
region and time. Experimental users paid more attention to “gene location,” “gene sequence,”
and “gene function,” which are subject-relevant metadata. Moreover, they performed a lot
of laboratory experiments, so “experimental methods” also was paid more attention.
At the same time, the study also found that there are no significant differences in metadata
common to the two groups such as “title,” “keyword,” “abstract,” “number of results,” and
“institute.” These metadata are essential for relevance judgment, regardless of the field of study.
4.1.2 Scientific data relevance criteria
Nine relevance criteria were obtained through data coding: topicality, availability, quality,
completeness, authority, currency, convenience, usability, and standardization (Table 5).
Table 5 Criteria definitions.
CRITERIA
Topicality The data is consistent with the user’s research, such as data related in terms of
content, time, and region.
Availability The user can obtain the data without any external factors (i.e. no access permission,
no download links, high prices, etc.).
Quality The quality of data, for example, whether the data is accurate, correct, and valid.
Standardization The data classification system and collection process are consistent with national
requirements.
Authority Users can trust this data, mainly referring to a person or an organization that
publishes influential data.
Comprehensiveness The data has full coverage, or the data is complete without missing any elements.
Convenience It is convenient to retrieve, obtain, and use the data.
Usability The data can be used without cognitive limitations or formatting problems.
Currency The data is valuable to the research and valid for only a certain period of time, such
as the publication date is recent, or not outdated.
Topicality was the most frequent criterion, and was 44.80% of all criteria nodes. Availability and
quality made up 12% and 11.20% of all criteria nodes, respectively. Their usage adds up to about
70% of all usage (Table 6). The use of topicality, availability, and quality accounts for the majority
of usage, and the remaining six criteria also play a significant role in the final relevance judgment.
However, frequency was not consistent with importance. For example, in the interview, one user
mentioned that “I am a student of geography; I want to see if the format is correct.” When the
currency, usability, standardization, and other criteria did not meet the users’ needs, users could
decide that the data were irrelevant, even if topicality and quality were satisfied well.
4 CDs: Coding Sequence, a term of structural genomics.Zhang 11
RELEVANCE CRITERIA NODES PERCENTAGE Data Science Journal
DOI: 10.5334/dsj-2021-
Topicality 168 44.80% 005
Availability 45 12.00%
Quality 42 11.20%
Completeness 32 8.53%
Authority 29 7.73%
Currency 20 5.33%
Convenience 16 4.27%
Usability 15 4.00%
Standardization 8 2.13%
Table 6 Percentages of
Total 375 100.00%
relevance criteria nodes.
The relevance criteria vary with respect to type of information carrier. The relevance criteria of
documents were the longest and most comprehensively studied. Scientific data and documents
are both generated in scientific research activities, serve scientific research, and are constantly
presented. However, there are also some differences between them. Documents contain
mature knowledge that has been extracted from scientific data by researchers. Therefore, a
comparison between documents and scientific data more clearly shows the changes caused
by the essential nature of different information carriers.
Barry, Schamber, Wang Peiling, Saracevic, Taylor and others have discussed the concepts of
document relevance criteria and their usage. However, because their discussions took place
in different contexts, the relevance criteria were different, and there is not yet any consensus
about what a set of criteria should contain. The document selection model studied by Wang
Peiling is the most similar to the concept model studied in this paper. Therefore, the document
relevance criteria derived in Wang’s research were compared with the scientific data relevance
criteria derived in this study.
As shown in Table 7, Wang Peiling proposed 11 document relevance criteria, and this article
proposes nine scientific data relevance criteria. A comparison of the two studies shows that
there are three unique criteria for scientific data: comprehensiveness, standardization, and
convenience. Accessibility is strengthened in importance and novelty disappears. Compared
with the criteria for documents, the criteria for data had higher purpose, pertinence, and
practicality, but also poorer substitutability. The purpose for users to retrieve scientific data was
mainly to support their own research analysis or conclusions, which requires high accuracy and
consistency. As some users mentioned, “I study the grain output in the past ten years, and
there is no 2009 output in this data set. I cannot perform the next analysis without this data. I
need to find it through other channels.” Therefore, the comprehensiveness of the data affected
the users’ relevance judgment. Moreover, each industry has its own data requirements, and
each data platform, unit, or laboratory has its own requirements for data. The irregularity of
Table 7 Comparison of
DOCUMENT RELEVANCE CRITERIA SCIENTIFIC DATA RELEVANCE CRITERIA
document and scientific data
Topicality 65.30% Topicality 44.80% relevance criteria.
Quanlity 9.40% Availability 12.00%
Scope 9.40% Quality 11.20%
Novelty 5.30% Completeness 8.53%
Currency 2.80% Authority 7.73%
Discipline 2.70% Currency 5.33%
Source 1.70% Convenience 4.27%
Authority 1.10% Usability 4.00%
Special need 1.00% Standardization 2.13%
Time cost 0.80%
Availability 0.20%data severely restricts data sharing and usage. Hence, the standardization of data also affects Zhang 12
Data Science Journal
the user’s relevance judgment. These problems do not exist in document relevance judgments, DOI: 10.5334/dsj-2021-
because the information transmitted by documents is broader than the information in data, 005
and they serve different purposes in scientific research.
Documents contain a large amount of information. Even if the original text cannot be obtained,
the main or key information can be obtained from the abstract. However, data are different.
The ultimate goal of users to retrieve data is to obtain and use data. If the data cannot be used,
their value will be greatly discounted. Therefore, the weight of availability increases in data
relevance judgment.
In conclusion, the difference in the behaviors of users lies in the essential difference between
scientific data and documents. Documents are laden with knowledge, whereas scientific
data are laden with facts. Knowledge is something that human beings can directly process
cognitively, but facts cannot be processed this way. Humans need to process the data using
instruments such as Power BI Desktop or CDAT. Therefore, when retrieving data, users pay more
attention to the availability of data and whether they can be further analyzed and processed.
4.2 RELATIONSHIP BETWEEN SCIENTIFIC DATA METADATA AND RELEVANCE
CRITERIA
As a whole, the relationship between metadata and relevance criteria can be summarized as
one stimulation to multiple responses and multiple stimulations to one response. There is an
intermediate element – clues – between metadata and relevance criteria. The users must first
experience the stimulation presented by the metadata, and this stimulation consists of clues.
Then, users process the stimulation to form the relevance criteria. The concept model was
verified by the experiment.
The relationships and weights among metadata, clues, and criteria are visualized in Figure 6.
The same metadata produced different stimulations through users’ eyes. For example, when
users see “name,” one might respond with matches my study, for example, “this index is the
main content of my research” (Participant 22). Someone else might respond with fits my needs,
for example, “according to my research, I’m looking for wheat, but there’s very little about
wheat” (Participant 7). When users see the “data time,” one might respond that data are old, for
example, “only the 2013 digital version is available, which is too old” (Participant 22). Another
person might respond with difficult to obtain, for example, “the latest data are hard to get”
(Participant 24). It highly depends on the user’s cognitive workspace, which is closely related to
work experience, research direction, and the user’s understanding of his/her problems.
As users responded to different stimulations, the relevance criteria invoked in the brain also
changed. When users could only download data from 2013, they used currency to judge
the relevance of the data. When users thought that data were difficult to obtain, they used
availability to judge the relevance of the data.
Different metadata will stimulate users to employ the same relevance criteria for relevance
judgment. When users focused on metadata such as “title,” “abstract,” “keyword,” “name,”
“data content,” “description,” or “species,” topicality was stimulated. For example, for “species” to
topicality: “I’m looking for a related species, but I don’t see it here.” (Participant 3); for “keyword”
to topicality: “I directly searched for bagasse, but I only saw an item about sweet potato. I thought
this study would be similar to mine, so I clicked on it.” (Participant 21); and for “title” to topicality:
“I read the title and it is not related to my search.” (Participant 25). When users focused on items
such as “auditable,” “journal,” “author,” and “institute,” authority was stimulated. For example,
for “auditable” to authority, “Auditable data5 is authority.” (Participant 7); and for “journal” to
authority: “The journals have great reputation. We might use data from very famous journals.”
Metadata related to topicality are the most complex and include subject-irrelevant metadata6
and subject-relevant metadata7 in different fields. Metadata related to other relevance criteria
5 Auditable data: data audited by a third party.
6 Subject-irrelevant metadata: metadata are irrelevant to the subject, such as “title”, “key word”, “abstract”,
“publish time” and so on.
7 Subject-relevant metadata: metadata are relevant to the subject, such as “gene location” and “gene
length” is relevant to genetics; “data format” and “data area” is relevant to geography.Zhang 13
Data Science Journal
Metadata stimulate Clues reaction Relevance critria DOI: 10.5334/dsj-2021-
Fit my need 005
Can not be used
Data can not be open Usability
I can open it
Need special software
16.67% Hard to get
100% 50%
16.67% 16.67% Can not download directly
Resolution I can download directly
Data Format 4.76% 61.9% I can share
4.76%
Download 9.52% Data is available Availability
14.29%
4.76%
Free 10%
75% I can afford it
25%
Link
10%
10% Data is free
50%
50% 66.67%
Chart 16.67 Links can not be open
100%
Share level
16.17% No direct link
Menu Visible
Data size 20% Narrow your search
15%
Registered 50% 100% I can share
Availability
Name No access rights
100%
Abstract No menu
Title 5.88% Troublesome
14.29%
5.88%
Key words 7.69% 100%
Detailed explanation
88.24% 33.33%
Recommended data 10% Interesting
Annotate 100% 85.71% I do not want these keywords
92.31%
References 20%
75% Professional data
100%
Accurate weight 3.13% Narrow your search
100%
Instrument type 100%
Regional dimension
Data content 83.33%
Fit my research
CDS 100%
41.67%
Fit my need Topicality
50%
Data area 8.33% Beyond the scope
66.67%
Species
16.67%
100% Research content is similar
16.67%
Gene location 50% 33.33%
33.33% Function similar
Gene length
100%
16.67% 33.33% I want this
33.33%
33.33%
Gene function Comprehensive introduction
Gene sequence 50% Time dimension
Gene structure 60%
14.29%
57.14% Find new study
25% 14.29%
Data description Time is too old
25%
21.88% Currency
Experiment methods 20% Time is new
14.29%
9.38%
28.13%
Authors 3.13% Inferred data
Data time 25% Data sources
Similar data Certified
Analyze results 8.33%
25%
50% Good university Authority
Match degree Famous institutions
Accuracy 12.5%
33.33%
100%
33.33% unknown
50%
assessed 50% Better reputation
25%
100%
Times Cited 100%
25%
Fits my need
16.67%
20%
Audited 66.67%
8.33% I can believe it
25%
100%
21.88%
20%
Number of results 25% High accuracy
8.33%
Missing data 66.67%
5% Peer review Quality
15%
Update time 100% More effective
Publish time Certified
Journal Suspicious
8.33
Institutes 16.67% Complete data
83.33%
Continuous data
Time span
Comprehensiveness
Comprehensive introduction
Data is little
Information blank
Fit my need
The experiment is standard
Standardization
The format is standard
Figure 6 Relationships
Data acquisition
specification among metadata, clues, and
relevance criteria.
(such as quality, authority, and availability) only include subject-irrelevant metadata. Twenty-
five types of metadata stimulated users to use topicality to make the relevance judgment, and
these types can be divided into three categories. The first category is subject-irrelevant metadata,
and this category includes metadata like “name,” “title,” “keyword,” “abstract,” “annotation,”
“author,” “recommended data,” “institute,” “links,” “description,” and “similar data.” The second
category is metadata related to meteorology, agricultural economics, and remote sensing and
includes “data area,” “data content,” and “data time.” The third category is metadata relatedto biology, genetics, and engineering and includes “gene function,” “gene length,” “gene Zhang 14
Data Science Journal
location,” “structure,” and “gene sequence.” However, nine metadata types stimulated users DOI: 10.5334/dsj-2021-
to use quality when making relevance judgments: “analyze results,” “auditable,” “author,” 005
“citation frequency,” “correct rate,” “experimental method,” “institute,” “matching degree,”
and “reviewed.” Five metadata stimulated users to use authority when making relevance
judgments: “author,” “journal,” “institute,” “auditable,” and “description.” Metadata associated
with quality and authority were irrelevant to subject. Hence, in the relevance judgments, the
differences in the metadata of different groups were mainly reflected in topicality.
Using the dwell times of metadata (Figure 4) and relationships among metadata and criteria
(Figure 6), the times spent on the nine relevance criteria were calculated (Table 8). Topicality
took the longest, accounting for 65.7% of the total time, followed by availability and quality,
which accounted for 6% and 5.89% of the total time, respectively. The criteria dwell times
represent users’ effort in scientific data retrieval.
Table 8 :Percentage of criteria
CRITERIA NODE NUMBER PERCENTAGE CRITERIA DWELL TIME PERCENTAGE
frequencies and dwell times
topicality 168 44.80% topicality 1932354 65.70%
availability 45 12.00% availability 176395 6.00%
quality 42 11.20% quality 173161 5.89%
completeness 32 8.53% convenience 170221 5.79%
authority 29 7.73% completeness 169633 5.77%
currency 20 5.33% authority 139940 4.76%
convenience 16 4.27% currency 122595 4.17%
usability 15 4.00% standardization 40100 1.36%
standardization 8 2.13% usability 16933 0.58%
total 375 100.00% total 2941332 100.00%
criteria dwell time = å metadata dwell timei * weighti
Regression analysis of the two groups data show a linear relationship (Figure 7), R2 = 0.967,
P = 0.000. The correlation is significant at the level of a = 0.05. The use frequency of relevance
criteria is positively correlated with the effort expended in relevance judgments. For example,
topicality was recorded 168 times in interview data, and users also spent the most energy on
topical-based relevance judgment.
Figure 7 Regression analysis of
Dwell-time two groups data.
R² = 0.967
2500000
2000000
1500000
1000000
500000
0
0 50 100 150 200
-500000
5. DISCUSSIONS
The study found nine scientific data relevance criteria, namely, topicality, availability, quality,
standardization, authority, comprehensiveness, convenience, usability and currency. Most
previous studies had focused on documents and web pages, with a few on images and video.
The research situation involved work, life, entertainment, etc. Research subjects included
professors, students, doctors, journalists, etc. The results showed there was an overlap between
the relevance criteria mentioned in this study and the previous studies with new criteriaemerged from the data analysis (Sarah Albassam, 2018). The appearances of new criteria Zhang 15
Data Science Journal
were directly related to the essence of information carriers. For example, images selection DOI: 10.5334/dsj-2021-
needed to consider resolution and size. Documents selection needed to consider languages. 005
Web pages selection needed to consider link security and information reliability. For scientific
data, comprehensiveness and standardization were two unique criteria. Comprehensiveness
focused on the continuity and integrity of data in time and regional sequences. Standardization
focused on data classification system and statistical methods. Because scientific data had a
strong professional, domain, and practicability, users had identified the need of data before the
retrieval, without inspiration. This was why many scholars mentioned novelty in their studies,
but it did not appear in this paper. At the same time, the study cannot ignore the influence of
external situation and user’s cognitive on the change of relevance criteria. Audrey Laplante
suggested that although research had found that some of the relevance criteria (quality and
authority) found in documents and web pages still applied to music environments, there would
be some unique music relevance criteria. As Saracevic pointed out, relevance research cannot
be separated from the situation, and should consider the dynamic interaction between the
internal and external factors of the situation.
More than one scholar tried to generalize a set of relevant criteria across different dimensions,
but without success (Schamber, 1996; Bales and Wang, 2005). There were two reasons, one
reason behind this difficulty was that different studies had various labels and definitions for
similar relevance criteria and the grouping/categorization of the findings also varied among
different studies. Another challenge in comparing relevance criteria studies was that various
methodologies had been applied in relevance criteria literature (Maglaughlin and Sonnenwald,
2002; Savolainen and Kari, 2006). Relevance was a multidimensional, dynamic process, and
information carrier was only one of the dimensions. Here, we could be sure that the change of
information carrier will certainly cause the change of relevance criteria.
Different users may have different responses when receiving the same stimulation, and may
have the same response when receiving different stimulation. In the Document selection model
put forward by Wang Peiling, a document (distal object) was represented by a set of document
information elements (metadata) as clues. Document information elements were processed
to judge a document on several criteria. This study enriched and expanded document selection
model, which not only clearly defined the concepts of information elements and clues, but also
explored the corresponding relations between them. Panos Balatsoukas and Gao Fei also used
eye tracker to study relevance criteria, but they all focused on the fixation of metadata and the
usage of relevance. They ignored the relationship between metadata, clues and criteria in the
information processing process. According Hochberg’s view of perception, participants were
able to perceive completely different shapes of the same physical stimulation. His perception
fundamentally determined his answers to questions about shape, motion, size, depth, etc. In
the relevance judgment, clues were the cognitive reflection after the user perceived the external
information, which related to the user’s cognitive workspace. For example, when seeing a data
from 2008, somebody said that was consistent with study time and somebody might think
the time was too old. The reason was user’s different needs and cognitive abilities. Human
perception involved inferences when it came to recognizing something, and this recognition
pattern explained why what we know determined what we see. Through analysis, it can be
seen that users’ cognitive workspace played a crucial role in the process from receiving to
perceiving and processing information. The workspace was a relatively stable cognitive state
formed under the long-term working and retrieval environment.
In relevance judgment, it was not only necessary to study how relevance criteria affect the
judgment process, but more importantly, how metadata affected the relevance judgment process
through criteria. The interpretation of informational clues provides a novel approach to deepen
empirical research on how people use information content (Savolainen, 2010). Such research
efforts would provide opportunities to take one step closer to the goal proposed by Gerstberger
and Allen (1968), that is, to explore “the actual process of using the information”. Topicality was
the fundamental criterion, and users spend the most energy on it and use it most frequently (Abe
Crystal; Rahayu A Hamid; Sedghi, 2013; Sarah Albassam, 2018). Student used titles, summaries,
and connectedness to topic as prime metadata when making web pages judgment (Watson,
2013). Users used titles, key words, and abstract to topic as prime metadata of relevance when
making documents judgment. And users used name, data area, data content, species and soon to topic as prime metadata of relevance when making scientific data judgment. So even if Zhang 16
Data Science Journal
users used the same criteria to judge relevance under different information carriers, there were DOI: 10.5334/dsj-2021-
differences in the metadata they paid attention to. Only by understanding the fixation differences 005
of these metadata can we better improve the scientific data sharing system.
Combined with eye movement data and interview data, it was found that the frequency of
criteria usage was positively correlated with the amount of attention spent on it. The study used
eye tracker collecting eye movement data, such as the number and length of fixations, which
could reveal a more accurate picture of the cognitive effort spent by users during the relevance
judgment process (Balatsoukas, 2012). Users spent the most attention on topicality, more than
60%. The other relevance criteria took less than 10% attention. This was consistent with the
anchoring adjustment strategy in the judgment decision. At the beginning, attention will be
focused on the topicality, which was an anchor. Subsequently, other criteria were insufficient
adjustments to this anchor, like accessibility, quality, authority, etc. (Reid Hastie, 2004).
6. CONCLUSIONS
The main purpose of this paper was to explore metadata, relevance criteria, and the
relationship between them. An eye tracker recorded the attention paid to metadata by users
during the retrieval. Relevance criteria usage were obtained from interviews. The combination
of quantitative data obtained by the eye tracker (fixation duration) and qualitative data
obtained via interviews (relevance criteria, clues and other nodes) makes these research results
convincing.
Users pay attention to 45 metadata when retrieving scientific data. The 45 metadata can be
divided into subject-irrelevant metadata and subject-relevant metadata. Subject-irrelevant
metadata includes “name”, “key words”, “abstract”, and so on. And there are no significant
differences in subject-irrelevant metadata between investigational users and experimental
users. Subject-relevant metadata includes “gene location”, “gene length”, “resolution”, and so
on. Investigational users paid more attention to “data time and “data content” because data
from the search were their research objects and the research always had certain requirements
with respect to region and time. Experimental users paid more attention to “gene location,”
“gene sequence,” and “gene function,” which are subject-relevant metadata.
Nine relevance criteria for scientific data were found in the study, respectively, topicality,
availability, quality, completeness, authority, currency, convenience, usability, and
standardization. Because of the essential difference between scientific data and documents,
users use different criteria. Documents are laden with knowledge, whereas scientific data are
laden with facts. Knowledge is something that human beings can directly process cognitively,
but facts cannot be processed this way. Humans need to process the data using instruments.
Therefore, when retrieving data, users pay more attention to the availability of data and
whether they can be further analyzed and processed.
When retrieving scientific data, different users may have different responses when receiving
the same stimulus or the same response when receiving different stimuli. The metadata
stimulating topicality are the most complex and include subject-irrelevant metadata and
distinctive subject-relevant metadata. The metadata stimulating other criteria (such as quality
and authority) have no obvious subject-relevant characteristics.
This paper analyzed the process of relevance judgment for scientific data from the perspective of
information cognitive processing. The concepts of metadata, clues, and relevance criteria were
clearly defined through a situation experiment combining eye tracking experiments with interviews.
This paper provided a theoretical and empirical basis for the next stage in the study of the
normal form equation of scientific data relevance judgment based on the lens model. The
practical significance of this study is that it enables the more targeted improvement of a
scientific data sharing system, such as changing the presentation of pages and providing
personalized services for users with different needs. This research not only determined the
metadata that users mainly care about and the relevance criteria of scientific data that are
frequently used, it also found the corresponding relationships among them.You can also read