Relationship between Apgar scores and long term cognitive outcomes in individuals with Down syndrome
←
→
Page content transcription
If your browser does not render page correctly, please read the page content below
www.nature.com/scientificreports
OPEN Relationship between Apgar scores
and long‑term cognitive outcomes
in individuals with Down syndrome
Laura del Hoyo Soriano1*, Tracie C. Rosser2, Debra R. Hamilton2, Danielle J. Harvey1,
Leonard Abbeduto1 & Stephanie L. Sherman2
This study examined the contribution of the Apgar score at 1 and 5 min after birth to later cognitive
functioning in 168 individuals with Down syndrome who were between 6 and 25 years of age at
time of cognitive testing. Our results showed that a lower Apgar score at 1 min was related to a
worse performance in later cognitive measures of receptive vocabulary, verbal comprehension and
production, visual memory and working memory. Results also showed that a lower Apgar score at
5 min was only related to worse later outcomes of verbal comprehension and production and auditory
working memory. Our findings suggest a need for future studies investigating how specific perinatal
events reflected in the Apgar score are linked to later cognitive functioning in individuals with Down
syndrome.
Down syndrome (DS) is the most common known genetic cause of intellectual disability (ID) and results from
an extra copy of all or part of chromosome 211. DS is a complex condition that affects both physical and cognitive
development. Although the DS phenotypic features are variable, when compared either to typical developing
(TD) controls or to other neurodevelopmental disorders (NDDs), a distinctive cognitive profile is generally
observed. This profile is characterized by a general cognitive delay, relative strengths in nonverbal abilities, and
impairments beyond mental age expectances in language, phonological processing, verbal memory and verbal
working memory2–6. However, it is important to note that the cognitive phenotype described above is variable
across individuals with D S 7.
For example, one study reported that standard deviations for implicit memory scores were almost three times
larger in a group of individuals with DS compared with a cognitive-level matched group of TD individuals;
indeed, some individuals with DS even outperformed TD c ontrols8. Several other studies have shown that other
cognitive areas, such as executive function, attention, and language are also quite variable across individuals
with DS5,9–12.
Understanding which factors contribute to the observed within-syndrome variability is crucial, and one of
the main challenges to an etiology-specific approach to intervention for those with DS13. In this regard, previous
investigations have suggested that differences in genetic14–16 and environmental factors17,18 between individuals
with DS are related to the degree of impairment in specific cognitive and behavioral areas. In addition, certain
comorbidities associated with trisomy 21 (i.e., congenital heart defects, sleep disorders, low thyroid function)
are also thought to contribute to this variability19–23. Among the factors contributing to this variability, those
occurring in the perinatal period (starting with the 20th or 28th week of gestation through the 1st or 4th week
rain24.
after birth) may be of special importance because this is a period of great vulnerability for the developing b
Drawing on studies in the euploid population, the association between perinatal events and long-term cogni-
tion is well established25–35. In this regard, the Apgar scoring system is an indicator of perinatal adverse events
and vulnerabilities36. It is based on clinician observation of the newborn’s skin complexion, heart rate, reflex
irritability, muscle tone, and respiratory effort, with lower scores reflective of greater problems37. The score is
typically assigned at 1 min and 5 min after delivery. Studies have suggested that a low Apgar score at 1 min often
reflects acute perinatal events compromising oxygen availability at b irth38 which may influence neurodevelop-
mental pathways related to cognitive f unctioning39. In addition to delivery complications, a low Apgar score at
5 min has been suggested to reflect events or conditions prior to birth (e.g., abnormalities of gestational length
and prenatal growth, congenital malformation)40, which may have an impact on neurodevelopment41,42 and
cognitive function43. It is important to note that those events and conditions occurring during pregnancy can
1
Department of Psychiatry and Behavioral Sciences, MIND Institute University of California Davis, Sacramento,
CA, USA. 2Department of Human Genetics, Emory University School of Medicine, Atlanta, GA, USA. *email:
ldelhoyo@ucdavis.edu
Scientific Reports | (2021) 11:12707 | https://doi.org/10.1038/s41598-021-90651-3 1
Vol.:(0123456789)
www.nature.com/scientificreports/
lead to acute perinatal events compromising oxygen availability at birth, as well events such as hypoxic-ischemic
encephalopathy, hypotony. Consequently, the 1- and 5-min Apgar scores are influenced by overlapping sets of
factors and are thus highly c orrelated40,44. Perinatal hypoxia is further thought to have especially serious effects
on the hippocampus and prefrontal cortex, which are responsible for several neurocognitive functions including
memory, language, executive function and attention. Thus, perinatal hypoxia has been shown to account for the
subsequent profile of long-term cognitive impairment in the general population45. For example, one study showed
that compared to controls, children with perinatal asphyxia had smaller hippocampal volumes that were associ-
ated with poorer long-term visuospatial memory46. Another study showed that even mild oxygen deprivation
at, or immediately after, birth was related to an increased risk of developmental delays later in childhood: those
with mild to moderate acidosis (a measure of risk of hypoxia) displayed significantly lower (p < 0.05) verbal and
visuospatial test scores than the low-risk g roup47. Importantly, the group with higher perinatal blood acidity had
lower Apgar scores at both 1 min and 5 min compared to the low-risk group. Although profound perinatal events
may cause obvious neurological deficit, milder problems may also cause more subtle defects in functioning that
are detectable only later as the child develops35,48.
Although most follow-up studies examining the long-term prognostic value of Apgar scores on child out-
comes have focused on extremely low Apgar scores at 5 min30,49, some have examined the developmental corre-
lates across the entire spectrum of recorded Apgar scores (0–10) at 1 and 5 min31–33. These latter studies support
the hypothesis that even mild degrees of concerns at birth can be associated with long-term cognitive problems.
For example, in a study of more than 150,000 children (ages 5–7 years)32, lower Apgar scores at 1 and 5 min
that were still within the so-called normal range (7–9) were associated with a significant increase in risk of poor
developmental outcomes (e.g., language, cognitive development, and general knowledge).
Other studies have reported that infants with low transient Apgar scores at 1 min are at risk for long-term
negative developmental consequences even if their scores improve at the 5- and 10-min r eadings31,50. For example,
a study of 452 children with Attention-Deficit/Hyperactivity Disorder (ADHD) showed that infants with “poor”
(≤ 6) Apgar scores at 1 min had more severe ADHD symptoms later in childhood. This same study reanalyzed the
data including only children who had normal Apgar scores ≥ 7) at 5 min, and the results were similar (i.e., low
1-min scores predicted worse outcomes later), suggesting that even transient low scores at 1 min are enough to
lead to an increase in ADHD symptomatology. In a similar line, another study on more than 170,000 participants
reported that infants who had low Apgar scores at 1 min had higher risk of low IQ scores at age 18, even if these
infants achieved a normal (> 7) Apgar score at 5 min31.
Although Apgar scores have prognostic value for the general population, there are no comparable data for
DS. This is unfortunate because such data would be valuable in (a) suggesting the need for research into the
role of specific neonatal characteristics and perinatal events in producing different cognitive outcomes among
individuals with DS and (b) highlighting those infants with DS most in need of particular early and intensive
behavioral supports and intervention. The present study, therefore, was designed to determine whether Apgar
scores at 1 and 5 min in newborn infants with DS are associated with impairments in specific cognitive domains
(e.g., attention, memory, executive functioning, and language) previously related to perinatal events in other
populations in later childhood, adolescence, and early adulthood, after controlling for important individual,
demographic, and environmental factors. We hypothesized that individuals with DS with a lower Apgar score at
1 or 5 min compared to those with higher Apgar scores will exhibit more severe cognitive difficulties later in life.
Methods
Participants. The participants were drawn from the Down Syndrome Cognition Project (DSCP), which has
generated previous p ublications51–53, although none with the specific aims of the present study. Participants and
measures reported here are a subset of those from the larger study. See Ref.51 for further details regarding study
procedures and data collection.
Participants in the current study were 168 individuals with DS (81 females and 87 males), aged 6 to 25 years
at the time of the cognitive evaluation (M = 13.5; SD = 4.8), and for whom English is the primary language spoken
at home. Participants were included in the DSCP study if: (1) the trisomy 21 had been verified by karyotype; (2)
the biological mother was available for participation; and (3) birth history was available. The participating mother
provided written consent, and participants with DS provided verbal or written assent (when capable), before
data collection. Participants were excluded from the DSCP study if they had: (1) other chromosomal anomalies;
(2) a gestational age(GA) < 35 weeks; (3) > 7 days in NICU only if gestational age was 35–37; (4) > 48 h of oxygen
support only if gestational age was 35–37; (5) lack of oxygen at birth greater than 5 min; (6) untreated epilepsy
or other seizure disorder; (7) a history of head injury, chemotherapy, or accidental poisoning; (8) untreated
severe hearing or vision loss; or (9) an incidence of a loss of consciousness > 5 min. From the initial sample of
338 participants, 29 were excluded from the DSCP study due to the following reasons: > 7 days at NICU only if
gestational age was 35–37 (3), lack of oxygen at birth greater than 5 min (5), history of head injury (1), history
of chemotherapy (1), the trisomy 21 was not verified by karyotype (4), untreated severe vision loss (1), untreated
severe hearing loss (1), untreated epilepsy or other seizure disorder (6), no birth history (2), and gestational age
less than 35 weeks (5). Permission to obtain medical records, collection, and abstraction of those records was
obtained once families consented. In addition to these 29 excluded participants, 141 participants were excluded
from the current study due to not having information from medical records about Apgar scores at 1 and 5 min
after birth.
Measures. The Apgar score at 1 min after birth and the Apgar score at 5 min after birth were abstracted
from medical records. The Apgar scoring system is a comprehensive screening tool used to evaluate the new-
born’s physical condition54. It is given at birth by a clinical health professional who evaluates five variables: heart
Scientific Reports | (2021) 11:12707 | https://doi.org/10.1038/s41598-021-90651-3 2
Vol:.(1234567890)
www.nature.com/scientificreports/
rate, respiratory effort, muscle tone, reflex irritability, and color. Each element is scored 0, 1, or 2. A total score
between 0 and 3 categorizes the baby as severely depressed, from 4 to 6 as moderately depressed and from 7 to
10 as normal. This evaluation is done at 1 min and 5 min after birth in all infants. In general, a 10-min score is
required only for infants who score 7 or less at the 5-min Apgar score, and for those requiring resuscitation as
a method for monitoring response37. For this reason, only 8 participants (1 missing value) had 10-min Apgar
scores. Due to the small sample size, we are only able to provide descriptive statistics on these 7 participants
(Table 2).
We also obtained socio-demographic information about the participants with DS and their family (e.g., race
of the participant with DS, household income, and maternal level of education) via maternal questionnaire.
In addition, participants with DS were administered a set of cognitive measures that targeted the constructs
of verbal cognition, fluid reasoning and visual processing, attention, memory and learning, and visual and audi-
tory working memory as measures of executive function. The measures selected have all been used in previously
published studies involving children, adolescents, and young adults with D S10,55,56.
The Verbal Knowledge and the Riddles subtests from the Kaufman Brief Intelligence Test (KBIT-2)57 were
used as general measures of verbal cognition. The Verbal Knowledge subtest measures receptive vocabulary.
This subtest consists of 60 items. The examiner says a word or asks a question and the participant responds by
pointing to the picture that best answers the question. The score is determined by the number of items success-
fully answered by the participant (items correct), with possible scores ranging from 0 to 60. The Riddles subtest
measures verbal comprehension and production. The subtest consists of 48 items. In each item, the examiner
says a verbal riddle and the participant responds by pointing to a picture or saying a word that answers the rid-
dle. The score is determined by the number of items answered correctly, with the possible range being 0 to 48.
The Matrices subtest, which is also part of the KBIT-2, was included as a measure of fluid reasoning (involving
solving novel problems) and visual processing (involving perceptual, manipulation, and thinking abilities in a
visual context)58. The subtest consists of 46 multiple-choice items. For the first nine items, the examinee chooses
which of five pictures best matches concepts portrayed in the single stimulus picture. For Items 10 to 46, the
examinee must choose which of six pictures best completes a matrix. The score is the number of items answered
correctly, with possible range being 0 to 46.
The Simple Reaction Time (SRT) subtest from the Cambridge Neuropsychological Test Automated Battery
(CANTAB)59 was included as a general measure of attention; this test specifically measures speed of response
to a single stimulus. The participant must press the button on a press pad as soon as they see a square appearing
in the middle of the screen. Intervals between the participant’s response and the onset of the next stimulus are
variable during task performance. The median response latency (in milliseconds) was used for the analyses.
The Paired-Associates Learning (PAL) subtest from the C ANTAB59 was used to assess visual associative
memory and learning. In this task, the participant is presented with patterns shown one at a time in different
locations around an empty central space on the screen. Next, a single pattern is presented in the center of the
screen and the examinee needs to touch where that pattern was shown previously. The number of patterns in each
set increases with success at each stage (ranging from 1 pattern to a maximum of 8 patterns), and the participant
has up to 10 opportunities per pattern length to touch the correct locations. The participant’s overall success is
typically determined by the highest set of patterns located correctly (ranging from 0 to 8). However, we used the
first trial memory score due to observed ceiling effects on this outcome. This score corresponds to the number
of patterns correctly located summed across all the patterns completed (range 0–26).
The Spatial Span (SSP; forward recall) is also a subtest of the CANTAB and assesses visual working memory.
The SSP is a computerized version of the Corsi Block task in which participants are required to copy a sequence
of blocks that are displayed one at a time in the same order as they were originally presented. The number of
boxes in the sequence increases from 2 boxes at the start level of the test to 9 boxes at the final stage (stage 8).
The test is terminated when the participant fails three consecutive trials at any one stage. The participant’s overall
success is typically determined by the longest sequence successfully recalled. However, we used the SSP Total
Errors (adjusted) for the number of items presented as our primary variable of interest to avoid observed floor
effects. The SSP Total Errors (adjusted) is a measure of the participant’s efficiency in attempting the test. Thus,
whilst a participant may pass all 8 stages, a substantial number of errors may be made in doing so. Therefore, it
is crucial to note that participants failing at any stage of the test have had less opportunity to make errors than
participants who complete the test. The SSP Total Errors (adjusted) measure compensates for this difference in
opportunity. As stated in the CANTAB manual, the Total Errors (adjusted) is calculated by summing the number
of stages not attempted and subtracting the number of stages completed divided by the span length (number
of boxes) of the last stage attempted from it. This result is then multiplied by the number of trials allowed per
stage (three). For example, for a participant who successfully passed the first two stages with just one trial per
stage but did not pass the third stage after the 3 attempts, the score would be: ((5 − (3/4)) × 3 = 12.75, while for a
participant who passed the first three stages with just one trial per stage but did not pass the fourth stage after
the 3 trials would be: ((4 − (4/5)) × 3 = 9.6. Note that lower scores reflect better performance.
The Recall of Digits Forward is a subtest of the Differential Ability Scales (DAS-II)60 and was used to assess
auditory working memory. In this task, participants listen to a sequence of random digits read aloud by the exam-
iner and then immediately recall the sequence in the same order as presented. The length of the sequence starts
at 2 and increases to a maximum of 10 digits, stopping when the participant can no longer recall the sequences
correctly. The score used is the total number of sequences correctly recalled. Scores range from 0 to 38.
We detected the presence of ceiling or floor effects in the cognitive variables by computing frequencies and
percentages for each outcome. Measures on which 15% or more of the sample obtained the maximum or the
minimum score, and/or exhibited a significant absolute skewness index (> 2), were categorized as having ceil-
ing or floor effects. As previously indicated, for those specific variables showing floor or ceiling effects, we used
another variable derived from that same test.
Scientific Reports | (2021) 11:12707 | https://doi.org/10.1038/s41598-021-90651-3 3
Vol.:(0123456789)www.nature.com/scientificreports/
AF RF (%)
Sex of participant with DS
Male 80 47.6
Female 87 51.8
Missing data 1 0.06
Race of participant with DS
African American 14 8.3
Hispanic 3 1.8
Other 22 13.1
Caucasian 128 76.6
Missing data 1 0.06
Household income
$10,000–$25,000 3 1.8
$25,000–$50,000 13 7.7
$50,000–75,000 30 17.9
$75,000–100,000 27 16.1
> $100,000 93 55.4
Missing data 2 0.1
Maternal education level
Less than high school 1 0.6
Completed high school or equivalent 9 5.4
Completed technical school 8 4.8
Completed 1–3 years of college 22 13.1
Bachelor’s degree or 4 years of college 75 44.6
Master’s degree 36 21.4
Doctoral or professional degree 15 8.9
Missing data 2 0.1
Paternal education level
Less than high school 1 0.6
Completed high school or equivalent 14 8.3
Completed technical school 10 6
Completed 1–3 years of college 16 9.5
Bachelor’s degree or 4 years of college 67 39.9
Master’s degree 26 15.5
Doctoral or professional degree 19 11.3
Missing data 14 8.3
Table 1. Descriptive analysis of the sociodemographic parameters of the 168 participants with DS and their
families. First column shows values for absolute frequencies, and second column shows values for relative
frequencies. DS Down syndrome, AF absolute frequency, RF relative frequency.
Statistical analysis. The first step was to conduct a descriptive analysis of the sociodemographic and clini-
cal parameters and the cognitive outcomes. Results are described using means, standard deviations, and ranges
for numeric variables and absolute and relative frequencies for categorical variables (see Tables 1, 2). In addition,
the magnitude of the difference between the Apgar score at 1 and 5 min was calculated with Cohen’s effect size
for repeated measures (“Cohen’s d”)61, along with the 95% confidence interval. We categorized the difference as
“large” if effect size differences were greater than 1 pooled standard deviation (|d|> 1)). In addition, the magni-
tude of change for each participant was graphically represented as a spaghetti plot in Fig. 1. Finally, in order to
analyze whether scores at 1 min were significantly related to the Apgar score at 5 min, as well as to the magnitude
of change between both scores, we examined the correlation between the Apgar score at 1 min, the Apgar score
at 5 min, and the magnitude of the difference between the Apgar score at 1 and 5 min. This association was evalu-
ated using Spearman’s correlation coefficient since data from the Apgar score were not normally distributed in
our sample.
For the primary analyses, we first examined the association between Apgar score at 1 and at 5 min and cog-
nitive outcomes (i.e., the median latency in milliseconds from SRT, the first trial memory score from PAL, the
total errors adjusted from SSP Forward, and the total number of correct responses for Recall of Digits Forward,
Verbal Knowledge, Riddles, and Matrices) with each of the following potential covariates: (1) chronological
age (CA) of participant with DS at time of cognitive evaluation, (2) sex of participant with DS, (3) maternal
age at birth, (4) maternal level of education, and (5) family income. These associations were evaluated using
Scientific Reports | (2021) 11:12707 | https://doi.org/10.1038/s41598-021-90651-3 4
Vol:.(1234567890)www.nature.com/scientificreports/
n Mean SD Min–Max Missing data
At birth data
Maternal age at birth 167 35.21 4.84 22–47 1
Apgar score at 1 min after birth 168 7.45 1.5 1–10 0
Apgar score at 5 min after birth 168 8.65 0.64 6–10 0
Apgar score at 10 min after birth 7 8.71 0.49 8–9 1
Data collected at time of cognitive testing
Chronological age of participant with DS 167 13.54 4.85 6–25 1
SRT (latency in milliseconds) 145 686.29 316.17 242.5–2090.5 23
PAL (first trial memory score) 163 8.29 6.49 0–25 5
SSP forward (total errors adjusted) 146 17.1 4.47 6.8–24 22
Recall of digits forward (total number correct) 135 7.49 4.87 0–25 33
Verbal knowledge (total number correct) 166 14.91 8.31 0–33 2
Riddles (total number correct) 166 9.85 5.71 0–23 2
Matrices (total number correct) 166 12.67 6.36 0–29 2
Table 2. Descriptive statistics of clinical and cognitive data of the 168 participants with DS. The first set of
measures is related to the data collected at birth for the participants with DS. The second set of measures are
those collected at the time of testing (6 to 25 years after birth). Results are described using central tendency
(mean values) and variability (standard deviation and range) for numeric variables, and absolute and relative
frequencies for categorical variables. Missing values were primarily due to administrative issues, technical
issues, or the participant not being compliant. n number of participants, SD standard deviation, min minimum
value reported, max maximum value reported, DS Down syndrome, SRT simple reaction time, PAL paired-
associates learning, SSP spatial span.
Figure 1. Spaghetti plot representing Apgar score trajectory from one to five minutes after birth in each
participant with DS. Each line represents a participant with DS. Several trajectories overlap between them.
Scientific Reports | (2021) 11:12707 | https://doi.org/10.1038/s41598-021-90651-3 5
Vol.:(0123456789)www.nature.com/scientificreports/
Spearman’s correlation coefficient for numeric variables not normally distributed, Pearson’s correlation coef-
ficient for numeric variables normally distributed and ANOVA models for categorical variables. Correction for
multiple tests was performed using the Bonferroni procedure to maintain a familywise alpha level of p ≤ 0.05.
In the primary analyses, we examined the contribution of the Apgar score to prediction of each cognitive
outcome, with the 1- and 5-min scores included in separate simultaneous regression models. The regression
models were adjusted, when necessary, for potential covariates (i.e., if a potential covariate was related (p < 0.05)
with Apgar scores or cognitive outcomes). This approach led to only CA being added as a covariate in all the
models. Predictor variables were added to each regression model simultaneously. See Tables 4 and 5 for a visual
representation of each model. Supplementary analyses were conducted to fit models that included both the 1-
and 5-min Apgar scores in the same model as well as CA. In the supplementary analyses, we also assessed the
indirect effect of the 1-min Apgar score on cognitive outcomes through a possible mediator (i.e., the 5-min Apgar
score). Confidence intervals for the indirect effect were constructed based on 5000 bootstrapped samples; if the
confidence interval includes zero, there is no evidence of mediation. Because ours is the first analysis on this
topic, we provide unadjusted p-values. However, we also indicate which p-values are significant at a familywise
p ≤ 0.05 after adjusting for multiple comparisons through the Bonferroni correction procedure (bolded values
in tables). Finally, due to a considerable number of missing values for the outcome measures of SSP, PAL and
Digits, we conducted sensitivity analyses that entailed parallel regression models with only those participants
who had no missing value for any cognitive measure (n = 106). Note that all the cognitive variables included in the
models were normally distributed (e.g., skewness (− 1, 1) and (− 2, 2) for kurtosis).All analyses were performed
using the statistical software packages SPSS (Version 18.0; SPSS Inc., Chicago, IL, USA), with the exception of
the bootstrapped confidence interval for the indirect effect, which were conducted using R (version 4.0.3; The
R Foundation for Statistical Computing, Vienna, Austria)62,63.
Ethical approval. This study was approved by the Institutional Review Boards (IRB) of each participating
site; Emory University (IRB00005100); University of California, Davis (IRB395392-1); University of Arizona
(IRB00001751), Johns Hopkins University (IRB00031164), Oregon Health & Science University (IRB00003602),
Children’s National Medical Center (IRB:Pro00002478), University of Wisconsin-Madison (IRB:SE-2010-0016)
and University of Illinois Urbana-Champaign (IRB#17424).
The authors assert that all procedures contributing to this work comply with the ethical standards of the
relevant national and institutional committees on human experimentation and with the Helsinki Declaration
of 1975, as revised in 2008. Informed consent was obtained from the parent or guardian of each participant
before testing.
Results
Sociodemographic characteristics of the sample are presented in Table 1. Descriptive data for the clinical and
cognitive measures of interest are presented in Table 2 along with the sample size (and missing values) for each
variable. As seen in Fig. 1, the Apgar score significantly improved from 1 to 5 min (95% CI [0.81, 1.62]; df = 168;
|d|= 1.8). For example, 25 participants (15% of the sample) had an Apgar score < 7 at 1 min after birth, but only
1 participant (0.05% of the sample) had an Apgar score < 7 at 5 min after birth. All 56 participants with an Apgar
score < 8 at 1 min improved their score at 5 min. For those 87 participants with an Apgar score of 8 at 1 min, 14
had the same score at 5 min and 73 improved to 9. Of those 24 participants with an Apgar score of 9 at 1 min,
20 stayed the same and 4 improved. For the 1 participant with an Apgar score of 10 at 1 min, her Apgar score
at 5 min stayed the same. The Apgar scores at 1 and 5 min were significantly correlated (r = 0.66; 95% CI [0.6,
0.7]); df = 168; p < 0.001). In addition, Apgar scores at 1 min were negatively correlated with the magnitude of
change between the Apgar score at 1 min and 5 min (r = − 0.81; 95% CI [− 0.9, − 0.7]); df = 168; p < 0.001). Thus,
the lower the Apgar score at 1 min, the greater the improvement from 1 to 5 min.
With the exception of CA of the participants at the time of cognitive testing, we found no significant associa-
tions between the demographic variables (maternal level of education, maternal age at childbirth, family income,
and sex of participants with DS) and either the Apgar scores or any of the cognitive outcomes. As expected, CA
of the participant was positively correlated with all cognitive outcomes (Table 3).
In the primary analyses, the linear regression models showed that the Apgar score at 1 min predicted the
number of correct items on the Verbal Knowledge (β = 0.99; df = 163; p < 0.01) and the Riddles (β = 0.24; df = 163;
p = 0.001) subtests of the KBIT-2, the number of patterns correctly located after the first trial on the PAL sub-
test of the CANTAB (β = 0.25; df = 160; p < 0.01), the number of adjusted mistakes on the SSP subtest of the
CANTAB (β = -− 0.20; df = 143; p = 0.014) and the total number of sequences correctly recalled on the Recall of
Digits Forward subtest of the DAS-II (β = 0.25; df = 132; p < 0.01). See Table 4 for the results for the regression
models for the primary analyses and Fig. 2 for an illustration of the findings. In all cases, a higher Apgar score
was associated with better performance on the cognitive outcome. The Apgar score at 1 min, however, did not
predict the level of performance in the remaining cognitive assessments (SRT and the Matrices subtest). The
Apgar score at 5 min predicted only the number of correct items on the Riddles subtest of the KBIT-2 (β = 0.17;
df = 163; p = 0.02) and the total number of sequences correctly recalled on the Recall of Digits Forward subtest
of the DAS-II (β = 0.17; df = 132; p = 0.05); again, a higher Apgar score predicted a better score on the cognitive
outcomes (see Table 5 for the regression results and Fig. 3 for an illustration of the findings).
Similar results were found in the sensitivity analyses in which only those participants who completed all the
cognitive tasks were included. In particular, the Apgar score at 1 min predicted the following outcome meas-
ures while adjusting for CA: Verbal Knowledge (β = 0.20; df = 105; p = 0.01) and the Riddles (β = 0.26; df = 105;
p = 0.005) subtests of the KBIT-2, the number of patterns correctly located after the first trial on the PAL subtest
of the CANTAB (β = 0.22; df = 105; p = 0.02), the number of adjusted mistakes on the SSP subtest of the CANTAB
Scientific Reports | (2021) 11:12707 | https://doi.org/10.1038/s41598-021-90651-3 6
Vol:.(1234567890)www.nature.com/scientificreports/
Apgar
Verbal Apgar at at
SRT PAL SSP Digits knowledge Riddles Matrices 1 min 5 min
Family income
F − 0.12 − 0.05 − 0.04 0.41 0.11 0.09 0.04 0.08 0.08
p-value 0.89 0.53 0.68 0.64 0.16 0.24 0.66 0.33 0.29
[− 0.05, [− 0.05, [− 0.05, [− 0.05, [− 0.05.
95% CI [− 0.05, 0.01] [− 0.05, − 0.01] [− 0.05, − 0.01] [− 0.04, 0.21]
0,1] 0.06] 0.12] 0.87] 0.06]
N 144 162 145 134 165 165 166 166 166
Maternal educational level
F 0.78 0.56 0.7 0.34 1.32 2.3 1.4 2 1.69
p-value 0.56 0.73 0.63 0.89 0.27 0.06 0.21 0.05 0.8
[− 0.06, [− 0.06, [− 0.06, [− 0.06, [− 0.06,
95% CI [− 0.06, 0.05] [− 0.06, 0.04] [− 0.06, 0.1] [− 0.06, 0.18]
0.19] 0.05] 0.17] 0.11] 0.13]
N 144 162 145 134 165 165 166 166 166
Maternal age at birth
r 0.20 − 0.76 − 0.03 0.04 − 0.12 − 0.13 − 0.08 − 0.06 − 0.12
Sig 0.02 0.34 0.75 0.66 0.13 0.09 0.29 0.42 0.14
[− 0.35, [− 0.24, [− 0.34, [− 0.28, [− 0.24,
95% CI [− 0.05, 0.39] [− 0.28, 0.09] [− .0.34, 0.08] [− .015, 0.3]
0.03] 0.2] 0.08] 0.09] 0.2]
N 145 163 146 135 166 166 166 167 167
Chronological age of participant with DS
r − 0.35 0.22 − 0.29 0.22 0.52 0.41 0.37 − 0.17 − 0.20
p-value < 0.001*** < 0.01** < 0.001*** 0.01* < 0.001*** < 0.001*** < 0.001*** 0.05 0.13
[0.04, [0.16, [0.31, [− 0.35,
95% CI [− 0.49, − 0.01] [− 0.49, − 0.13] [0.22, 0.54] [0.01, 0.49] [− 0.38, − 0.16]
0,37] 0.29] 0.65] 0.1]
N 145 163 146 135 166 166 166 167 167
Sex of participant with DS
F 0.11 0.41 0.19 0.83 1.38 3.15 1.81 0.01 0.09
p-value 0.74 0.53 0.67 0.36 0.24 0.08 0.18 0.93 0.75
[− 0.01, [− 0.01, [− 0.01, [− 0.01, [− 0.01,
95% CI [− 0.01, 0.02] [− 0.01, − 0.01] [− 0.01, 0.13] [− 0.01, 0.03]
0.04] 0.05] 0.19] 0.08] 0.04]
N 145 163 146 135 166 166 166 167 167
Table 3. Association between Apgar scores and cognitive outcomes with each of the potential covariates. r
coefficient of correlation, F ANOVA F-value, 95% CI 95% Confidence Intervals, N sample size, SRT simple
reaction time: median latency in milliseconds, PAL paired-associates learning: first trial memory score, SSP
spatial span Forward: total errors adjusted; Recall of Digits Forward (Digits), Verbal Knowledge, Riddles and
Matrices total number correct. Bolded p-values are those which remained significant after correcting for
multiple comparisons (p < 0.001).
(β = − 0.27; df = 105; p < 0.01), and the total number of sequences correctly recalled on the Recall of Digits-
Forward subtest of the DAS-II (β = 0.31; df = 105; p = 0.001). In addition, the sensitivity analyses showed that the
Apgar score at 5 min predicted only the number of correct items on the Matrices subtest of the KBIT-2 (β = 0.19;
df = 105; p = 0.05) and the total number of sequences correctly recalled on the Recall of Digits-Forward subtest
of the DAS-II (β = 0.19; df = 105; p = 0.05).
In the supplementary analyses, we fit models that included both the 1- and 5-min Apgar scores in the same
model (see Supplementary Table S1). Due to their high correlation and thus collinearity, results of these models
should be interpreted with caution. In general, the magnitude of the coefficients for the 1-min Apgar score
were reduced relative to the primary analyses, although still statistically significant assuming an unadjusted
p-value < 0.05. The magnitude of the coefficients for the 5-min Apgar score also were reduced relative to the
primary analyses, but lost significance for the few outcomes for which it was significant in the primary analysis.
A further evaluation of the 5-min Apgar score as a possible mediator in the model found insufficient evidence
of the mediation (Supplementary Table S1).
Discussion
The current study was designed to determine whether Apgar scores at 1 and 5 min post-delivery in newborn
infants with DS are associated with cognitive functioning in later childhood, adolescence, and early adulthood
(after controlling for relevant sociodemographic variables).
We found that the Apgar score at 1 min predicted long-term cognitive outcomes related to receptive vocabu-
lary, verbal comprehension and production, verbal and visual working memory, and visual memory and learn-
ing, but not outcomes reflecting visual attention, or fluid reasoning and visual processing. Previous research has
suggested that a low Apgar score at 1 min may reflect acute events compromising oxygen availability during the
birth process38,64. Studies conducted in the euploid population suggest that, in babies born prematurely, even
Scientific Reports | (2021) 11:12707 | https://doi.org/10.1038/s41598-021-90651-3 7
Vol.:(0123456789)www.nature.com/scientificreports/
Explanatory variable N β Partial R2 df 95% Confidence interval p-value Dependent variable
Apgar Score at 1 min − 0.11 − 0.11 [− 60.70, 11.72] 0.18
145 142 SRT (latency)
Chronological age − 0.38 − 0.37 [− 36.29, − 14.87] < 0.001
Apgar Score at 1 min 0.25 0.19 [0.16, 1.47] < 0.01
163 160 PAL (first trial memory score)
Chronological age 0.30 0.25 [0.14, 0.54] < 0.001
Apgar Score at 1 min − 0.20 − 0.20 [− 1.07, − 1.24] 0.01
146 143 SSP forward (total errors adjusted)
Chronological age − 0.32 − 0.32 [− 0.45, − 0.16] < 0.001
Apgar Score at 1 min
0.25 0.26 [0.28, 1.32] < 0.01
Chronological age 135 132 Digits forward (total number correct)
Chronological age 0.26 [0.09, 0.41] < 0.01
Apgar Score at 1 min 0.99 0.21 [0.26, 1.72] < 0.01 Verbal knowledge (total number
166 163
Chronological age 0.94 0.54 [0.71, 1.17] < 0.001 correct)
Apgar Score at 1 min
0.24 0.26 [0.37, 1.43] < 0.01
Chronological age 166 163 Riddles (total number correct)
Chronological age 0.45 0.45 [0.07, 0.70] < 0.001
Apgar Score at 1 min 0.13 0.14 [− 0.06, 1.17] 0.08
166 163 Matrices (total number correct)
Chronological age 0.39 0.39 [0.33, 0.71] < 0.001
Table 4. Apgar score at 1 min associated with cognitive outcomes while adjusting for chronological age at
time of cognitive testing: results from regression analyses. N sample size, R coefficient of correlation, df degrees
of freedom, SRT simple reaction time, PAL paired-associates learning, SSP spatial Span, Digits Forward recall of
digits forward. Bolded p-values are those which remained significant after Bonferroni correction (p ≤ 0.007) for
multiple comparisons. Confidence interval corresponds to the unstandardized coefficient.
Figure 2. Partial regression plots representing the association between the Apgar score at 1 min (x-axis) and the
following dependent variables (y-axis) from the top left to the bottom right: Riddles, Recall of Digits Forward,
PAL(first trial memory score) and Verbal Knowledge, while adjusting for chronological age (CA) at time of
cognitive testing. See that the score on cognitive variables (Y) increases as Apgar score ( X1) increases adjusting
for chronological age (X2). PAL paired-associates learning.
minor bouts of hypoxia at birth may be associated with damage to periventricular white matter47. In addition,
neonatal white matter abnormality has been shown to be an important predictor of later abilities related to pro-
ducing, understanding, and synthesizing speech and language in otherwise typically developing children at age
765. Although our results are consistent with these findings of potential hypoxia-induced white matter damage, it
is important to recognize that an Apgar score at 1 min might reflect problems other than hypoxia or respiratory
Scientific Reports | (2021) 11:12707 | https://doi.org/10.1038/s41598-021-90651-3 8
Vol:.(1234567890)www.nature.com/scientificreports/
Explanatory variable N β Partial R2 df 95% Confidence interval p-value Dependent variable
Apgar Score at 5 min − 0.12 − 0.13 [− 141.97, 16.24] 0.12
145 142 SRT (latency)
Chronological age − 0.38 − 0.37 [− 35.64, − 14.7] < 0.01
Apgar Score at 5 min 0.05 0.05 [− 1.05, 2.1] 0.51
163 160 PAL (first trial memory score)
Chronological age 0.23 0.23 [.1, .51] < 0.01
Apgar Score at 5 min − 0.07 − 0.08 [− 1.66, 0.62] 0.37
146 143 SSP forward (total errors adjusted)
Chronological age − 0.30 − 0.30 [− 0.43, − 0.13] < 0.001
Apgar Score at 5 min 0.17 0.17 [0.01, 2.6] < 0.05
135 132 Digits forward (total number correct)
Chronological age 0.25 0.24 [0.08, 0.40] < 0.01
Apgar Score at 5 min 0.12 0.14 [− 0.14, 3.37] 0.07 Verbal knowledge (total number
166 163
Chronological age 0.53 0.53 [0.69, 1.14] < 0.001 correct)
Apgar Score at 5 min 0.17 0.19 [0.31, 2.86] 0.02*
166 163 Riddles (total number correct)
Chronological age 0.43 .43 [0.35, 0.68] < 0.001
Apgar Score at 5 min 0.14 0.14 [− .06, 1.17] 0.06
166 163 Matrices (total number correct)
Chronological age 0.39 0.39 [0.33, 0.71] < 0.001
Table 5. Apgar score at 5 min associated with cognitive outcomes while adjusting for chronological age at
time of cognitive testing: results from regression analyses. N sample size, R coefficient of correlation, df degrees
of freedom, SRT simple reaction time, PAL paired-associates learning, SSP spatial Span, Digits Forward recall of
digits forward. Bolded p-values are those which remained significant after Bonferroni correction (p ≤ 0.007) for
multiple comparisons. Confidence interval corresponds to the unstandardized coefficient.
distress66. In addition, it is important to note that one of the exclusion criteria of the DSCP was suffering from
lack of oxygen at birth for more than 5 consecutive minutes. Thus, our results suggest the need for future research
to confirm the causal pathways to cognitive impairment for which the 1-min Apgar score might be a proxy.
Most of our results reflecting the link between greater long-term cognitive difficulties and a lower Apgar
score are related to the Apgar score at 1 min rather than at 5 min. In fact, the Apgar score at 5 min only predicted
long-term cognitive outcomes related to verbal comprehension, verbal production, and verbal working memory.
In interpreting this finding, it is important to point out that nearly all of our participants showed considerable
improvement in their Apgar scores over the first 5 min after birth. Moreover, there was more variability in the
1-min Apgar score than in the 5-min score; thus, there may have been improved ability to detect an association in
the former score. At the same time, however, these results are consistent with findings from the euploid popula-
tion in that, despite being highly correlated40,44, the 1- and 5-min Apgar scores are not reflective of identical risk
factors and thus, can have different developmental c onsequences39,41–43.
The fact that a lower Apgar score at 1 min was related to a greater improvement in the score at 5 min sug-
gests that even transient low Apgar scores at 1 min predict long-term cognitive difficulties in individuals with
DS. These results, again, are in line with some of the previous studies in the euploid population showing that
improvement in the Apgar score from 1 to 5 min immediately after birth is still associated with developmental
vulnerability31,32. However, these studies had sample sizes large enough to do an analysis for each group that had
a specific Apgar score at 1 min. Thus, we would need a higher number of participants with compromised Apgar
scores at 1 and 5 min to confirm that hypothesis.
Nonetheless, it is important to point out that although most of our participants were in the “normal” range
of Apgar scores (i.e., 7 to 10) at both 1 min (85.2%) and 5 min (99.4%), a lower Apgar score was still associated
with greater long-term cognitive difficulties. This finding, too, is in line with some previous results in the euploid
population32, suggesting that developmental adversity may be best understood as a linear function across the
full range of scores. This observation is important because both research and clinical practice generally empha-
size the increased risks of adverse outcomes associated with “below normality” (i.e., < 7) Apgar score, generally
disregarding those babies within the normal range (i.e., 7–10).
Finally, the observed associations between cognitive outcomes and the Apgar score at 1 min and 5 min were
more pervasive in the verbal domains of cognition. These results could be due to the specific cognitive outcome
measures selected for the constructs of interest rather than the constructs themselves, thereby reflecting meth-
odological differences in the measures. However, the fact that literature indicates that verbal skills usually lag
behind nonverbal cognitive skills for individuals with D S67,68 suggests that there should be a neurodevelopmental
explanation for that trend in our results; language ability is one of the most impaired skills across their l ifespan69.
Thus, brain areas associated with verbal skills may be the most vulnerable to other forms of injury and insult in
DS. Whether this enhanced vulnerability to early insult is specific to DS, however, will require comparable data
on other ID-related conditions. In addition, it is important to note that similar results were found when includ-
ing only those participants who completed all the cognitive tasks and had no missing data values; therefore, our
results suggest that the observed differences in the regression models are not due to the characteristics of the
participants who completed or failed to complete all the cognitive measures.
Limitations. Participants in the present study are part of a larger study (DSCP) in which GA < 35, lack of
oxygen at birth for more than 5 min and other perinatal events were exclusion criterions. Including participants,
Scientific Reports | (2021) 11:12707 | https://doi.org/10.1038/s41598-021-90651-3 9
Vol.:(0123456789)www.nature.com/scientificreports/
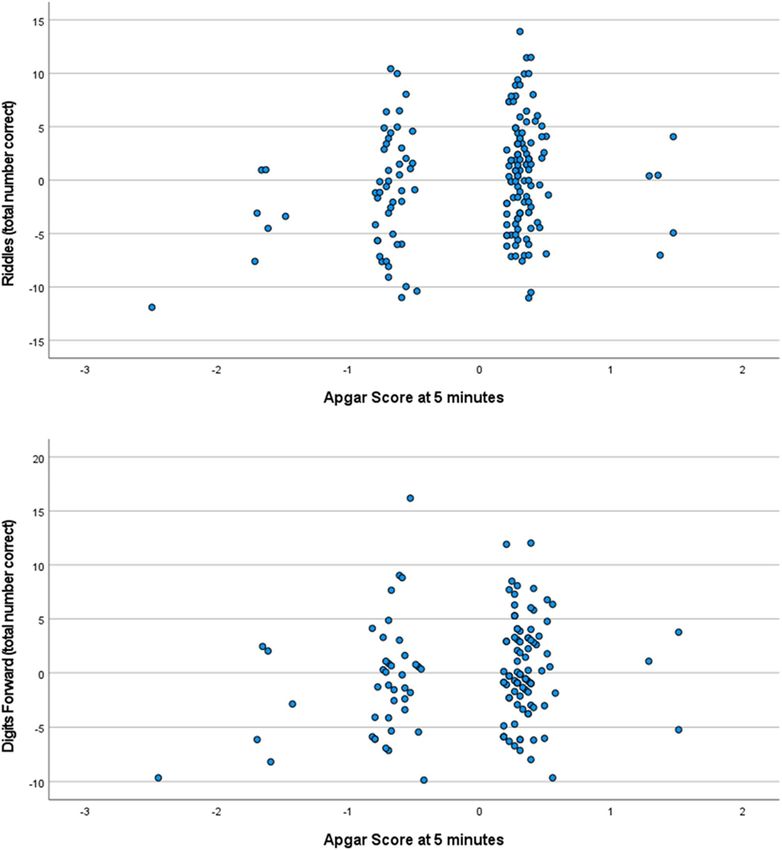
Figure 3. Partial regression plots representing the association between the Apgar score at 5 min (x-axis) and
the following dependent variables (y-axis): Riddles and Recall of Digits Forward (total correct), while adjusting
for chronological age (CA) at time of cognitive testing. See that the score on cognitive variables (Y) increases as
Apgar score ( X1) increases adjusting for chronological age (X2).
for example, with GA < 35 would have increased the likelihood of having a broader range of Apgar scores at both
1 and 5 min and probably more participants with Apgar scores at 10 min. Thus, our results may underestimate
the full impact of perinatal events and risk factors on cognition in individuals with DS.
Conclusion
In summary, our study shows that even transient low Apgar scores at 1 min (not necessarily within the abnormal
range of < 7) are associated with lower cognitive functioning in concrete cognitive areas at 6 to 25 years of age in
individuals with DS. These results provide clinicians with valuable prognostic information and the justification
Scientific Reports | (2021) 11:12707 | https://doi.org/10.1038/s41598-021-90651-3 10
Vol:.(1234567890)www.nature.com/scientificreports/
to carefully monitor infants with DS who show even mildly compromised Apgar score at 1 and 5 min. However,
the Agar scores account for only a small proportion of variance in the cognitive outcomes. Thus, more research
is needed to determine: (1) whether the contribution of the 1- and 5-min Apgar score to later cognitive vari-
ability is clinically meaningful and (2) how many other factors, including those relevant long after the perinatal
period, are important. Moreover, the Apgar score is a proxy for a number of risk factors and adverse events (e.g.,
oxygen availability at birth, delivery method, passive immunity, gestational age, among others) which will need
to be identified in future research.
Data availability
The datasets used and/or analyzed during the current study are available from the corresponding author upon
reasonable request.
Received: 21 April 2020; Accepted: 12 May 2021
References
1. Patterson, D. Genetic mechanisms involved in the phenotype of Down syndrome. Ment. Retard. Dev. Disabil. Res. Rev. 13(3),
199–206. https://doi.org/10.1002/mrdd.20162 (2007).
2. Pennington, B. F., Moon, J., Edgin, J., Stedron, J. & Nadel, L. The neuropsychology of Down syndrome: Evidence for hippocampal
dysfunction. Child Dev. 74(1), 75–93 (2003).
3. Rowe, J., Lavender, A. & Turk, V. Cognitive executive function in Down’s syndrome. Br. J. Clin. Psychol. 45(Pt 1), 5–17. https://doi.
org/10.1348/014466505X29594 (2006).
4. Godfrey, M. & Lee, N. R. Memory profiles in Down syndrome across development: A review of memory abilities through the
lifespan. J. Neurodev. Disord. https://doi.org/10.1186/s11689-017-9220-y (2018).
5. del Hoyo, S. L., Thurman, A. J. & Abbeduto, L. Specificity: A phenotypic comparison of communication-relevant domains between
youth with down syndrome and fragile X syndrome. Front. Genet. 9, 424. https://doi.org/10.3389/fgene.2018.00424 (2018).
6. Loveall, S. J., Conners, F. A., Tungate, A. S., Hahn, L. J. & Osso, T. D. A cross-sectional analysis of executive function in Down
syndrome from 2 to 35 years. J. Intellect. Disabil. Res. 61(9), 877–887. https://doi.org/10.1111/jir.12396 (2017).
7. Thomas, M. S. C. et al. A multi-level developmental approach to exploring individual differences in Down syndrome: Genes, brain,
behaviour, and environment. Res. Dev. Disabil. 104, 103638. https://doi.org/10.1016/j.ridd.2020.103638 (2020).
8. Vicari, S., Bellucci, S. & Carlesimo, G. A. Implicit and explicit memory: A functional dissociation in persons with Down syndrome.
Neuropsychologia 38(3), 240–251 (2000).
9. Del, H. L. et al. Semantic verbal fluency pattern, dementia rating scores and adaptive behavior correlate with plasma Aβ42 con-
centrations in Down syndrome young adults. Front. Behav. Neurosci. 9, 301. https://doi.org/10.3389/fnbeh.2015.00301 (2015).
10. de Sola, S. et al. A new cognitive evaluation battery for Down syndrome and its relevance for clinical trials. Front. Psychol. 6, 708.
https://doi.org/10.3389/fpsyg.2015.00708 (2015).
11. Lanfranchi, S., Jerman, O., Dal Pont, E., Alberti, A. & Vianello, R. Executive function in adolescents with Down syndrome. J.
Intellect. Disabil. Res. 54(4), 308–319. https://doi.org/10.1111/j.1365-2788.2010.01262.x (2010).
12. Munir, F., Cornish, K. M. & Wilding, J. A neuropsychological profile of attention deficits in young males with fragile X syndrome.
Neuropsychologia 38(9), 1261–1270. https://doi.org/10.1016/S0028-3932(00)00036-1 (2000).
13. Fidler, D. J., Philofsky, A. & Hepburn, S. L. Language phenotypes and intervention planning: Bridging research and practice. Ment.
Retard. Dev. Disabil. Res. Rev. 13(1), 47–57. https://doi.org/10.1002/mrdd.20132 (2007).
14. Papoulidis, I. et al. A patient with partial trisomy 21 and 7q deletion expresses mild Down syndrome phenotype. Gene 536(2),
441–443. https://doi.org/10.1016/j.gene.2013.11.078 (2014).
15. del Hoyo, L. et al. VNTR-DAT1 and COMTVal158Met genotypes modulate mental flexibility and adaptive behavior skills in down
syndrome. Front. Behav. Neurosci. https://doi.org/10.3389/fnbeh.2016.00193 (2016).
16. Mason, G. M., Spanó, G. & Edgin, J. Symptoms of attention-deficit/hyperactivity disorder in Down syndrome: Effects of the
dopamine receptor D4 gene. Am. J. Intellect. Dev. Disabil. 120(1), 58–71. https://doi.org/10.1352/1944-7558-120.1.58 (2015).
17. Karmiloff-Smith, A. et al. The importance of understanding individual differences in Down syndrome. F1000Research 5, 389.
https://doi.org/10.12688/f1000research.7506.1 (2016).
18. Moore, D., Oates, J., Hobson, R. & Goodwin, J. Cognitive and social factors in the development of infants with Down syndrome.
Down Syndr. Res. Pract. 8(2), 43–52. https://doi.org/10.3104/reviews.129 (2002).
19. Alsaied, T. et al. Does congenital heart disease affect neurodevelopmental outcomes in children with Down syndrome?. Congenit.
Heart Dis. 11(1), 26–33. https://doi.org/10.1111/chd.12322 (2016).
20. Edgin, J. O., Pennington, B. F. & Mervis, C. B. Neuropsychological components of intellectual disability: The contributions of
immediate, working, and associative memory. J. Intellect. Disabil. Res. 54(5), 406–417. https://doi.org/10.1111/j.1365-2788.2010.
01278.x (2010).
21. del Hoyo Soriano, L. Epigallocatechin-3-gallate combined with cognitive training in young adults with Down syndrome phase II clini-
cal trial: Important considerations for treatment- efficacy evaluation on cognitive and functional improvement. 2016. Autonomous
University of Barcelona, PhD dissertation. https://ddd.uab.cat/pub/tesis/2016/hdl_10803_393993/ldhs1de1.pdf. Accessed 2 Nov
2019.
22. Visootsak, J., Hess, B., Bakeman, R. & Adamson, L. B. Effect of congenital heart defects on language development in toddlers with
Down syndrome. J. Intellect. Disabil. Res. 57(9), 887–892. https://doi.org/10.1111/j.1365-2788.2012.01619.x (2013).
23. Visootsak, J. et al. Neurodevelopmental outcomes in children with Down syndrome and congenital heart defects. Am. J. Med.
Genet. A 155(11), 2688–2691. https://doi.org/10.1002/ajmg.a.34252 (2011).
24. Hruby, R., Maas, L. M. & Fedor-Freybergh, P. G. Early brain development toward shaping of human mind: an integrative psycho-
neurodevelopmental model in prenatal and perinatal medicine. Neuro Endocrinol. Lett. 34(6), 447–463 (2013).
25. Vuillerot, C., Marret, S. & Dinomais, M. Long term outcome of perinatal stroke. Arch. Pediatr. 24(9), 51–60. https://doi.org/10.
1016/S0929-693X(17)30332-9 (2017).
26. Perna, R. B., Loughan, A. R., Le, J. A. & Hertza, J. Prenatal and perinatal anesthesia and the long-term cognitive sequelae: A review.
Appl. Neuropsychol. Child. 4(1), 65–71. https://doi.org/10.1080/21622965.2013.779275 (2015).
27. Ahearne, C. E., Boylan, G. B. & Murray, D. M. Short and long term prognosis in perinatal asphyxia: An update. World J. Clin.
Pediatr. 5(1), 67. https://doi.org/10.5409/wjcp.v5.i1.67 (2016).
28. Linsell, L., Malouf, R., Morris, J., Kurinczuk, J. J. & Marlow, N. Prognostic factors for poor cognitive development in children born
very preterm or with very low birth weight a systematic review. JAMA Pediatr. 169(12), 1162–1172. https://doi.org/10.1001/jamap
ediatrics.2015.2175 (2015).
29. Montgomery, K. S. Apgar scores: Examining the long-term significance. J. Perinat. Educ. 9(3), 5–9. https://doi.org/10.1624/10581
2400X87716 (2000).
Scientific Reports | (2021) 11:12707 | https://doi.org/10.1038/s41598-021-90651-3 11
Vol.:(0123456789)www.nature.com/scientificreports/
30. Stuart, A., Otterblad Olausson, P. & Källen, K. Apgar scores at 5 minutes after birth in relation to school performance at 16 years
of age. Obstet. Gynecol. 118(2 Pt 1), 201–208. https://doi.org/10.1097/AOG.0b013e31822200eb (2011).
31. Odd, D. E., Rasmussen, F., Gunnell, D., Lewis, G. & Whitelaw, A. A cohort study of low Apgar scores and cognitive outcomes.
Arch. Dis. Child Fetal Neonatal. Ed. 93(2), F115–F120. https://doi.org/10.1136/adc.2007.123745 (2008).
32. Razaz, N. et al. One-minute and five-minute Apgar scores and child developmental health at 5 years of age: A population-based
cohort study in British Columbia, Canada. BMJ Open 9(5), e027655. https://doi.org/10.1136/bmjopen-2018-027655 (2019).
33. Razaz, N. et al. Five-minute Apgar score as a marker for developmental vulnerability at 5 years of age. Arch. Dis. Child Fetal Neo-
natal. Ed. 101(2), F114–F120. https://doi.org/10.1136/archdischild-2015-308458 (2016).
34. Sucksdorff, M. et al. Preterm birth and poor fetal growth as risk factors of attention-deficit/hyperactivity disorder. Pediatrics 136(3),
e599–e608. https://doi.org/10.1542/peds.2015-1043 (2015).
35. Gonzalez, F. F. & Miller, S. P. Does perinatal asphyxia impair cognitive function without cerebral palsy?. Arch. Dis. Child Fetal
Neonatal. Ed. 91(6), F454–F459. https://doi.org/10.1136/adc.2005.092445 (2006).
36. Linnet, K. M. et al. Gestational age, birth weight, and the risk of hyperkinetic disorder. Arch. Dis. Child. 91(8), 655–660. https://
doi.org/10.1136/adc.2005.088872 (2006).
37. American Academy of Pediatrics, Committee on Fetus and Newborn, American College of Obstetricians and Gynecologists &
Committee on Obstetric Practice. The Apgar Score. Adv. Neonatal Care 6, 220–223. https://doi.org/10.1016/j.adnc.2006.04.008
(2006).
38. Gonzales, G. F. & Salirrosas, A. Arterial oxygen saturation in healthy newborns delivered at term in Cerro de Pasco (4340 m) and
Lima (150 m). Reprod. Biol. Endocrinol. 3, 46. https://doi.org/10.1186/1477-7827-3-46 (2005).
39. Allievi, A. G. et al. Maturation of sensori-motor functional responses in the preterm brain. Cereb. Cortex 26(1), 402–413. https://
doi.org/10.1093/cercor/bhv203 (2016).
40. Ehrenstein, V. Association of Apgar scores with death and neurologic disability. Clin. Epidemiol. 1, 45. https://doi.org/10.2147/
clep.s4782 (2009).
41. Liang, W. & Chikritzhs, T. Obstetric conditions and risk of first ever mental health contact during infancy, childhood and adoles-
cence. Midwifery 28(4), 439–444. https://doi.org/10.1016/j.midw.2011.06.003 (2012).
42. Batstra, L., Neeleman, J., Elsinga, C. & Hadders-Algra, M. Psychiatric morbidity is related to a chain of prenatal and perinatal
adversities. Early Hum. Dev. 82(11), 721–729. https://doi.org/10.1016/j.earlhumdev.2006.03.003 (2006).
43. Ehrenstein, V. et al. Association of Apgar score at five minutes with long-term neurologic disability and cognitive function in a
prevalence study of Danish conscripts. BMC Pregn. Childbirth. https://doi.org/10.1186/1471-2393-9-14 (2009).
44. Seikku, L. et al. Asphyxia, neurologic morbidity, and perinatal mortality in early- term and postterm birth. Pediatrics 137(6),
e20153334. https://doi.org/10.1542/peds.2015-3334 (2016).
45. Nalivaeva, N. N., Turner, A. J. & Zhuravin, I. A. Role of prenatal hypoxia in brain development, cognitive functions, and neuro-
degeneration. Front. Neurosci. https://doi.org/10.3389/fnins.2018.00825 (2018).
46. Annink, K. V. et al. The long-term effect of perinatal asphyxia on hippocampal volumes. Pediatr. Res. 85(1), 43–49. https://doi.
org/10.1038/s41390-018-0115-8 (2019).
47. Hopkins-Golightly, T., Raz, S. & Sander, C. J. Influence of slight to moderate risk for birth hypoxia on acquisition of cognitive and
language function in the preterm infant: A cross-sectional comparison with preterm-birth controls. Neuropsychology 17(1), 3–13.
https://doi.org/10.1037/0894-4105.17.1.3 (2003).
48. Lindström, K., Lagerroos, P., Gillberg, C. & Fernell, E. Teenage outcome after being born at term with moderate neonatal encepha-
lopathy. Pediatr. Neurol. 35(4), 268–274. https://doi.org/10.1016/j.pediatrneurol.2006.05.003 (2006).
49. Moster, D., Lie, R. T. & Markestad, T. Joint association of Apgar scores and early neonatal symptoms with minor disabilities at
school age. Arch. Dis. Child. Fetal Neonatal Ed. 86(1), F16–F21. https://doi.org/10.1136/FN.86.1.F16 (2002).
50. Grizenko, N. et al. Apgar Scores are associated with attention-deficit/hyperactivity disorder symptom severity. Can. J. Psychiatry.
61(5), 283–290. https://doi.org/10.1177/0706743716635544 (2016).
51. Rosser, T. C. et al. Associations between medical history, cognition, and behavior in youth with Down syndrome: A report from
the down syndrome cognition project. Am. J. Intellect. Dev. Disabil. 123(6), 514–528. https://doi.org/10.1352/1944-7558-123.6.
514 (2018).
52. Edgin, J. O. et al. Development and validation of the Arizona cognitive test battery for Down syndrome. J. Neurodev. Disord. 2(3),
149–164. https://doi.org/10.1007/s11689-010-9054-3 (2010).
53. Channell, M. M. et al. Characteristics associated with autism spectrum disorder risk in individuals with Down syndrome. J. Autism
Dev. Disord. 49(9), 3543–3556. https://doi.org/10.1007/s10803-019-04074-1 (2019).
54. Apgar, V. A proposal for a new method of evaluation of the newborn infant. Anesth. Analg. 120(5), 1056–1059. https://doi.org/10.
1213/ANE.0b013e31829bdc5c (2015).
55. Liogier d’Ardhuy, X. et al. Assessment of cognitive scales to examine memory, executive function and language in individuals with
Down syndrome: Implications of a 6-month observational study. Front. Behav. Neurosci. 9, 300. https://doi.org/10.3389/fnbeh.
2015.00300 (2015).
56. Edgin, J. O. et al. The Arizona cognitive test battery for down syndrome: Test-retest reliability & practice effects. Am. J. Intellect.
Dev. Disabil. 122(3), 215–234. https://doi.org/10.1352/1944-7558-122.3.215 (2017).
57. Kaufman, A. S. & Kaufman, N. L. Kaufman Brief Intelligence Test 2nd edn. (Pearson, Inc., 2004).
58. Flanagan, D. P., Ortiz, S. O. & Alfonso, V. C. Essentials of Cross-Battery Assessment (Wiley, 2013).
59. Robbins, T. W. et al. A study of performance on tests from the CANTAB battery sensitive to frontal lobe dysfunction in a large
sample of normal volunteers: Implications for theories of executive functioning and cognitive aging. J. Int. Neuropsychol. Soc. 4,
474–490 (1998).
60. Elliott, C. D. Differential Ability Scales-II (Harcourt Assessment, Berlin, 2007).
61. Lakens, D. Calculating and reporting effect sizes to facilitate cumulative science: A practical primer for t-tests and ANOVAs. Front.
Psychol. 4, 863. https://doi.org/10.3389/fpsyg.2013.00863 (2013).
62. R Core Team. R: A language and environment for statistical computing. R Foundation for Statistical Computing. https://w ww.r-p roje
ct.org/ (2020). Accessed 12 May 2021.
63. Revelle, W. Procedures for Psychological, Psychometric, and Personality Research. R package psych version 2.1.3. https://cran.r-proje
ct.org/package=psych (2021). Accessed 12 May 2021.
64. Chauhan, S., Singh, P. K., Gahalaut, P. & Prasad, P. L. Correlation of pulse oximetry and apgar scoring in the normal newborns. J.
Clin. Neonatol. 2(1), 20–24. https://doi.org/10.4103/2249-4847.109241 (2013).
65. Reidy, N. et al. Impaired language abilities and white matter abnormalities in children born very preterm and/or very low birth
weight. J. Pediatr. 162(4), 719–724. https://doi.org/10.1016/j.jpeds.2012.10.017 (2013).
66. American Academy of Pediatrics, Committee on Fetus and Newborn, American College of Obstetricians and Gynecologists,
Committee on Obstetric Practice. The Apgar Score. Adv. Neonatal Care 6(4), 220–223. https://doi.org/10.1016/j.adnc.2006.04.
008 (2006).
67. Martin, G. E., Klusek, J., Estigarribia, B. & Roberts, J. E. Language characteristics of individuals with Down syndrome. Top. Lang.
Disord. 29(2), 112–132. https://doi.org/10.1097/TLD.0b013e3181a71fe1 (2009).
68. Abbeduto, L., Warren, S. F. & Conners, F. A. Language development in Down syndrome: From the prelinguistic period to the
acquisition of literacy. Ment. Retard. Dev. Disabil. Res. Rev. 13(3), 247–261. https://doi.org/10.1002/mrdd.20158 (2007).
Scientific Reports | (2021) 11:12707 | https://doi.org/10.1038/s41598-021-90651-3 12
Vol:.(1234567890)www.nature.com/scientificreports/
69. Abbeduto, L., McDuffie, A., Thurman, A. J. & Kover, S. T. Language development in individuals with intellectual and developmental
disabilities. In International Review of Research in Developmental Disabilities (eds Abbeduto, L. et al.) 71–118 (Elsevier, 2016).
https://doi.org/10.1016/bs.irrdd.2016.05.006
Acknowledgements
This work was funded primarily by the LuMind IDSC Foundation. Additional support was provided by NIH
Grants P50HD103526, P30HD03352, and U54HD090256. We thank the families who participated in this study
and the many members of the Down Syndrome Cognition Project (DSCP) who conducted site recruitment and
performance-based testing.
Author contributions
L.H.S. led the study conception and study design. L.H.S. was responsible for the statistical procedures and pre-
pared figures and tables. All authors were responsible for interpretation of the data, as well as drafting and revising
the manuscript. T.C.R. and D.R.H. were responsible for the collection and quality control of clinical data. D.J.H.
reviewed the statistical procedures. All authors critically revised and approved the manuscript.
Competing interests
The authors declare no competing interests.
Additional information
Supplementary Information The online version contains supplementary material available at https://doi.org/
10.1038/s41598-021-90651-3.
Correspondence and requests for materials should be addressed to L.d.H.
Reprints and permissions information is available at www.nature.com/reprints.
Publisher’s note Springer Nature remains neutral with regard to jurisdictional claims in published maps and
institutional affiliations.
Open Access This article is licensed under a Creative Commons Attribution 4.0 International
License, which permits use, sharing, adaptation, distribution and reproduction in any medium or
format, as long as you give appropriate credit to the original author(s) and the source, provide a link to the
Creative Commons licence, and indicate if changes were made. The images or other third party material in this
article are included in the article’s Creative Commons licence, unless indicated otherwise in a credit line to the
material. If material is not included in the article’s Creative Commons licence and your intended use is not
permitted by statutory regulation or exceeds the permitted use, you will need to obtain permission directly from
the copyright holder. To view a copy of this licence, visit http://creativecommons.org/licenses/by/4.0/.
© The Author(s) 2021
Scientific Reports | (2021) 11:12707 | https://doi.org/10.1038/s41598-021-90651-3 13
Vol.:(0123456789)You can also read