Reduction of image artifacts induced by change in the optode coupling in time-resolved diffuse optical tomography
←
→
Page content transcription
If your browser does not render page correctly, please read the page content below
Reduction of image artifacts induced by
                 change in the optode coupling in
                 time-resolved diffuse optical tomography

                 Ryo Fukuzawa
                 Shinpei Okawa
                 Shoko Matsuhashi
                 Takashi Kusaka
                 Yukari Tanikawa
                 Yoko Hoshi
                 Feng Gao
                 Yukio Yamada

Downloaded From: https://www.spiedigitallibrary.org/journals/Journal-of-Biomedical-Optics on 01 Feb 2022
Terms of Use: https://www.spiedigitallibrary.org/terms-of-use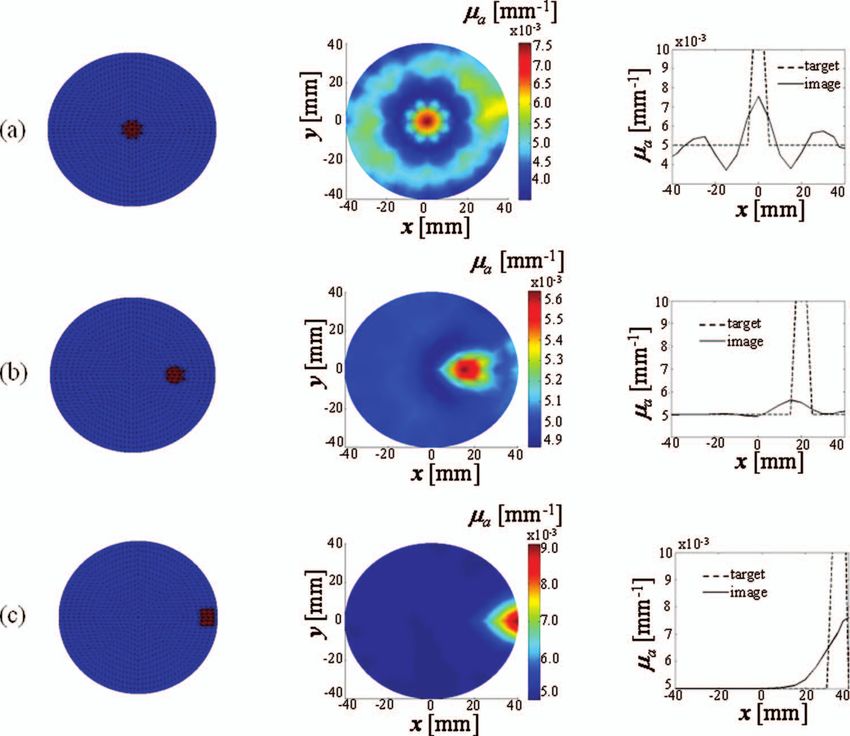
Journal of Biomedical Optics 16(11), 116022 (November 2011)

                Reduction of image artifacts induced by change
                in the optode coupling in time-resolved diffuse
                optical tomography
                Ryo Fukuzawa,a Shinpei Okawa,a Shoko Matsuhashi,a Takashi Kusaka,b Yukari Tanikawa,c
                Yoko Hoshi,d Feng Gao,e and Yukio Yamadaa
                a University of Electro-Communications, Department of Mechanical Engineering and Intelligent Systems, 1-5-1,
                Chofuga-oka, Chofu, Tokyo 182-8585, Japan
                b Kagawa University, Maternal Perinatal Center, 1750-1 Ikenobe, Miki, Kita-gun, Kagawa 761-0793, Japan
                c National Institute of Advanced Industrial Science and Technology, 1-2 Namiki, Tsukuba, Ibaraki 305-8564, Japan
                d Tokyo Metropolitan Institute of Medical Science, Integrated Neuroscience Research Project, 2-1-6 Kami-kitazawa,
                Setagaya, Tokyo 156-8506, Japan
                e Tianjin University, College of Precision Instrument and Optoelectronics, Tianjin 3000072, China

                               Abstract. Tomographic images of the optical properties can be reconstructed using inversion algorithms for diffuse
                               optical tomography (DOT); however, changes in the optode coupling that occurs while obtaining an object’s
                               measurements may often lead to the presence of artifacts in the reconstructed images. To reduce the number
                               of artifacts induced by optode coupling, previous studies have introduced (unknown) coupling coefficients in
                               reconstruction algorithms, which were found to be effective for continuous wave- and frequency-domain DOT.
                               This study aims to investigate the effects of optode calibration on the reconstructed images of time-domain
                               DOT. Here, coupling coefficients are incorporated into the time-domain DOT algorithm based on a modified
                               generalized pulse spectrum technique. The images of the absorption coefficient are reconstructed in various
                               numerical simulations, phantom experiments, and in vivo experiments of time-domain DOT. As a result, the
                               artifacts resulting from changes in optode coupling are reduced in the reconstructed images of the absorp-
                               tion coefficient, thereby demonstrating that introduction of coupling coefficients is effective in time-domain
                               DOT. Moreover, numerical simulations, phantom experiments, and in vivo studies have validated this algorithm.

                               C 2011   Society of Photo-Optical Instrumentation Engineers (SPIE). [DOI: 10.1117/1.3653236]

                               Keywords: medical imaging; tomography; inverse problems.
                               Paper 11314R received Jun. 23, 2011; revised manuscript received Sep. 24, 2011; accepted for publication Sep. 28, 2011; published
                               online Nov. 3, 2011.

                1 Introduction                                                                        fant’s brain, which should be carefully monitored to prevent
                Recent developments in optical technologies have made it pos-                         hypoxic-ischemic brain damage.4–7
                sible to provide tomographic images of oxygenated states of                               However, DOT images often suffer from artifacts, which are
                the human brain by applying near-infrared (NIR) spectroscopy,                         unreasonable from a physical or physiological point of view.
                known as diffuse optical tomography (DOT).1, 2 In DOT, image                          The artifacts are caused by a number of issues, one of which is
                reconstruction is based on the modeling of light propagation                          due to the change in coupling between the optode (composed
                in an object, known as the photon diffusion equation (PDE).                           of optical fibers) and the object’s surface during the measuring
                PDE describes the relationship between the optical properties in                      period. The change in coupling may easily be caused by un-
                the object and the light intensities measured at the object’s sur-                    desirable movements of the subject; for example, movements
                face. The measured light intensities are used to solve the inverse                    made by premature infants. Previous studies have reported that
                problem based on the PDE, and the solution is the reconstructed                       artifacts can be removed by optode calibration, which intro-
                image showing the distribution of the optical properties within                       duces “coupling coefficients” to represent the state of optode
                the object, such as the absorption coefficient.3                                      coupling.8–13
                   Because the absorption spectrum of oxy-hemoglobin is dif-                              Boas et al. first proposed optode calibration by incorporating
                ferent from that of deoxy-hemoglobin, the reconstructed im-                           coupling coefficients into the algorithm for cw (continuous-
                ages of the absorption coefficient at multiple wavelengths can                        wave)-domain DOT.8 By taking the logarithm of measured flu-
                be converted into images of the concentrations of oxy- and                            ence rates as input data, coupling coefficients were linearly re-
                deoxy-hemoglobins. Consequently, DOT images provide hemo-                             lated to the measured cw data, and by employing the Rytov
                dynamic information. A promising application of DOT may be                            approximation, the reconstruction process was made into a lin-
                bedside monitoring of the oxygenated states of a premature in-                        ear inverse problem.
                                                                                                          Schweiger et al. also incorporated coupling coefficients into
                                                                                                      the frequency-domain DOT algorithm, where the amplitude and
                Address all correspondence to: Shinpei Okawa, The University of Electro-              phase of the detected light were calibrated.9 They solved a
                Communications, Department of Mechanical Engineering and Intelligent, Sys-
                tems, 1-5-1 Chofugaoka, Chofu, Tokyo 182-8585 Japan; Tel: 81-42-443-5417;
                Fax: 81-42-443-5417; E-mail: okawa@mce.uec.ac.jp.                                     1083-3668/2011/16(11)/116022/10/$25.00
                                                                                                                                             C 2011 SPIE

                Journal of Biomedical Optics                                                 116022-1                                       November 2011 r Vol. 16(11)

Downloaded From: https://www.spiedigitallibrary.org/journals/Journal-of-Biomedical-Optics on 01 Feb 2022
Terms of Use: https://www.spiedigitallibrary.org/terms-of-use
Fukuzawa et al.: Reduction of image artifacts induced by change in the optode coupling...

                 nonlinear inverse problem involving the coupling coefficients                      where δ is the delta function. Also, Eq. (1) is subject to the
                 and demonstrated the reduction of artifacts by showing DOT                         following boundary condition [Eq. (3)], which expresses that
                 images for two-dimensional (2D)-simulation and phantom ex-                         no light flux is incoming from the boundary, rb , except the
                 periments.                                                                         illuminating position,
                     Schmitz et al. developed a CCD-camera and silicon-
                                                                                                                                              1
                 photodiode–based system and adopted a method for optode                                         D(r b )∇n φ(r b , t) = −            φ(r b , t),    (3)
                 calibration with coupling coefficients.10 Oh et al. formulated                                                             2A(r b )
                 the DOT reconstruction algorithm with optode calibration un-                       where ∇ n represents the gradient normal to the surface and
                 der the Bayesian framework.11 Stott et al. proposed a method                       A(rb ) = [1 + rd (rb )]/[1- rd (rb )] is the parameter depending on
                 to calibrate the amplitudes of the measured intensities and op-                    the internal reflection ratio, rd , given as rd = − 1.440nr− 2
                 tode positions.12 Tarvainen et al. succeeded in performing image                   + 0.710nr− 1 + 0.668 + 0.0636nr , with nr as the refractive
                 reconstruction with optode calibration under a rotational sym-                     index ratio between the medium and its surroundings.17
                 metry of optode positions in frequency-domain DOT. Phantom                            Light intensities measured at the boundary, (rb , t), are the
                 experiments also validated their method.13                                         fluxes of the fluence rate outgoing from the boundary (Fick’s
                     Various methods of optode calibration were studied for cw-                     law) and are given by the following:
                 and frequency-domain DOT; however, no study has been per-
                 formed on time-domain DOT. In this study, we introduce optode                                       (r b , t) = −D(r b )∇n φ(r b , t).            (4)
                 calibration to time-domain DOT. Changes in the amplitudes of
                 the time-resolved measurement data are assumed to take place                           The forward problem of Eq. (1) is solved numerically by the
                 because of the differences found in optode coupling between                        finite element method (FEM)18 under the initial and boundary
                 the measurements obtained for rest and task states. The non-                       conditions [Eqs. (2) and (3)], and the measured light intensities
                 linear algorithm for DOT image reconstruction employed in                          are obtained by Eq. (4).
                 this study is based on the modified generalized pulse spectrum
                 technique (mGPST),14, 15 which is one of the image reconstruc-
                 tion algorithms for time-domain DOT. Numerical simulations,                        2.2 Inverse Problem with Optode Calibration
                 phantom experiments, and in vivo experiments have validated
                                                                                                    2.2.1 Reconstruction using mGPST
                 the performance of the algorithm which incorporates coupling
                 coefficients. As a result, the artifacts induced by changes in                     The mGPST is employed to reconstruct the distribution of the
                 optode coupling are reduced in the reconstructed images of the                     optical properties in the medium based on the forward model-
                 absorption coefficient, showing that introduction of the coupling                  ing previously described above. The mGPST uses the Laplace
                 coefficients is effective in time-domain DOT and that this algo-                   transform to extract features of the measured time-resolved data.
                 rithm has been validated by numerical simulations, phantom                         The transformed “featured data,” which effectively summarizes
                 experiments, and in vivo experiments.                                              the measured time-resolved data, is used for successive image
                                                                                                    reconstruction.
                                                                                                        Fundamentally, the reconstruction algorithm minimizes the
                 2 Method of Image Reconstruction and Optode                                        residual errors defined as the norm of the difference between the
                    Calibration                                                                     vectors of the measured
                                                                                                                   ∞        and calculated featured∞data, ˜ m − ,
                                                                                                                                                                    ˜
                 2.1 Forward Model of Light Propagation                                             where ˜ m = 0  m exp(− pt)dt and ˜ = 0  exp(− pt)dt
                     in Biological issues                                                           with the constant p for the Laplace transform, and  m and  are
                                                                                                    the measured and calculated time-resolved data, respectively.
                 The radiative transfer equation (RTE) rigorously describes light
                                                                                                    The vectors ˜ m and ˜ have M components, corresponding to M
                 propagation in biological media. This integro-partial differential
                                                                                                    measurements for the combinations of source and detector po-
                 equation can be solved numerically by deterministic or stochas-
                                                                                                    sitions, and  is numerically calculated by the forward model
                 tic methods. However, solving RTE numerically may be com-
                                                                                                    with the given optical properties.
                 putationally too intensive to be applied to image reconstruction.
                                                                                                        We can expand the calculated featured data, ,  ˜ in a Taylor
                 Therefore, the PDE, which is an approximation of RTE and is
                                                                                                    series as follows:
                 valid for biological objects larger than about 1 cm, is usually
                 employed.1–3                                                                               (μ
                                                                                                            ˜ t + δμt ) = (μ
                                                                                                                          ˜ t ) + J(μt )δμt + · · · ,               (5)
                    1 ∂φ(r, t)
                                = ∇ · {D(r)∇φ(r, t)} − μa (r)φ(r, t) + q(r, t),                     where μ is the N × 1 vector representing the optical properties at
                    c ∂t
                                                                                    (1)             the discrete N positions in the medium and is to be reconstructed,
                 where c is the speed of light in the medium, φ(r, t) is the fluence                subscript t indicates the number of iterations, J is the Jacobian
                 rate at position r and time t, D(r) = 1/[3μs (r)] is the diffusion                matrix consisting of first-order partial derivatives of the featured
                 coefficient,16 μs (r) is the reduced scattering coefficient, μa (r) is            data with respect to μ, and δμ of the N ×1 vector is a small
                 the absorption coefficient, and q(r, t) is the light source in the                 change in μ. The terms higher than the first-order derivative in
                 medium.                                                                            Eq. (5) are neglected. Now, by assuming that (μ   ˜ t + δμt ) is
                     When the impulse light source illuminates the medium from                      equal to ˜ m , the updating process for true optical properties is
                 the surface at position rs , Eq. (1) is subject to the following                   expressed as follows. First, the following linear system equation
                 initial condition [Eq. (2)],                                                       for δμt is solved by the algebraic reconstruction technique,

                                        φ(r, t) = δ(r − r s )δ(t),                       (2)                            ˜ m − (μ
                                                                                                                               ˜ t ) = J(μt )δμt .                  (6)

                 Journal of Biomedical Optics                                              116022-2                                         November 2011 r Vol. 16(11)

Downloaded From: https://www.spiedigitallibrary.org/journals/Journal-of-Biomedical-Optics on 01 Feb 2022
Terms of Use: https://www.spiedigitallibrary.org/terms-of-use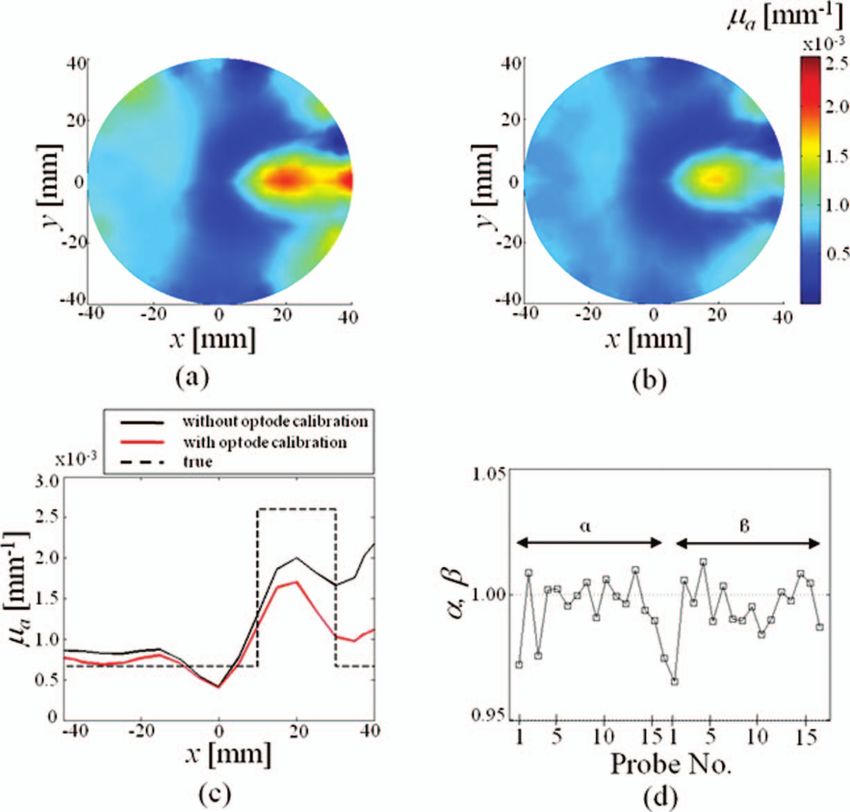
Fukuzawa et al.: Reduction of image artifacts induced by change in the optode coupling...

                Then, the optical properties are updated by the following:                         3 Validations of Optode Calibration by
                                                                                                      Numerical Simulations
                                           μt+1 = μt + δμt .                            (7)        3.1 Reconstruction without Optode Calibration
                                                                                                   Numerical simulations are carried out to validate the effective-
                The updating process is iterated until the residual error,
                                                                                                   ness of the optode calibration stated above. Numerical phan-
                ˜ m − ,
                        ˜ is minimized, and the image of μ is reconstructed.
                                                                                                   toms are 2D circular media with a radius of 40 mm, having

                                                                                                   the reduced scattering coefficient, μs,B    = 1.0 mm − 1 , and the
                                                                                                   absorption coefficient, μa,B = 0.005 mm − 1 , as the background
                2.2.2     Optode calibration employing coupling
                                                                                                   optical properties. The refractive index is given as 1.33. The
                          coefficients
                                                                                                   circular media at the rest state are homogeneous, and those at
                Actually, DOT reconstructs the change in the optical proper-                       the task state have targets of a strongly absorbing circular region
                ties between the task and rest states. Therefore, ˜ m consists of                 with a radius of 5 mm, μa,T = 0.01 mm − 1 (μa = μa,T – μa,B
                the ratios of the measured intensities at the task states to those                 = 0.005 mm − 1 ), and μs,T
                                                                                                                                 = 1.0 mm − 1 . μs is assumed not to
                at the rest states. If the optode coupling between the optodes and
                                                                                                   change (μs,T = μs,B) and only μa is reconstructed.
                the object’s surface at the time of the task measurement is dif-                       Sixteen optodes (Nos. 1 to 16) working as both the sources
                ferent from that of the rest measurement, then the change in the                   and detectors are placed at the medium surface with equal spac-
                optode coupling will appear as artifacts in the reconstructed im-                  ing. One of the optodes is selected as the source, and the re-
                ages. To reduce artifacts induced by a change in optode coupling,                  emitted light of the source is detected by the other optodes. The
                coupling coefficients are introduced into the reconstruction al-                   optodes are then sequentially selected as the source. Therefore, a
                gorithm. To calibrate the changes in the optode coupling, the cal-                 total of 16 ×15 time-resolved measurement data is numerically
                culated featured data are multiplied by coupling coefficients8, 9                  generated for one image.
                as, αi β j ˜ i j , where ˜ i j are the elements of the calculated featured           The simulated measurement data are generated by solving
                data obtained at the i’th source and j’th detector positions, and                  Eq. (1) in 2D with FEM, employing the meshing of 2048 el-
                α i and β j are the coupling coefficients to calibrate the change                  ements and 1089 nodes, whereas the FEM calculation for the
                in the optode coupling at the i’th source and the j’th detector                    image reconstruction employs the meshing of 816 elements and
                positions, respectively. Note that the featured data multiplied                    473 nodes, as shown in Fig. 1. The positions and numbering of
                by the coupling coefficients are equivalent to the time-resolved                   the optodes and the coordinates of x and y are also shown in
                data multiplied by the coupling coefficients because the Laplace                   Fig. 1.
                transform linearly transforms the time-resolved data. No change                        For the first step, reconstructions are performed for three
                in the optode coupling is represented by the coupling coefficients                 cases, (a), (b), and (c), without a change in the optode coupling
                of unity, and the losses of light due to the changes in the cou-                   to evaluate the performance of the mGPST algorithm in the
                pling result in the coupling coefficients becoming smaller than                    absence of optode calibration. The coordinates of the target
                unity.                                                                             centers of the strongly absorbing circle are (x, y) = (0, 0), (20,
                    Because it is impossible to know the values of the coupling                    0), and (35, 0) for cases (a), (b), and (c), respectively.
                coefficients in these experiments, they are unknowns that must                         The true images of μa at the task state, the reconstructed
                be reconstructed similarly to the optical properties. The cou-                     images, and the profiles of the reconstructed μa along the x-
                pling coefficients and the optical properties are simultaneously                   axis without a change in optode calibration are shown in Fig. 2.
                optimized to minimize the residual error by iteration. By intro-                   The reconstructed differences in μa (μa ) between the task and
                ducing the coupling coefficients to the measured data for task                     rest states are about 10% to 50% of the true values, depending
                state, the Jacobian matrix and the vectors of the optical proper-
                ties and their small changes appearing in Eq. (5) are modified
                as follows:

                                        J = [J(μ), J(α), J(β)],                         (8)

                                       δμ = [δμT , δα T , δβ T ]T ,                     (9)

                                          μ = [μT , α T , β T ]T ,                     (10)

                where α and β are the vectors consisting of the coupling co-
                efficients α i and β j , respectively, J(μ), J(α), and J(β) are the
                Jacobian matrices obtained as the first derivatives of the featured
                data with respect to μ, α , and β, respectively, and δα and δβ are
                the vectors representing the small changes in α and β, respec-
                tively. The image reconstruction is conducted with the modified
                variables expressed by Eqs. (9) and (10). The vectors μ, α , and                   Fig. 1 A 2D circular medium with a radius of 40 mm, FEM meshing
                β are the unknowns to be reconstructed.                                            for the image reconstruction, and the optode positions.

                Journal of Biomedical Optics                                              116022-3                                      November 2011 r Vol. 16(11)

Downloaded From: https://www.spiedigitallibrary.org/journals/Journal-of-Biomedical-Optics on 01 Feb 2022
Terms of Use: https://www.spiedigitallibrary.org/terms-of-use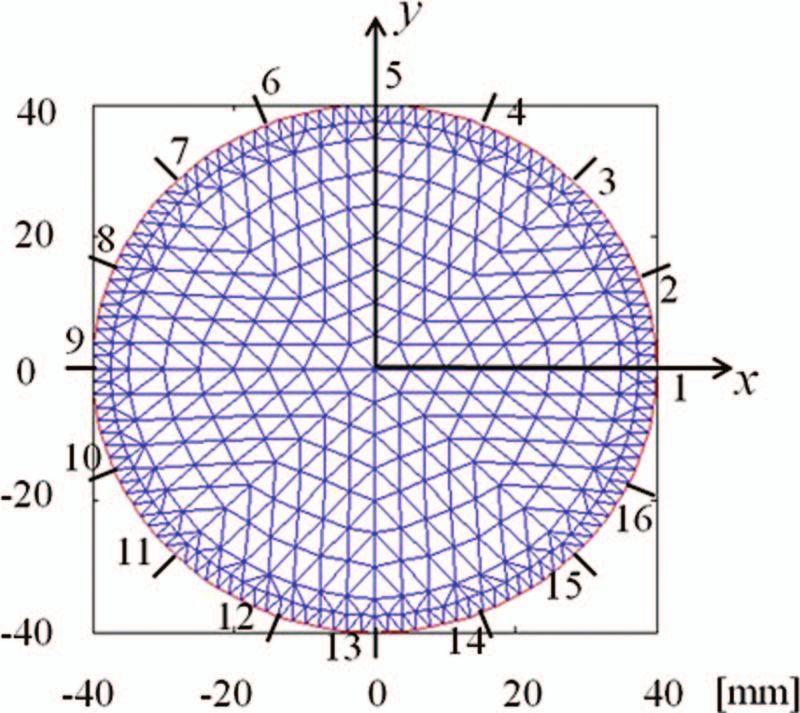
Fukuzawa et al.: Reduction of image artifacts induced by change in the optode coupling...

                 Fig. 2 The true images of μa (left column), the reconstructed images (center column), and the reconstructed μa along the x-axis (right column), for
                 cases (a), (b), and (c) without the change in the optode coupling.

                 on the cases. It is generally known that in DOT images, the                        ibration, the true and reconstructed μa distributions along the
                 reconstructed changes in μa are generally smaller than their                       x-axis, and the reconstructed α and β. In case (a), when the op-
                 true values,11 whereas the true positions of the target are well                   tode calibration is not incorporated, the artifact in μa is approxi-
                 recovered (Fig. 2). The reconstructed image for case (a) has                       mately 0.007 mm − 1 and appears in the vicinity of the boundary
                 an oscillating distribution, which typically appears in inverse                    of the circular medium as shown in Fig. 3(a-1). This artifact is
                 problems. We found that the mGPST can reconstruct μa well in                       stronger than the target image at the center of the medium and is
                 these cases without a change in optode coupling.                                   caused by a decrease in the measured intensities, which can be
                                                                                                    interpreted as an increase in the absorption coefficient by the re-
                                                                                                    construction algorithm in the absence of optode calibration. On
                 3.2 Reconstruction with Optode Calibration                                         the other hand, the image reconstructed with optode calibration
                 Image reconstructions of μa with the incorporation of optode                       shows no artifact, as seen in Fig. 3(a-2). In Fig. 3(a-3), where
                 calibration were performed. The numerical phantoms are iden-                       reconstructed distributions are represented along the x-axis with
                 tical to those of cases (a), (b) and (c) described above.                          and without optode calibration, it was found that regardless of
                     Changes in optode coupling are assumed to take place at                        the incorporation of optode calibration, the reconstructed differ-
                 optode No. 1 located at (x, y) = (40, 0), when the measurements                    ence in μa (μa ) at the target is approximately 0.0013 mm − 1 ,
                 are performed for the task state. Because of the change in optode                  which is about one-fourth of the true μa of 0.005 mm − 1 .
                 coupling, the measured light intensities are assumed to change                         The coupling coefficients were simultaneously estimated in
                 as follows:                                                                        the reconstruction process, as plotted in Fig. 3(a-4). The cou-
                     For case (a): When optode No. 1 is the source, the intensities                 pling coefficients α 1 and β 1 for optode No. 1 are reconstructed
                 measured by all other detectors decrease by 10%. When optodes                      as approximately 0.90. These values were almost identical to the
                 other than No. 1 are the source, the intensity measured by optode                  10% decrease observed in the source and measured intensities
                 No. 1 decreases by 10%, and the intensities measured by all the                    of optode No. 1 provided in the data generation. All other cou-
                 other optodes are not affected.                                                    pling coefficients were found to be approximately 1.01, which
                     For cases (b) and (c): Similar to case (a), with the exception                 suggests that the optode coupling did not change. The optode
                 that the decreases in the measured intensities are 3%.                             calibration is shown to function well to recover the decrease in
                     The results of the reconstructions are shown in Figs. 3, 4,                    the source and measured intensities.
                 and 5, for cases (a), (b), and (c), respectively. Each figure pro-                     For cases (b) and (c), reconstruction without optode calibra-
                 vides the reconstructed μa images with and without optode cal-                     tion shows a decrease in the source and measured intensities as

                 Journal of Biomedical Optics                                              116022-4                                      November 2011 r Vol. 16(11)

Downloaded From: https://www.spiedigitallibrary.org/journals/Journal-of-Biomedical-Optics on 01 Feb 2022
Terms of Use: https://www.spiedigitallibrary.org/terms-of-use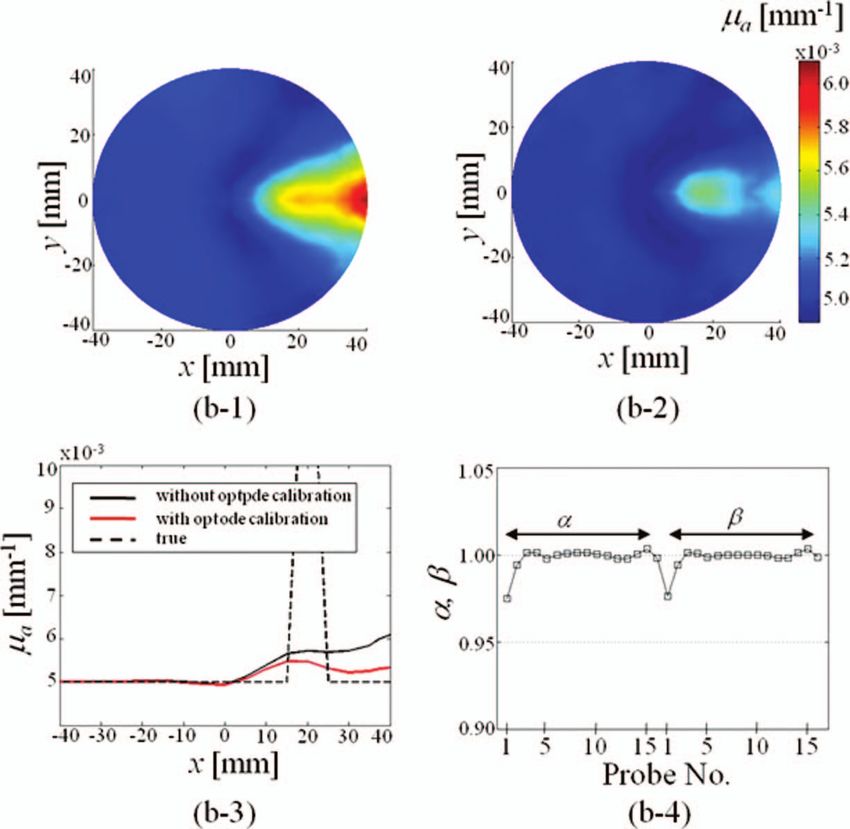
Fukuzawa et al.: Reduction of image artifacts induced by change in the optode coupling...

                Fig. 3 The results of the image reconstructions accompanied by changes in optode coupling for case (a). (a-1) The reconstructed μa without the
                calibrations, (a-2) the reconstructed μa with the calibration, (a-3) the reconstructed μa along the x-axis with and without the calibration, and (a-4)
                the reconstructed coupling coefficients.

                Fig. 4 The results of the image reconstructions for case (b). (b-1) The reconstructed μa without the calibrations, (b-2) the reconstructed μa with the
                calibration, (b-3) the reconstructed μa along the x-axis with and without the calibration, and (b-4) the reconstructed coupling coefficients.

                Journal of Biomedical Optics                                              116022-5                                    November 2011 r Vol. 16(11)

Downloaded From: https://www.spiedigitallibrary.org/journals/Journal-of-Biomedical-Optics on 01 Feb 2022
Terms of Use: https://www.spiedigitallibrary.org/terms-of-use
Fukuzawa et al.: Reduction of image artifacts induced by change in the optode coupling...

                 Fig. 5 The results of the image reconstructions for case (c). (c-1) The reconstructed μa without the calibrations, (c-2) the reconstructed μa with the
                 calibration, (c-3) the reconstructed μa along the x-axis with and without the calibration, and (c-4) the reconstructed coupling coefficients.

                 reflected by the changes seen in μa , which appear as artifacts                    3.3 Validation of Optode Calibration by Phantom
                 as shown in Figs. 4(b-1) and 5(c-1), respectively. The optode                          Experiments
                 calibration removes artifacts as shown in Figs. 4(b-2) and 5                       Phantom experiments using a time-resolved measurement sys-
                 (c-2). Similar to case (a), we observed comparable changes in                      tem were conducted to validate optode calibration. The time-
                 the reconstructed μa distributions along the x-axis with optode                    resolved measurement system consisted of 16 optodes composed
                 calibration, as shown in Figs. 4(b-3) and 5(c-3).                                  of fiber bundles, ultra-short pulse lasers and time-correlated sin-
                     The estimated coupling coefficients are also plotted in                        gle photon counting units. Each optode worked as both the
                 Figs. 4(b-4) and 5(c-4). Because the observed decreases in the                     source and the detector. The ultrashort pulse lasers generated
                 source and measured intensities in cases (b) and (c) were 3%,                      light pulses having wavelengths of 759 and 834 nm, dura-
                 which is smaller than the 10% observed in case (a), the cou-                       tion of approximately 100 ps, a mean power of 0.25 mW,
                 pling coefficients reconstructed in cases (b) and (c) are closer to                and a repetition rate of 5 MHz. The light pulses illuminated
                 unity. In case (b), α 1 and β 1 for optode No. 1 are 0.975, which                  the measured object through one of the optodes while all
                 is very close to 0.970, reflecting the 3% decrease in the source                   of the optodes collected light that was re-emitted from the
                 and measured intensities of optode No. 1. α i and β j for optodes                  object. It took approximately 120 s to acquire data for one
                 other than No. 1 are very close to 1.00. In case (c), however,                     DOT image. The details of the system may be found in the
                 α 1 and β 1 were 0.921, which overestimates the 3% decreases                       literature.19
                 in the source and measured intensities of optode No. 1, whereas                        The measured object, the phantom, was a cylinder made
                 α i and β j for optodes other than No. 1 were very close to 1.00.                  of polyacetal resin covered by a silicon rubber, as shown in
                 In case (c), it is difficult for the algorithm to discriminate be-                 Fig. 6. Covering the solid resin with the soft rubber simulated
                 tween the artifact and the target, which coincidently appears in                   deformable human skin. We have confirmed by preliminary ex-
                 the same position. In this case, the reconstructed maximum μa                      periments that the soft surface causes the change in the coupling
                 values of the target with and without optode calibration were                      between the optode and the measured object more significantly
                 6.77 × 10 − 3 and 8.24 × 10 − 3 mm − 1 , respectively, as shown                    than the hard surface.20 The phantom was also covered by a
                 in Fig. 5(c-3), whereas that without the change in optode cou-                     spongy black rubber with a thickness of about 10 mm to prevent
                 pling is 7.60 × 10 − 3 mm − 1 , as shown in Fig. 2. The artifact                   stray light from being detected. The optodes were in contact
                 is overestimated, and the coupling coefficients, α 1 and β 1 , be-                 with the phantom surface through holes in the spongy black
                 come smaller compared to those observed in case (b). A similar                     rubber. These holes had a diameter slightly larger than those of
                 result has been shown by Schweiger et al.9 When the target is                      the optodes.
                 within the vicinity of the surface, calibration should be used                         The polyacetal cylinder had a radius of 35 mm and the optical
                 with caution.                                                                      properties of μa = 0.00066 mm − 1 and μs = 0.863 mm − 1 . The

                 Journal of Biomedical Optics                                              116022-6                                      November 2011 r Vol. 16(11)

Downloaded From: https://www.spiedigitallibrary.org/journals/Journal-of-Biomedical-Optics on 01 Feb 2022
Terms of Use: https://www.spiedigitallibrary.org/terms-of-use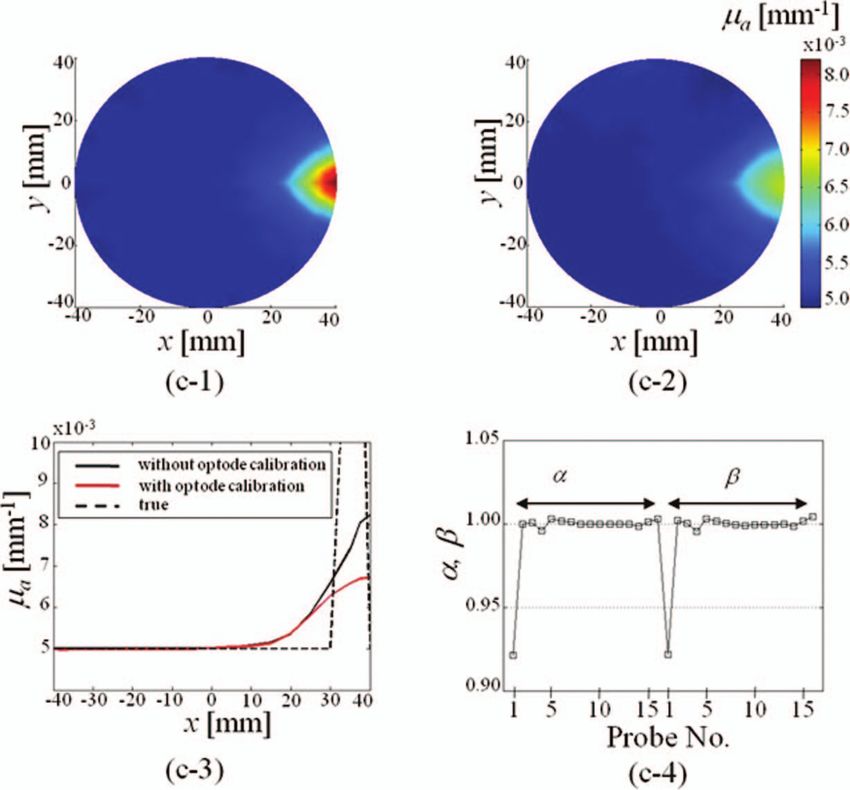
Fukuzawa et al.: Reduction of image artifacts induced by change in the optode coupling...

                                                                                                   At the same time, optode No. 1 was moved 2 mm away from
                                                                                                   the phantom surface to induce changes in the optode coupling
                                                                                                   at the task state.
                                                                                                       The measured time-resolved data for two states of the phan-
                                                                                                   tom were transformed into featured data, and their ratios were
                                                                                                   used as input data for image reconstruction of the change in
                                                                                                   μa . The distributions of μs were known and not reconstructed
                                                                                                   for simplicity. The reconstructions were conducted with and
                                                                                                   without optode calibration.
                                                                                                       The results of the reconstructions are shown in Fig. 7. The
                                                                                                   reconstruction without optode calibration results in an image
                                                                                                   with a strong artifact near the moved optode No. 1, as shown in
                                                                                                   Fig. 7(a). Weak and unexpected artifacts were also observed at
                                                                                                   other positions. On the other hand, image reconstruction with
                                                                                                   optode calibration successfully removed most of the artifacts.
                                                                                                   The target was clearly reconstructed with μa at approximately
                                                                                                   50% of the true value. The plot of μa along the x-axis shown in
                         Fig. 6 The size and optical properties of the phantom.                    Fig. 7(c) indicates that the artifact is reduced by approximately
                                                                                                   70% of the reconstructed image without optode calibration.
                                                                                                   Figure 7(d) shows the reconstructed values of α and β and
                silicone rubber covering the cylinder had a thickness of 5 mm,                     the values of α 1 and β 1 for optode No. 1, which largely deviate
                μa = 0.092 mm − 1 , and μs = 0.64 mm − 1 .                                        from unity to compensate for the change in optode coupling. The
                    The time-resolved measurements were made at the rest state                     values of α for optode No. 3 and No. 16 also deviate from unity
                having homogeneous optical properties of the background, and                       and are close to α 1 for optode No. 1, which may be due to the in-
                at the task state, having a target of a small cylinder with μa                     terference between optode No. 1 and the optodes close to No. 1.
                higher than the background. At the rest state measurement, all                     However, the reason for the deviations of α 3 and α 16 from unity
                the optodes were attached to the phantom surface. After the                        is not clear because α 2 for optode No. 2 is not affected. Some
                measurement of the rest state, the cylindrical region with a radius                of the reconstructed coupling coefficients are larger than unity;
                of 10 mm and a center at (x, y) = (20, 0) in the phantom was                       this may indicate that the changes in the coupling increased the
                replaced by an Intralipid solution with μa = 0.0026 mm − 1 and                     measured light intensities for some unknown reasons. One pos-
                μs = 1.05 mm − 1 for a regional change in μa at the task state.                   sible explanation of the coupling coefficients being larger than

                Fig. 7 The results of the image reconstruction in the phantom experiment. (a) Image reconstruction without optode calibration, (b) image recon-
                struction with optode calibration, (c) the reconstructed μa along the x-axis, and (d) the reconstructed coupling coefficients.

                Journal of Biomedical Optics                                              116022-7                                     November 2011 r Vol. 16(11)

Downloaded From: https://www.spiedigitallibrary.org/journals/Journal-of-Biomedical-Optics on 01 Feb 2022
Terms of Use: https://www.spiedigitallibrary.org/terms-of-use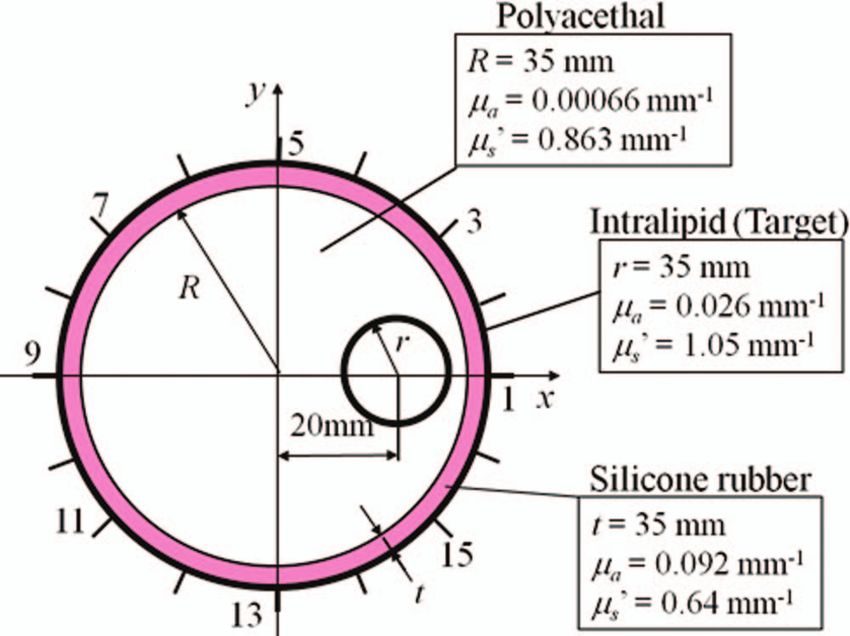
Fukuzawa et al.: Reduction of image artifacts induced by change in the optode coupling...
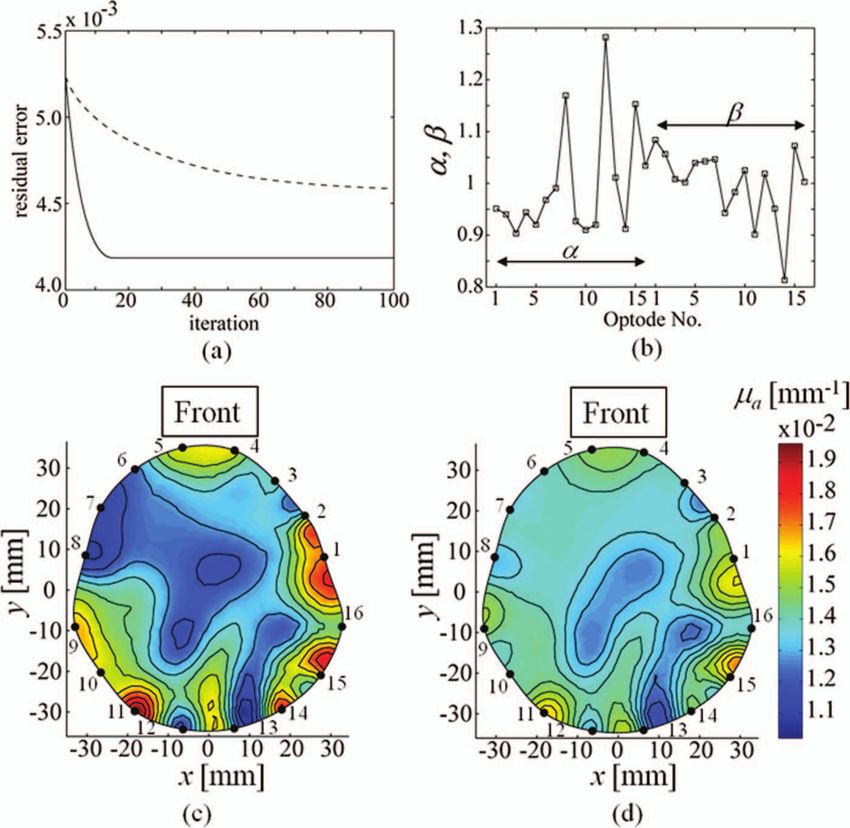
Fig. 8 The results of the reconstructions of μa images from the in vivo measurement data. (a) The residual errors as a function of the number of
iterations in the reconstructions with (solid line) and without (dashed line) optode calibration, (b) the reconstructed coupling coefficients, (c) and (d)
the μa [mm − 1 ] images reconstructed without and with optode calibration, respectively, with the optode positions shown by the black dots.
unity may be that light was reflected at the interface between and a maximum inspiratory pressure of 1.6 kPa above the atmo-
the polyacethal resin and the silicon rubber. In the light prop- spheric pressure, and condition II: hypocapnic condition with a
agation model, the reflection of light at the interface was not low arterial partial pressure of CO2 (PaCO2 ) and a respiratory
incorporated. rate of 40 breaths/min. The maximum inspiratory pressure was
the same as that of condition I. We anticipated that this hypocap-
4 Calibrated DOT Image of the Absorption nic condition would induce a slightly lowered blood volume in
Coefficient from In Vivo Measurement Data the brain, leading to a slight decease in μa in the brain. The mea-
To further study the effectiveness of the optode calibration, the surement under condition II was conducted about 10 min after
method stated above was applied to in vivo measurement data the measurement under condition I. Written informed consent
to reconstruct the image of μa . The in vivo measurement data was obtained from the parents of the infant. This experiment
was provided from in vivo experiments of time-domain DOT was conducted upon the approval of the Kagawa University
performed on the head of a premature infant at 29 days after Ethics Committee, the National Institute of Advanced Industrial
birth. The gestational age of the infant was 27 weeks, and his Science & Technology (AIST) Ethical Committee on Medical
birth weight was 658 g. Engineering Experiments and the AIST Tsukuba Center East
The time-resolved measurement system was used again, and Office Human Engineering Experiment Committee.
16 optodes were attached to the surface of the head by the use Two-dimensional images of μa at a wavelength of 760 nm
of a circular optode holder. The circumference length of the were reconstructed with and without optode calibration. The
subject head was 23.3 cm at the measurement plane. The con- ratios of the featured data obtained at condition II to those ob-
tacts of the optodes to the surface of the skin were controlled tained at condition I were used for the reconstructions as well
by springs to keep the contact pressure constant during mea- as the phantom experiments described in Sec. 3.3. The initial
surement. However, because the subject was not anesthetized, guess of μa was given as 0.0142 mm − 1 uniformly in the head.
there was the possibility that the optode coupling had changed The reduced scattering coefficient μs was fixed as 0.6 mm − 1 .
because of the subtle movement of the subject. An artificial The initial guess of μa and fixed value of μs were provided by
respirator assisted the subject’s respiration. The measurement previous studies described in the literature.21
data was acquired for the following two conditions: condition I: Figure 8(a) shows the residual errors ||˜ m − ˜ (μt )|| as a
normocapnic condition with a respiratory rate of 25 breaths/min function of the number of iterations. In the reconstruction with
Journal of Biomedical Optics 116022-8 November 2011 r Vol. 16(11)
Downloaded From: https://www.spiedigitallibrary.org/journals/Journal-of-Biomedical-Optics on 01 Feb 2022
Terms of Use: https://www.spiedigitallibrary.org/terms-of-useFukuzawa et al.: Reduction of image artifacts induced by change in the optode coupling...
optode calibration, the residual error converged faster and be- The optimization of the coupling coefficients is conducted si-
came smaller compared to the reconstruction without optode multaneously with the image reconstruction. A possible disad-
calibration. The reconstructed coupling coefficients are plotted vantage of adding unknowns is that it can aggravate the ill-posed
in Fig. 8(b). The reconstructed μa images are shown in Figs. 8(c) nature of the inverse problem. However, the number of the cou-
and 8(d) without and with optode calibration, respectively. The pling coefficients, which total 32 in this study, is much smaller
dots along the boundary indicate the optode positions. When than the number of the reconstructed absorption coefficients in
comparing the reconstructed μa images with and without optode the object, which is the same as the number of FEM nodes
calibration, it is clearly apparent that the artifacts that appear (473). Thus, the influence of adding coupling coefficients to the
within the vicinity of the boundary were remarkably reduced performance of the algorithm seems insignificant.
by optode calibration. In particular, there were very small val- Another idea to reduce artifacts by changes in the optode
ues of μa found in the left frontal lobe and larger values of μa coupling is to not use the optode measurement data, which re-
observed in the left occipital lobe in the image reconstructed veals changes in the optode coupling. However, it is difficult
without optode calibration. These artifacts were reduced by op- to determine which optodes are associated with the changes in
tode calibration, and as a result, the decrease in μa from the coupling. By using the coupling coefficient, one can fully utilize
assumed initial value of 0.0142 mm − 1 was clearly seen in the important information that is included in the measured data.
center of the head, as anticipated by lowering the PaCO2 in Now we can discuss what happens when more than one
condition II. Thus, the optode calibration functioned effectively optode suffers from changes in coupling. During in vivo exper-
from the perspective of the μa images. Further studies will be iments, multiple optodes suffer from changes in coupling, and
needed to show the effectiveness of optode calibration. This may as a result, multiple artifacts appear in the image without op-
be done by physiologically checking the reconstructed images tode calibration, as shown in Fig. 8(c). These artifacts appear
of the blood volume and oxygenation states, as these images are separately within the vicinities of the optodes in principle, but if
obtained from the μa images at two wavelengths. two optodes with poor coupling existed next to each other, the
two artifacts close to the two optodes may be combined into one
large artifact. In addition, the artifacts are reduced by optode
5 Discussion calibration to some extent, as shown in Fig. 8(d), and the val-
Optode calibration has previously been demonstrated to be ef- ues of α and β are randomly distributed, as shown in Fig. 8(b).
fective in eliminating artifacts caused by a change in optode cou- Therefore, artifacts that are caused by changes in optode cou-
pling in cw- and frequency-domain DOT. This study has applied pling, which appear separately or combined within the vicinities
optode calibration to time-resolved DOT using the modified of the optodes and multiple artifacts, are dramatically reduced
GPST algorithm. Numerical simulations, phantom experiments, by the method of optode calibration.
and in vivo experiments have validated its effectiveness. The Because the propagation probability of light in a medium be-
changes in optode coupling that occur during measurements of- tween two optodes is highest at the positions close to the surface
ten cause artifacts in the reconstructed images appearing within around the optode, as shown by the well-known banana shape,
the vicinities of the optodes, as shown in Figs. 2–5. This may be the measurement sensitivity of absorbing targets is greatest close
explained by the following: when an optode initially is attached to the surface around the optodes. Therefore, optode calibration
correctly to the object surface at the time of rest measurement may also be acting as a method to correct the measured data
and if the optode is separated slightly from the object’s surface at for the effects of uneven sensitivity in the medium. The recon-
the time of task state measurement, light intensities (amplitudes) structed image without optode calibration is accompanied by
measured at the task state are recorded smaller than those when wavy artifacts that have 8 periods in an angular direction with 16
the optode is kept attached correctly to the object’s surface. optodes [Fig. 2(a)]. These artifacts, seen in Fig. 2(a), disappear in
The algorithm used may misunderstand that the attenuated Fig. 3(a-2), where the image has been reconstructed with optode
light intensities are attributed to strong absorbers close to the calibration. Therefore, we hypothesized that optode calibration
optodes. As a result, artifacts with large absorption coefficients may correct for uneven sensitivity in the medium. However, it
appear within the vicinities of the optodes. Conversely, when is doubtful that the depth-dependent sensitivity is corrected by
there are initially small gaps between the optodes and the simple multiplication of α and β to the time-resolved measure-
object’s surface at the time of rest state measurement and if the ment data. Thus, the coupling coefficients α and β are assumed
optodes are then attached correctly to the object’s surface at the to be constant and have no role in modifying the time-resolved
time of task state measurement because of the movement made profiles, in which the early and late photons propagate in the
by the object, light intensities measured at the task state will shallow and deep layers in the medium, respectively. Also, the
be recorded larger than those when the small gaps are kept even inversion process often produces wavy images in nature. There-
at the time of task state measurement. In these cases, artifacts fore, the wavy artifacts in Fig. 2(a) may coincidently have 8
with small absorption coefficients appear within the vicinities periods, which is half the number of optodes. The possibility of
of the optodes. Both cases may take place simultaneously, correcting for the uneven sensitivity in the medium should be
particularly during in vivo experiments in which the subjects further investigated in the future.
can easily move. The coupling coefficients α and β can correct
for changes in optode coupling for both cases, as stated above.
To reduce the artifacts incurred by changes in optode cou- 6 Conclusions
pling, the featured data are multiplied by the coupling coeffi- Optode calibration eliminates artifacts by a change in optode
cients to compensate for the light intensities and are incorporated coupling that is applied to the time-resolved DOT algorithm
as additional unknowns in the image reconstruction algorithm. based on the modified GPST, and its effectiveness is validated by
Journal of Biomedical Optics 116022-9 November 2011 r Vol. 16(11)
Downloaded From: https://www.spiedigitallibrary.org/journals/Journal-of-Biomedical-Optics on 01 Feb 2022
Terms of Use: https://www.spiedigitallibrary.org/terms-of-useFukuzawa et al.: Reduction of image artifacts induced by change in the optode coupling...
numerical simulation, phantom experiments, and in vivo exper- 6. J. Meek, “Basic principles of optical imaging and application to the
iments. Some numerical simulations of the time-domain DOT study of infant development,” Dev. Sci. 5(3), 371–380 (2002).
7. A. P. Gibson, T. Austin, N. L. Everdell, M. Schweiger, S. R. Arridge, J.
with optode calibration have shown that artifacts can be effec-
H. Meek, J. S. Wyatt, D. T. Delpy, and J. C. Hebden, “Three-dimensional
tively reduced and that the targets represented by a change in whole-head optical tomography of passive motor evoked responses in
the absorption coefficient are localized at the correct positions. the neonate,” Neuroimage 30, 521–528 (2006).
Experiments of time-domain DOT using the phantoms with a 8. D. A. Boas, T. Gaudette, and S. R. Arridge, “Simultaneous imaging and
soft surface have also validated the performance of the recon- optode calibration with diffuse optical tomography,” Opt. Express 8(5),
263–270 (2001).
struction using optode calibration incorporated into the modified
9. M. Schweiger, I. Nissila, D. A. Boas, and S. R. Arridge, “Image re-
GPST algorithm. The reconstructed coupling coefficients of the construction in optical tomography in the presence of coupling errors,”
optode are subject to a change in the optode coupling between Appl. Opt. 46(14), 2742–2756 (2007).
the rest and task states, which accurately reflects the change in 10. C. H. Schmitz, H. L. Graber, H. Luo, I. Arif, J. Hira, Y. Pei, A. Bluestone,
optode coupling, for example, decreases in the source and mea- S. Zhong, R. Andronica, I. Soller, N. Ramirez, S.-L. S. Barbour, and
R. L. Barbour, “Instrumentation and calibration protocol for imaging
sured light intensities between the rest and task states. However, dynamic features in dense-scattering media by optical tomography,”
when the target in the object is located close to the object’s sur- Appl. Opt. 39(34), 6466–6486 (2000).
face, we found that optode calibration overestimates the change 11. S. Oh, A. B. Milstein, R. P. Millane, C. A. Bouman, and K. J.
in optode coupling and should be used with caution. In vivo Webb, “Source-detector calibration in three-dimensional Bayesian op-
experiments with optode calibration performed on the head of a tical diffusion tomography,” J. Opt. Soc. Am. A 19(10), 1983–1993
(2002).
premature infant functioned effectively to reduce the number of 12. J. J. Stott, J. P. Culver, S. R. Arridge, and D. A. Boas, “Optode positional
artifacts in the μa image. However, further studies are needed calibration in diffuse optical tomography,” Appl. Opt. 42(16), 3154–
to show the effectiveness of optode calibration by checking the 3162 (2003).
reconstructed images of blood volume and oxygenation states 13. T. Tarvainen, V. Kolehmainen, M. Vauhkonen, A. Vanne, A. P. Gibson,
M. Schweiger, S. R. Arridge, and J. P. Kaipio, “Computational cali-
from the physiological point of view. It should also be noted
bration method for optical tomography,” Appl. Opt. 44(10), 1879–1888
that this algorithm has been validated by numerical simulations, (2005).
phantom experiments, and in vivo experiments. 14. F. Gao, H. Zhao, Y. Tanikawa, and Y. Yamada, “Time-resolved
diffuse optical tomography using a modified generalized pulse
Acknowledgments spectrum technique,” IEICE Trans. Inf. Syst. E85-D(1), 133–142
(2002).
This work was partly supported by JSPS KAKENHI [Grant-in- 15. H. Zhao, F. Gao, Y. Tanikawa, and Y. Yamada, “Time-resolved diffuse
Aid for Scientific Research (B)], (No. 17360095) “Investigation optical tomography and its application to in vitro and in vivo imaging,”
of oxygen transportation in biological tissues by reflection-type J. Biomed. Opt. 12(6), 062107 (2007).
16. K. Furutsu and Y. Yamada, “Diffusion approximation for a dissipative
diffuse optical tomography” (2005 to 2006) and (No. 17390307) random medium and the applications,” Phys. Rev. E 50(5), 3634–3640
“Study of blood volume and oxygenation in brains of newborn (1994).
infants using NIR tomographic imaging” (2005 to 2006). 17. R. A. J. Groenhuis, H. A. Ferwerda, and J. J. Ten Bosch, “Scattering
and absorption of turbid materials determined from reflection measure-
ments. 1: Theory,” Appl. Opt. 22(16), 2456–2462 (1983).
References 18. M. Schweiger, S. R. Arridge, and D. T. Delpy, “Application
1. A. P. Gibson, H. C. Hebden, and S. R. Arridge, “Recent advances in of the finite-element method for the forward and inverse mod-
diffuse optical imaging,” Phys. Med. Biol. 50, R1–R43 (2005). els in optical tomography,” J. Math. Imaging Vision 3, 263–283
2. D. A. Boas, D. H. Brooks, E. L. Miller, C. A. DiMarzio, M. (1993).
Kilmer, R. J. Gaudette, and Q. Zhang, “Imaging the body with dif- 19. H. Eda, I. Oda, Y. Ito, Y. Wada, Y. Oikawa, Y. Tsunazawa, Y. Tuchiya,
fuse optical tomography,” IEEE Signal Process Mag. 18(6), 57–75 Y. Yamashita, M. Oda, A. Sassaroli, Y. Yamada, and M. Tamura, “Mul-
(2001). tichannel time-resolved optical tomographic imaging system,” Rev. Sci.
3. S. R. Arridge, “Optical tomography in medical imaging,” Inverse Prob- Instrum. 70(9), 3595–3602 (1999).
lems 15, R41–R93 (1999). 20. S. Matsuhashi, R. Fukuzawa, S. Okawa, Y. Hoshi, and Y. Yamada,
4. D. T. Delpy, M. C. Cope, E. B. Cady, J. S. Wyatt, P. A. Hamilton, P. L. “Effect of the movement of probes on the images of diffuse optical
Hope, S. Wray, and E. O. Reynolds, “Cerebral monitoring in newborn tomography,” in Proceedings of the Fourth Asian and Pacific Rim Symp.
infants by magnetic resonance and near infrared spectroscopy,” Scand. Biophotonics, pp. 139–140 (2009).
J. Clin. Lab. Invest. Suppl. 188, 9–17 (1987). 21. S. Ijicji, T. Kusaka, K. Isobe, K. Okubo, K. Kawada, M. Namba,
5. J. C. Hebden, A. Gibson, R. M. Yusof, N. Everdell, E. M. C. Hillman, H. Okada, T. Nishida, T. Imai, and S. Itoh, “Developmental
D. T. Delpy, S. R. Arridge, T. Austin, J. H. Meek, and J. S. Wyatt, changes of optical properties in neonates determined by near-
“Three-dimensional optical tomography of the premature infant brain,” infrared time-resolved spectroscopy,” Pediatr. Res. 58, 568–573
Phys. Med. Biol. 47, 4155–4166 (2002). (2005).
Journal of Biomedical Optics 116022-10 November 2011 r Vol. 16(11)
Downloaded From: https://www.spiedigitallibrary.org/journals/Journal-of-Biomedical-Optics on 01 Feb 2022
Terms of Use: https://www.spiedigitallibrary.org/terms-of-useYou can also read