Reducing inventory while attaining the desired service performance - Bachelor thesis Industrial Engineering and Management
←
→
Page content transcription
If your browser does not render page correctly, please read the page content below
Reducing inventory while attaining the
 desired service performance
Bachelor thesis Industrial Engineering and Management

 Willem Vincent
 S2176319

Bachelor thesis Industrial Engineering and Management
Reducing inventory while attaining the desired service performance

Author
Willem Vincent

S2176319

W.h.vincent@student.utwente.nl

University of Twente Slimstock
Drienerlolaan 5 Zutphenseweg 29

7522 NB, Enschede 7418 AH, Deventer

The Netherlands The Netherlands

Supervisors
First supervisor University of Twente: R.M. van Steenbergen (Robert)

Second Supervisor University of Twente: Dr. D.R.J. Prak (Dennis)

First supervisor Slimstock: E. van Dijk (Eric)

 1
Preface
Dear reader,

In front of you lies my bachelor thesis ‘Reducing inventory while attaining the desired service
performance’. This research was conducted for Slimstock and a customer of Slimstock a big Beneleux
DIY company between March and August 2021.

Hereby, I want to thank all people who supported me in the past few months. I primarily want to thank
Robert van Steenbergen, my first supervisor from the UT, for all his time and effort to supervise this
research. Secondly I want to thank Dennis Prak for the feedback he provided as second supervisor.

I also want to thank the people at Slimstock, for their time and interest and I want to thank Eric van
Dijk for giving me the opportunity to complete this research at Slimstock. I also want to thank the
people at the big Benelux DIY company with whom I had several meetings during this research.

I sincerely hope that you enjoy reading this thesis, and it generates new insights concerning inventory
management.

Kind regards,
Willem Vincent
Enschede, August 2021

 2
Management Summary
Slimstock is Europe's leading inventory optimization specialist. Slimstock's inventory software package
is an integrated solution for forecasting, demand planning, and inventory control and is designed and
built to help their customers get the right inventory to the right place at the right time. A Big Benelux
DIY company is a customer of Slimstock and uses Slimstocks inventory optimization software to
forecast demand and make ordering decisions for 4800 products in their central warehouse.
The problem that the DIY company and Slimstock are facing is that they expect that for some products
they miss their desired service performance. Service performance can be too low such that fewer
products are sold on time than targeted or service performance can be too high such that too much
inventory is in place for the desired service performance. Service performance is indicated on an
aggregated level for every product group. However, it is not known which products have a lower service
performance than desired and it is often also not known why this is the case. To research this the
following main research question was constructed:
How can Slimstock and the Big Benelux DIY company ensure that the desired service performance is
attained while minimizing inventory by getting insight into the achieved service performance per
product and optimizing parameters in the ordering policy model such that they better correspond to the
reality for their 4800 products?

The research started by analyzing the current situation, a closer look at the inventory model of Slimstock
(Slim4) was taken. When taking a closer look at the current situation a lot of things that needed further
understanding were found. This led to the construction of the literature review.
During the literature review, concepts, methods, and formulas were found that helped to get an
understanding of and made it possible to improve demand forecasting and the inventory model of
Slimstock which was in place at the DIY company.
After and during the literature review the knowledge which was found was linked to the current
situation. Understanding the concepts of inventory management enabled the understanding of Slim4. It
is determined that Slim4 works according to a Periodic-Review, Order-Up-to-Level (R, S) control
policy. For this control policy the variables on which inventory decisions depend were determined.
These variables are the base forecast, buffer stock (and the variables on which the bufferstock depends),
order quantities, review time, and lead time. Then there was looked into how the actual ordering process
goes. The parameters that have to be filled in by hand were determined. And in the end, because the
year in which this research is conducted is a special year due to COVID-19, container cost and thus
transport cost rised significantly and demand was unpredictable due to unexpected shop closures. The
impact of this on the supplychain was determined.
When the current situation was clear, a dashboard is constructed to determine the achieved service
performance over the past 54 weeks and this has been compared to the target service performance. It
was found out that the target service performance is determined with a target fill rate, which assumes
total backorders, and that the indication of the attained fill rate on an aggregated level assumes total lost
sales. This means that these two variables are not completely comparable. The target fill rate and attained
fill rates are both recalculated to KPIs which take the same amount of backorders into account. The
dashboard constructed is split into an underperformers part for products that performed below the target
fill rate and an overperformers part for products that performed above the target fill rate. It was estimated
that the DIY company missed €492.470,82 due to not reaching the target fill rate and gained €243.807,90
by overperforming the target fill rate over 54 weeks ending in April 2021, assuming a profit margin of
10% over the purchase price of the products. Another interesting finding is that the average inventory
cost over 54 weeks per product was €1.047,28 for an underperformer and € 1.630,87 for an
overperformer.

 3
After having a full picture of the current situation, we selected six products with outstanding KPIs to
perform a in-depth analysis. For these products, the parameters within the model were compared with
reality. In order to say something about the lead times, the DIY company should save the date on which
an order is placed. In order to say something about the review time, the past order levels should be
known. Both these things were not the case, such that only the MOQ could be compared with reality.
For product 1, a deviating MOQ could be found. For three products, indications were found that the
demand was higher than anticipated, however, this could not be checked because the past forecasts were
not saved.
It is shown how the order levels of April 2021 are calculated. We showed that the buffer stock needs to
rise by 79% when the real MOQ was filled in for product 1, this leads to an extra stock cost needed of
€78,13 for the month of April 2021. We also showed that for two of the selected six products it is
possible to order the EOQ and what the impact of this is on the buffer stock needed to attain the same
fill rate. Because of a reduction in buffer stock which results from ordering the EOQ we showed that in
the month of April 2021 for product 2 and product 4, €5,42 and €48,07 could be saved in stock cost
respectively.
Lastly, the result of implementing a review/lead time ratio of 0,25 on the order levels of the six products
is shown. For products with a huge review time compared to the lead time a significant reduction in
orderlevel and stockcost for the month of April 2021 can be seen. The result depends on the chosen
Review/lead time ratio, but the Review/lead time ratio makes sure that there is a constant ratio between
the inventory caused by lead time and the inventory cause by review time. Because the review time for
most products is set on one month this is especially useful in products with really short lead times (for
example a few days).
When looking at the main research question, it can be concluded that during this research certain ways
to decrease inventory level, while attaining the same target fill rate, were found or it is shown that in
reality more inventory was needed to attain the same target fill rate, without changing the desired service
performance. It was difficult to compare the reality with the parameters filled in Slim4 due to a lack of
data. However therefore the impact of implementing the EOQ and implementing a Review/lead time
ratio on the safety stock needed to attain the same target fill rateis shown and are the corresponding
changes in stock cost for April 2021 calculated.

 4
Inhoudsopgave
Preface ..................................................................................................................................................... 2
Management Summary ........................................................................................................................... 3
List of Figures ......................................................................................................................................... 8
List of Tables ........................................................................................................................................... 9
Readers guide ........................................................................................................................................ 10
1. Introduction ....................................................................................................................................... 11
 1.1 Slimstock and the Big Benelux DIY company............................................................................ 11
 1.2 Management problem .................................................................................................................. 11
 1.3 Problem cluster ............................................................................................................................ 12
 1.4 Core problems ............................................................................................................................. 14
 1.5 Scope ........................................................................................................................................... 14
 1.6 Research questions and problem-solving approach..................................................................... 14
 1.7 Limitations research design ......................................................................................................... 16
 1.8 Validity and reliability research design ....................................................................................... 16
 1.9 Deliverables ................................................................................................................................. 17
2. Literature review ............................................................................................................................... 18
 2.1 Inventory ..................................................................................................................................... 18
 2.1.1 Cycle inventory .................................................................................................................... 18
 2.1.2 Safety inventory ................................................................................................................... 18
 2.1.3 Congestion inventory............................................................................................................ 19
 2.1.4 Anticipation inventory .......................................................................................................... 19
 2.1.5 Pipeline inventory................................................................................................................. 19
 2.1.6 Decoupling inventory ........................................................................................................... 19
 2.1.7 Strategic inventory................................................................................................................ 19
 2.2 Lead time and review time .......................................................................................................... 19
 2.2.1 Lead time .............................................................................................................................. 20
 2.2.2 Review time .......................................................................................................................... 20
 2.3 Inventory control policies ............................................................................................................ 20
 2.3.1 Order-point, Order-Quantity (s, Q) System .......................................................................... 20
 2.3.2 Order-Point, Order-Up-to-Level (s, S) System ................................................................... 21
 2.3.3 Periodic-Review, Order-Up-to-Level (R, S) System............................................................ 21
 2.3.4 The (R, s, S) system.............................................................................................................. 22
 2.4 Demand models ........................................................................................................................... 22
 2.4.1 Deterministic demand function as a model .......................................................................... 22
 2.4.2 Static stochastic demand description as a model .................................................................. 23

 5
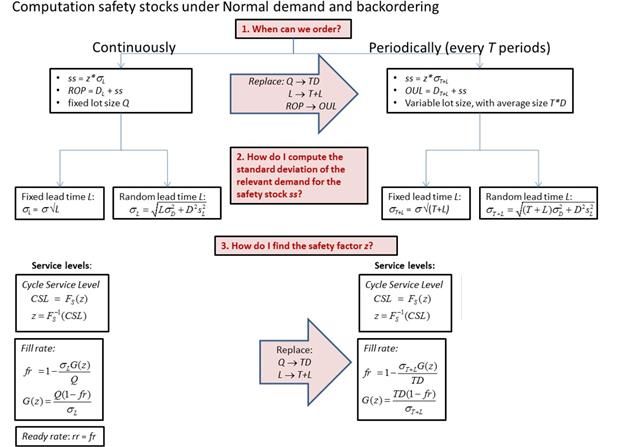
2.4.3 Dynamic stochastic demand description as a model ............................................................ 23
 2.5 Economic, Minimal, and Incremental Order Quantity ................................................................ 23
 2.5.1 Economic order quantity ...................................................................................................... 23
 2.5.2 Minimal Order Quantity (MOQ) .......................................................................................... 24
 2.5.3 Incremental Order Quantity (IOQ) ....................................................................................... 25
 2.6 Inventory performance indicators................................................................................................ 25
 2.6.1 Cycle service level................................................................................................................ 25
 2.6.2 Fill rate ................................................................................................................................. 25
 2.6.3 Ready rate ............................................................................................................................. 25
 2.6.4 Average inventory ................................................................................................................ 25
 2.7 Safety stock and cycle service level, fill rate when demand is normal and backordering........... 25
 2.8 ABC-Inventory qualification ....................................................................................................... 27
 2.9 Forecasting demand: Time series methods.................................................................................. 27
 2.9.1 Single exponential smoothing (SES) .................................................................................... 28
 2.9.2 Croston method .................................................................................................................... 28
 2.9.3 Holt-Winters’ Method .......................................................................................................... 28
3. Current situation analysis .................................................................................................................. 30
 3.1 Introduction of the current situation ............................................................................................ 30
 3.2 Order policy at the Big Benelux DIY company using Slim4 ...................................................... 30
 3.2.1 Base forecast......................................................................................................................... 30
 3.2.2 Buffer stock .......................................................................................................................... 30
 3.2.3 Order quantities .................................................................................................................... 31
 3.2.4 Review Time ....................................................................................................................... 31
 3.2.5 Lead times ............................................................................................................................ 31
 3.2.6 The actual ordering ............................................................................................................... 31
 3.3 List of parameters that should be filled in manually in Slim4..................................................... 31
 3.4 COVID-19 and the impact on the supply chain .......................................................................... 32
4. Dashboard.......................................................................................................................................... 33
 4.1 KPIs ......................................................................................................................................... 33
 4.2 Overperformers and underperformers ......................................................................................... 37
 4.3 Benchmarks for KPIs of the Big Benelux DIY company .......................................................... 37
 4.4 Findings dashboard overall situation ........................................................................................... 37
 4.4.1 Underperformers .................................................................................................................. 38
 4.4.2 Overperformers .................................................................................................................... 39
5. Analysis of selected products ............................................................................................................ 41
 5.1 Selected products......................................................................................................................... 41

 6
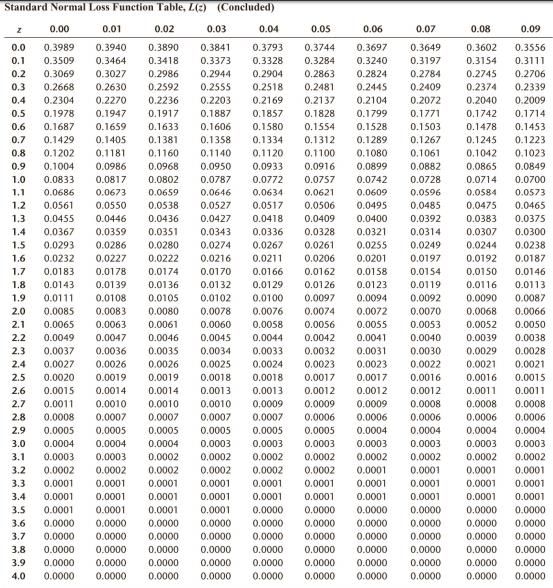
5.1.1 Underperformers .................................................................................................................. 41
 5.1.2 Overperformers .................................................................................................................... 42
 5.2 Reality versus Model ................................................................................................................... 42
 5.2.1 Findings reality versus model ............................................................................................... 43
6. Result of parameter discrepancy ....................................................................................................... 46
 6.1 Current situation .......................................................................................................................... 46
 6.2 Result on buffer stock needed with new MOQ for product 1 ..................................................... 47
 6.3 Economic order quantity ............................................................................................................. 48
 6.4 Implementing a review/ lead time ratio ....................................................................................... 49
7. Conclusion and recommendations..................................................................................................... 52
 7.1 Conclusion ................................................................................................................................... 52
 7.1.1 Getting insight into achieved service performance .............................................................. 52
 7.1.2 Optimizing parameters in the order policy model ................................................................ 53
 7.2 Recommendations ....................................................................................................................... 54
 7.2.1 DIY company ....................................................................................................................... 54
 7.2.2 Slimstock .............................................................................................................................. 54
 7.3 Assumptions and limitations ....................................................................................................... 55
 7.4 Contribution to practice ............................................................................................................... 55
 7.5 Further Research.......................................................................................................................... 55
 7.5.1 Implementing seasonality and trend in past real demand ..................................................... 56
 7.5.2 Implementing a target fill rate that takes backorders into account ....................................... 56
 7.5.3 Saving lead times and implementing lead time variability and forecasting ......................... 56
 7.5.4 Looking at the impact of over-ordering due to filling of containers .................................... 56
 7.5.5 Precise analysis of ordering and holding cost ...................................................................... 56
 7.5.6 Implementing dynamic smoothing factor ............................................................................. 56
References ............................................................................................................................................. 57
Appendix. .............................................................................................................................................. 59
 A. Standard normal loss function table. ............................................................................................ 59
 B. Calculations mutation stock cost April 2021 ................................................................................ 60
 C. Analyses of Selected products ...................................................................................................... 61

 7
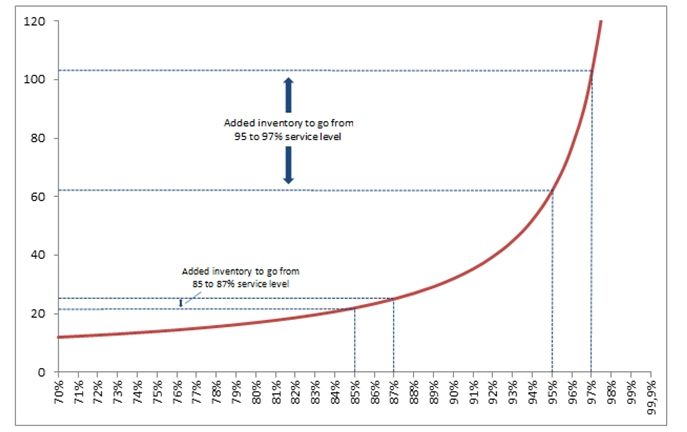
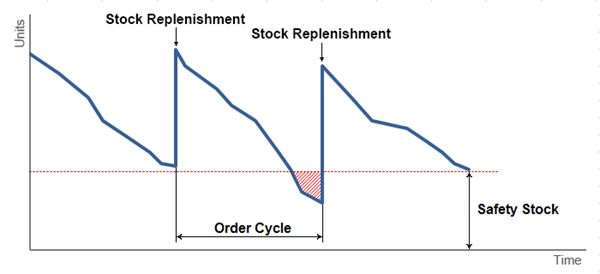
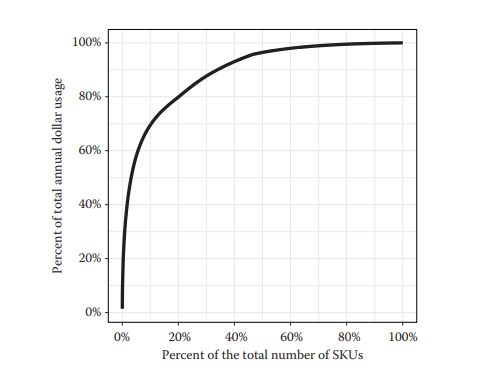
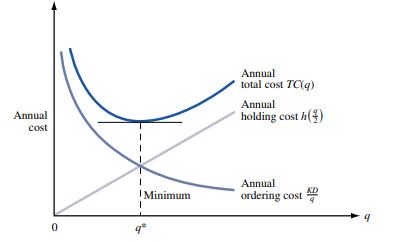
List of Figures
Figure 1.2: Stock levels over time. (Reprinted from Smirnov, 2020) .................................................... 11
Figure 1.2: Problem cluster. .................................................................................................................. 13
Figure 2.1 – The role of safety stock in an inventory cycle (reprinted from Smirnov, 2020) ................ 19
Figure 2.2: the (s, Q) system (on top) and the (s, S) system below. (reprinted from Silver et al., 2017)
............................................................................................................................................................... 21
Figure 2.3 The (R, S) system. Orders are placed every 10 periods with a lead time of 2 periods.
(reprinted from Silver et al., 2017) ........................................................................................................ 22
Figure 2.4: Trade-off between ordering and holding cost (reprinted from Winston, 2004) ................ 24
Figure 2.5: Formulas for calculating safety stock, service level, and fill rate (adapted from Van
Heeswijk, 2019) ..................................................................................................................................... 26
Figure 2.6: Relationship between service level and inventory position (reprinted from Schalit &
Vermorel, 2014). ................................................................................................................................... 26
Figure 2.7: Distribution of value of Stock keeping units (reprinted from Silver et al, 2017) ................ 27
Figure 3.1: Shanghai Containerized Freight Index (reprinted from Shanghai Shipping Exchange , 2021)
............................................................................................................................................................... 32
Figure 4.1: Distribution difference percentage demand fulfilled underperformers. ........................... 39
Figure 4.2: Distribution percentage demand fulfilled overperformers................................................. 40
Figure 5.1: Demand per week for product 1 extracted out of Slim4. ................................................... 44
Figure 5.2: Stock development per week for product 1 extracted out of Slim4. .................................. 44
figure 6.1: Distribution of the current review/lead time ratio for the products at the DIY company. 51
Figure C.1: Demand per week for product 2 extracted out of Slim4. ................................................... 61
Figure C.2: Stock evelopment per week for product 2 extracted out of Slim4. .................................... 61
Figure C.3: Demand per week for product 3 extracted out of Slim4. .................................................. 63
Figure C.4: Stock development per week for product 3 extracted out of Slim4 ................................... 63
Figure C.5: Demand per week for product 4 extracted out of Slim4. .................................................. 64
Figure C.6: Stock development per week for product 4 extracted out of Slim4 ................................... 65
Figure C.7: Demand per week for product 5 extracted out of Slim4. ................................................... 66
Figure C.8: Stock development per week for product 4 extracted out of Slim4 .................................. 66
Figure C.9: Demand per week for product 6 extracted out of Slim4. .................................................. 67
Figure C.10: Demand per week for product 6 extracted out of Slim4. ................................................. 68

 8
List of Tables
Table 3.1: Parameters that have to be filled in manually in slim4. ....................................................... 32
Table 4.1: Abbreviations for KPIs. ......................................................................................................... 33
Table 4.1: Assumptions Dashboard. ..................................................................................................... 38
Table 4.2: KPIs dashboard overall situation underperformers. ............................................................ 38
Table 4.3: KPIs dashboard overall situation overperformers ............................................................... 40
Table 5.1: Inventory situation underperformers 54 weeks. ................................................................. 42
Table 5.2: Inventory situation overperformers 54 ................................................................................ 42
Table 5.3: procurement orderliness of product 1. ................................................................................ 44
Table 5.4: Parameters as they are currently filled in in Slim4............................................................... 44
Table 6.1: Table with the parameters filled for the underperformers. ................................................ 47
Table 6.2: Table with the parameters filled in for the overperformers. ............................................... 47
Table 6.3: Result on buffer stock needed with new MOQ for product 1 .............................................. 48
Table 6.4 EOQ for underperformers and their result on the bufferstock while attaining the same fill
rate. ....................................................................................................................................................... 49
Table 6.5 EOQ for overperformers and their result on the bufferstock while attaining the same fill
rate ........................................................................................................................................................ 49
Table 6.6: Result on order level of implementing a review/ lead time ratio underperformers. .......... 50
Table 6.7: Result on order level of implementing a review/ lead time ratio overperformers. ............. 50
Table B.1: Calculation mutation stock cost April 2021.......................................................................... 60
Table B.2: Calculation mutation stock cost April 2021.......................................................................... 60
Table C.1: Procurement orderliness for product 2................................................................................ 62
Table C.2: Parameters as they are currently filled in in Slim4 for product 2. ....................................... 62
Table C.3: Procurement orderliness for product 3................................................................................ 64
Table C.4: Parameters as they are currently filled in in Slim4 for product 3. ....................................... 64
Table C.5: Procurement orderliness for product 4................................................................................ 65
Table C.6: Parameters as they are currently filled in in Slim4 for product 4. ....................................... 66
Table C.7: Procurement orderliness for product 5. .............................................................................. 67
Table C.8: Parameters as they are currently filled in in Slim4 for product 5. ...................................... 67
Table C.9: Procurement orderliness for product 6................................................................................ 68
Table C.10: Parameters as they are currently filled in in Slim4 for product REG_630647.................... 68

 9
Readers guide

Chapter 1 – Introduction
In chapter one, the introduction to the thesis is given. It contains the introduction of the company and
the problem context. Based on this the problem-solving approach is mentioned and further elaborations
on why and how the research is done are made.
Chapter 2 – Literature review
This chapter contains literature research about concepts, methods, and formulas of inventory
management. This chapter contains the literature needed to understand the inventory solution module of
Slimstock.
Chapter 3 – Current situation analysis
In this chapter, the literature found in chapter two is linked to the current situation of Slimstock and the
DIY company. Their order policy and the relation with Slim4 are discussed.
Chapter 4 – Dashboard
In Chapter four the dashboard which is constructed in order to show the achieved service performance
over 54 weeks is discussed. In this chapter, all KPIs used in the dashboard and the overall findings of
the dashboard are discussed.
Chapter 5 – Analysis of selected products
In this chapter, further elaboration will be done about products that are selected based on outstanding
KPIs constructed in chapter four. The parameters that are filled in for these products are compared with
reality.
Chapter 6 – Result of parameter discrepancy
In this chapter, it will be shown how the order levels for April 2021 are calculated and the results of the
parameter discrepancy on these order levels will be shown. Also, there will be shown what the result on
the buffer stock is of ordering EOQs for the products and there will be shown what the result is on the
order level of implementing a review/lead time ratio.
Chapter 7 – Conclusions and recommendations
In this chapter, the conclusions and recommendations of this research will be presented. Also, a
discussion will be made about the limitations of the research, and suggestions for further research will
be mentioned.

 10
1. Introduction
This chapter introduces the research. A description is provided of the company and the relevance of the
research is discussed (Section 1.1). After that, the focus will be on describing the problem and
identifying the core problem, this is the basis for this research. We will start with the management
problem (Section 1.2) after which we will continue to the problem cluster (Section 1.3) which will
dissect the management problem into multiple problems and shows their relation. Out of the problem
cluster, we will extract the core problems (Section 1.4). The core problems can be expressed in a norm
and reality. After that Section 1.5, we will elaborate on the scope and in Section 1.6 the chosen problem
solving approach with corresponding research questions will be explained. After this, the limitations of
the research (Section 1.7) and the validity and reliability (Section 1.8) of the research design will be
discussed. To end in Section 1.9, the deliverables will be evaluated.

1.1 Slimstock and the Big Benelux DIY company
This research will be conducted at the company Slimstock. Founded in 1993, Slimstock has become
Europe's leading inventory optimization specialist. Slimstock's inventory model is an integrated solution
for forecasting, demand planning, and inventory control and is designed and built to help their customers
get the right inventory to the right place at the right time.
Furthermore, this research will be conducted at a customer of Slimstock, a Big Benelux DIY company.
This company serves a lot of people in the Benelux when it comes to do-it-yourself equipment and other
equipment for in and around the house. This company has a central distribution centre (DC). Suppliers
deliver to this distribution centre and the company delivers to their retailers and webshop out of this DC.

1.2 Management problem
The models of Slimstock use a certain desired service level as input of the safety stock calculations for
their customer's supply chain. This desired service level is seen as a benchmark for service performance
for supply chain managers who use the software of Slimstock. This benchmark determines the amount
of inventory that is expected to be delivered directly out of inventory. In the literature, this service level
is called a target fill rate.
Based on the desired service level a certain safety stock is determined. This safety stock should be able
to catch volatilities in demand and lead time and therefore prevent stock-outs. By choosing a certain
service level, the supply chain manager determines to which extent stock-outs should be tolerated, while
not having too high inventory cost. Figure 2.1 shows how safety stock prevents stock-outs.

Figure 1.2: Stock levels over time. (Reprinted from Smirnov, 2020)

 11
A customer of Slimstock, a DIY company, has a central DC out of which they deliver products to their
retailers. Slimstock helps the DIY company with inventory management for 4800 products in the central
DC but in reality, there are more products in stock in the warehouse.
When doing this they strive for a certain desired service level as mentioned above. However, they lack
insight into the achieved service level per product. When the achieved service performance is different
from the desired service performance, this can be caused by a wrong amount of stock that is in place
such that the desired service level cannot be achieved.
On aggregated level, this company has insight into their achieved service performance. This means that
they have insight per product group. Because of this, they know that in some product groups there are
problems with the achieved service level. However, the achieved service performance per product is
unknown. On aggregated level this is done by estimating the missed demand for a group of products and
dividing it by the real demand. This is fraction of missed demand, when you substract this amount from
one you will get the fraction attained demand, the service level, on aggregated level as it is called by
Slimstock.
The company wants to get insight into the achieved service level per product in order to better spot
differences between desired and achieved service performance. This will hopefully help to spot issues
causing these differences. These issues could be, for example, parameters put wrongly in the model of
Slimstock or certain factors that are not accounted for when determining the stock levels.
Not all issues are unknown, for example for some suppliers it is known that they have not been able to
deliver products on time or at all. In that case, it is clear what the cause is for the bad service performance.
However unknown weak spots could be found when having a better insight into the achieved service
performance. An example of a potential unknown weak spot could be a constant underestimation of lead
times. It is easier to find a problem if you know there is one.
This results in the following management problem:
Slimstock and the Big Benelux DIY company suspect that they do not meet their desired service
performance for several products.

1.3 Problem cluster
After defining the management problem the next step is to design a problem cluster based on the
management problem. “A problem cluster is used to map all problems along with their connection. It
serves to bring order to the problem context and to identify the core problem” (Heerkens & Van Winden
2017, p. 42) The problem cluster belonging to this management problem can be found in Figure 2.2.

 12
Figure 1.2: Problem cluster.

The management problem is that the desired and the actual service performance do not correspond
(problem 9). Having a difference between the desired and actual service performance is caused by
different problems. The first problem is that potential issues per product are not spotted (3) this in its
turn is because it is unknown which products perform differently than their target service levels (2). This
is not known because there is no KPI defined for the achieved service performance per product (1).
Another cause for a difference between desired and actual service performance is that there could be an
incorrect amount of stock in place to reach the desired service levels. This can be due to the fact that
there are parameters in the system which are not filled in correctly or optimally in comparison to reality
(7). One problem that could cause this discrepancy is that suppliers do not deliver (on time) (6). This
will cause the parameters filled in to not correspond with reality. When decisions are made for a lead
time of 5 weeks by the system but in reality, the order comes after 10 weeks, the inventory model is
suboptimal. However, it is out of the scope of this research to solve supplier issues due to COVID-19
because it is not solvable with the given materials.

 13
Another problem that could cause the incorrect amount of stock is that there could be other unknown
causes that can’t be extracted out of the available data (10). This involves manual mistakes in the
warehouse for example. This falls also out of the scope of this research and is therefore noted in red.
The last problem is that the forecast could deviate from reality (4). This will lead to an incorrect amount
of cycle stock and therefore will lead to different attained service performance than targeted. This
problem is unsolvable and falls therefore out of scope because the forecast is not saved in the data.
The blue problems are added for relevance in order to show the results of the desired and attained service
performance not corresponding. And are therefore the results of the management problem.

1.4 Core problems
In order to select the core problem, we have to go back in the problem cluster to come to the problems
which have no clear causes themselves. Also, problems that cannot be influenced cannot be a core
problem. This leaves us with the following core problems:
The achieved service performance per product for 4800 products is not measured.
And
There exists a possible discrepancy between parameters put in the stock calculations and real/optimal
parameters such that the desired and actual service performance do not correspond.
For the first problem Slimstock and the Big Benelux DIY company use service levels, put in their
models, as the norm for their service performance. However, the reality is that this benchmark is not
directly measurable per product and is only estimated on aggregated levels, per product group for
example.
The norm for the second problem is that the parameters are filled in in the model as close to reality as
possible. However in reality it is suspected that parameters are not filled in optimally and therefore
suboptimal stock is taken to reach the desired service performance.

1.5 Scope
Because of a limitation in time a scope has to be determined for this research. The initial scope of this
research will involve measuring the achieved service performance for all the 4800 products at the DC
of the Big Benelux DIY company. However, when doing further analyses only the most interesting
products or product(s)(groups) with generalizable insights will be picked. The number of products
picked depends on the amount of time left and the results obtained in the previous phase. When coming
on certain recommendations like switching suppliers, there will not be enough time to implement and
evaluate. Therefore, this will not be part of the scope of this research.

1.6 Research questions and problem-solving approach
Based on the two core problems the following main research question is constructed for this research:

How can Slimstock and the Big Benelux DIY company ensure that the desired service performance is
attained while minimizing inventory by getting insight into the achieved service performance per
product and optimizing parameters in the ordering policy model such that they better correspond to the
reality for their 4800 products?

 14
In order to answer the main research question. A problem-solving approach with corresponding sub-
questions is constructed. The sub-questions will be answered throughout the chapters.
Phase 1: Literature analysis (Chapter 2)
It is useful to look at the literature to get a better understanding of the subject. The theory will clarify
the most relevant terms, theories, and formulas.
Sub-questions:

 1. What is the role of inventory in a supply chain?
 2. Which inventory control policies are described in the literature?
 3. What are factors that can have an influence on service performance according to literature?
 4. Which inventory performance KPIs exist in the literature?
 5. What are methods to forecast demand according to the literature?

Phase 2: Research current situation (Chapter 3)

In this phase, the current situation at Slimstock and the Big Benelux DIY company is analysed. This
will help to get a better understanding of the management problem. Researching the current situation
will help get insight into the model of Slimstock. And we will look at which parameters influence the
order policy and thus the service performance.

Sub-questions:

 6. What is the current order policy at the DIY company with the model of Slimstock?
 7. How is demand forecasted with the model of Slimstock?
 8. Which parameters influence when, how and how much of a product is ordered in the model of
 Slimstock?

Phase 3: Construct KPIs and implement them in a dashboard with other product data (Chapter 4).
When having a good picture of the current situation at Slimstock and the DIY company and after
providing an overview of the literature, the service performance KPIs can be constructed over a past
time frame. These KPIs are needed to look into the problems which are not spotted because of the lack
of insight into the achieved service performance. These KPIs will be constructed with the available data
and determined for all 4800 products of the DIY company. After this, we will compare the values of
these KPIs for the different products. A dashboard will be constructed in which products with
outstanding values can be grouped. In this dashboard, other data should be visible as well, suppliers,
lead times, and product groups for example. This way products can be grouped efficiently and service
performance can be linked to relevant data that has an influence on service performance.

Sub-questions:
 9. Which quantitative data concerning inventory management is available at the DIY company and
 Slimstock?
 10. How can the data be made available as an input of the KPIs?
 11. How does the target service level put in the model of Slimstock relate to achieved service
 performance?
 12. What are the consequences on costs for the Big Benelux DIY company for too low/high service
 performance?

 15
Phase 4: Analysis of selected products (Chapter 5)
It is out of the scope of this research to investigate all 4800 products, therefore, certain products will be
selected based on KPIs that differ from the benchmarks of the DIY company. Further analysis will be
done on these selected products. The current inventory situation of these selected will be determined
and there will be looked at the real procurement order lines of these products. With the help of the real
procurement order lines, the parameters filled in by the DIY company in de model of Slimstock will be
compared to reality.

Sub-questions:
 13. Which products are interesting to select for further analysis based on the constructed KPIs and
 the benchmarks of the DIY company?
 14. What is the current inventory situation of the selected products?
 15. Which data can be extracted out of the procurement order lines?
 16. How do the parameters put in the model of Slimstock compare to the parameters found in the
 data?

Phase 5: Result on service performance of (possible) parameter discrepancy (Chapter 6)
After the analysis of the selected products, we will make calculations to analyse the result of the possible
parameter discrepancy on the service performance of the selected products at the current order levels.

Sub-questions:
 17. What are the formulas with which stock levels with a corresponding target service performance
 are determined?
 18. What is the result of the service performance of parameters not corresponding with reality?
 19. Can the achieved service performance be improved by adjusting parameters to reality?

Phase 6:Conclusions and recommendations (Chapter 7)
In the last phase, conclusions will be drawn and recommendations will be made based on the phases
mentioned before.

1.7 Limitations research design
The limitations of a research design are shortcomings conditions or influences that place restrictions on
its methodology and conclusions. The first limitation of this research is time, this research has to be
conducted in 10 weeks, which is relatively a short amount of time for this type of research.
Another limitation present during this research is that the formulas used by the model of Slimstock have
to remain confidential. Therefore the precise formulas used cannot be used in this bachelor thesis.
Something that also should be considered as a limitation is the possibility that contradicting information
is retrieved or that no data at all can be retrieved. This will have a significant impact on the outcome of
this research. For this research design, we expect that all necessary data is available. This is most likely
the case, but due to certain unknown difficulties, some data might not be able to be retrieved.

1.8 Validity and reliability research design
According to Heerkens and Van Winden (2017) validity is about the extent to which is measured what
was intended to measure. Validity can be split up into three types of validity, internal validity (Are your
research design and your measuring instruments properly formulated?), external validity (Is your
research applicable to other groups?) and construct validity (Are your concepts properly operationalized,
logical related and were based on scientific knowledge?). This research should suffice to all these three
types of validity. Regarding internal validity, it is assumed that the data provide by Slimstock and the

 16
Big Benelux DIY company is correct. In this research, the data providers and the researcher have a
common interest. In order to minimize bias, the finding will be written down and will be checked with
the stakeholders at Slimstock and the Big Benelux DIY company. Also, it is important to notice that
some of the formulas, KPIs, and definitions used in this research will differ from the ones used by
Slimstock. It is important to have an understanding of all used terms to make sure all used formulas,
KPI’s and definitions are understandable for every party.
Concerning external there should be noted that there is worked with 4800 different products, no
unjustifiable generalizations must be made. Construct validity is tackled by clearly defining constructs
in this thesis.
Reliability is, according to Heerkens and Van Winden (2017), concerned with the stability of the
research result. This is with the corona pandemic in mind and the damage this has done to supply chains
everywhere a challenge. The Big Benelux DIY company has also been struck with the closure of retailers
which led to big changes in demand and therefore to changes in service performance. It should therefore
be mentioned that some conclusions and recommendations are only for the short term. A short-term
conclusion can be for example that a supplier is unreliable due to COVID-19 which was never the case
before the pandemic struck, therefore taking on a second supplier could be a short-term
recommendation. A long-term conclusion can be that a supplier always has been unreliable, therefore a
long-term recommendation could be switching suppliers altogether. This should be evaluated in the
conclusions and recommendations.

1.9 Deliverables
 - Analysis of literature.
 - Overview of the current situation.
 - Definitions of constructed KPI(s).
 - Dashboard with explanation in which achieved service performance can be linked to several
 variables.
 - Selected products with criteria.
 - Inventory situation of selected products.
 - Comparison parameters reality and model.
 - Recommendations and conclusions on how to change parameters.
 - Recommendations on further research.

 17
2. Literature review
In this chapter, relevant theory to this research will be discussed. This literature focuses on inventory
management. First, there will be discussed what inventory is and what its role is in a supply chain and
we will elaborate on the different types of inventory (Section 2.1). After this we will look at lead time
(Section 2.2.1) and review time (Section 2.2.2), inventory control policies (Section 2.3), inventory
theory models(Section 2.4), economic, minimal, and incremental order quantity (Section 2.5), inventory
performance indicators (Section 2.6), the relation between safety stock and cycle service level (Section
2.7), ABC-inventory qualification (Section 2.8) and forecasting demand (Section 2.9). This theory is
needed to understand the current situation and construct further upon in this research.

2.1 Inventory
Before investigating the service performance of inventory, we discuss the concept of inventory, its role
within the supply chain and the different types of inventory.

Inventory are items kept in storage. Inventory exists in the supply chain because of a mismatch between
supply and demand. Sometimes this mismatch is intentional, for example when it is economical to
produce in large lots or for a retail store that wants to prepare for an increase in demand. In these
instances, inventory is held to reduce cost or increase the level of product availability. Inventory affects
the assets held, the costs incurred, and responsiveness provided in the supply chain. High levels of
inventory in an apparel supply chain improve responsiveness, but also leave the supply chain vulnerable
to the need for markdowns, lowering profit margins. Higher inventory levels also facilitate a reduction
in production and transportation costs, because of improved economies of scale in both functions. This
choice, however, increases inventory holding costs. In general, managers should aim to reduce inventory
in ways that do not increase the cost or reduce responsiveness (Chopra and Meindl, 2016).

Different types of inventory can be distinguished. These types of inventory are mentioned in the next
subsections. The different types of inventory are noted because there can be different reasons why
inventory is in place. To be able to make correct judgments about why inventory is in place it is useful
to have an understanding of the types of inventory. The different types of inventory are mainly found in
Silver et al. (2017), but are complemented with other literature like Chopra and Meindl (2016) Axsäter
(2015) and Winston (2014).

2.1.1 Cycle inventory
Cycle inventory is the average amount of inventory used to satisfy demand between receipts of supplier
shipments. (Chopra and Meindl, 2016). Cycle inventory is the result of an attempt to order or produce
in batches instead of one unit at a time. The amount of inventory on hand, at any point, that results from
these batches is called cycle stock. The amount of cycle stock in inventory is determined by management
which makes a trade-off between holding and ordering costs (Silver et al., 2017).

2.1.2 Safety inventory
Safety stock is the amount of inventory kept on hand, on average, to allow for the uncertainty
of demand and the uncertainty of supply in the short run. Safety stocks are not needed when the
future rate of demand and the length of time it takes to get complete delivery of an order is known
with certainty. The level of safety stock is controllable in the sense that this investment is directly
related to the desired level of customer service (Silver et al., 2017). Safety stock acts as a buffer in case
of a stock out. This does not mean that safety stock is meant to eliminate all stock-outs, just the majority
of them (King, 2011), Figure 2.1 illustrates this.

 18
Figure 2.1 – The role of safety stock in an inventory cycle (reprinted from Smirnov, 2020)

When demand is forecasted, demand uncertainty is lowered as much as possible, meaning that safety
stocks can be reduced. However, not all uncertainties can be taken away by trying to predict the future.
Therefore, even when forecasting, safety stock is held; but only if the costs of understocking are higher
than costs of overstocking. To determine this safety stock, it must be known how uncertain the forecast
is, in other words, how large the forecast errors tend to be (Axsäter, 2006).

2.1.3 Congestion inventory
Congestion inventories are inventories arising due to items competing for limited capacity. When
multiple items share the same production equipment, particularly when there are significant setup times,
inventories of these items build up as they wait for the equipment to become available (Silver et al.,
2017).

2.1.4 Anticipation inventory
Anticipation inventory consists of stock accumulated in advance of an expected peak in sales.
When demand is regularly lower than average during some parts of the year, excess inventory (above
cycle and safety stock) can be built up so that, during the period of high anticipated requirements, extra
demand can be serviced from stock rather than from, for example, working overtime in the plant (Silver
et al., 2017).

2.1.5 Pipeline inventory
Pipeline inventories include goods in transit (e.g., in physical pipelines, on trucks,
or in railway cars) between levels of a multi-echelon distribution system or between adjacent work
stations in a factory (Silver et al., 2017).

2.1.6 Decoupling inventory
Decoupling inventory is used in a multi-echelon situation to permit the separation of decision-making
at the different echelons. For example, decoupling inventory allows decentralized decision-making
at branch warehouses without every decision at a branch having an immediate impact on, say,
the central warehouse or factory (Silver et al., 2017).

2.1.7 Strategic inventory
Strategic stock is the stock that is placed with a strategic reason, for example when the Brexit occurred
this could have been a strategic reason to increase inventory (Dijk, Leeuw, Durlinger, 2017).

2.2 Lead time and review time
The time between an order that comes in and the next order to come in is the lead time plus the review
time. In this section, there will be elaborated on these concepts.

 19
You can also read