RECONSTRUCTION OF LNCRNA-MIRNA-MRNA NETWORK BASED ON COMPETITIVE ENDOGENOUS RNA REVEALS FUNCTIONAL LNCRNAS IN SKIN CUTANEOUS MELANOMA
←
→
Page content transcription
If your browser does not render page correctly, please read the page content below
Zhu et al. BMC Cancer      (2020) 20:927
https://doi.org/10.1186/s12885-020-07302-5

 RESEARCH ARTICLE                                                                                                                                     Open Access

Reconstruction of lncRNA-miRNA-mRNA
network based on competitive endogenous
RNA reveals functional lncRNAs in skin
cutaneous melanoma
Junyou Zhu1, Jin Deng2, Lijun Zhang1, Jingling Zhao1, Fei Zhou1, Ning Liu1, Ruizhao Cai1, Jun Wu1, Bin Shu1* and
Shaohai Qi1*

  Abstract
  Background: Human skin cutaneous melanoma is the most common and dangerous skin tumour, but its
  pathogenesis is still unclear. Although some progress has been made in genetic research, no molecular indicators
  related to the treatment and prognosis of melanoma have been found. In various diseases, dysregulation of lncRNA
  is common, but its role has not been fully elucidated. In recent years, the birth of the “competitive endogenous
  RNA” theory has promoted our understanding of lncRNAs.
  Methods: To identify the key lncRNAs in melanoma, we reconstructed a global triple network based on the
  “competitive endogenous RNA” theory. Gene Ontology and KEGG pathway analysis were performed using DAVID
  (Database for Annotation, Visualization, and Integration Discovery). Our findings were validated through qRT-PCR
  assays. Moreover, to determine whether the identified hub gene signature is capable of predicting the survival of
  cutaneous melanoma patients, a multivariate Cox regression model was performed.
  Results: According to the “competitive endogenous RNA” theory, 898 differentially expressed mRNAs, 53
  differentially expressed lncRNAs and 16 differentially expressed miRNAs were selected to reconstruct the
  competitive endogenous RNA network. MALAT1, LINC00943, and LINC00261 were selected as hub genes and are
  responsible for the tumorigenesis and prognosis of cutaneous melanoma.
  Conclusions: MALAT1, LINC00943, and LINC00261 may be closely related to tumorigenesis in cutaneous melanoma.
  In addition, MALAT1 and LINC00943 may be independent risk factors for the prognosis of patients with this
  condition and might become predictive molecules for the long-term treatment of melanoma and potential
  therapeutic targets.
  Keywords: Human skin cutaneous melanoma, lncRNA, Competitive endogenous RNA, MALAT1, LINC00943,
  LINC00261, miRNA

* Correspondence: shubin29@sina.com; qishh@mail.sysu.edu.cn
1
 Department of Burn, The First Affiliated Hospital, Sun yat-sen University,
Guangzhou, Guangdong 510080, People’s Republic of China
Full list of author information is available at the end of the article

                                          © The Author(s). 2020 Open Access This article is licensed under a Creative Commons Attribution 4.0 International License,
                                          which permits use, sharing, adaptation, distribution and reproduction in any medium or format, as long as you give
                                          appropriate credit to the original author(s) and the source, provide a link to the Creative Commons licence, and indicate if
                                          changes were made. The images or other third party material in this article are included in the article's Creative Commons
                                          licence, unless indicated otherwise in a credit line to the material. If material is not included in the article's Creative Commons
                                          licence and your intended use is not permitted by statutory regulation or exceeds the permitted use, you will need to obtain
                                          permission directly from the copyright holder. To view a copy of this licence, visit http://creativecommons.org/licenses/by/4.0/.
                                          The Creative Commons Public Domain Dedication waiver (http://creativecommons.org/publicdomain/zero/1.0/) applies to the
                                          data made available in this article, unless otherwise stated in a credit line to the data.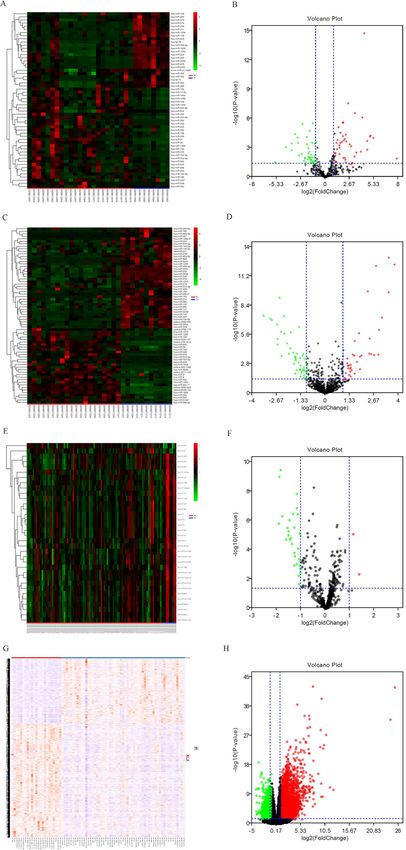
Zhu et al. BMC Cancer      (2020) 20:927   Page 2 of 20

 Fig. 1 Study flow of this study
Zhu et al. BMC Cancer   (2020) 20:927                                                                                          Page 3 of 20

Background                                                      Table 1 The clinicopathological features of twelve SKCM
Human skin cutaneous melanoma (SKCM) is the most                patients for qRT-PCR validation
common and dangerous type of skin tumour [1, 2]. World-         Patients ID          Pathological diagnosis        TNM                Stagea
wide, approximately 232,000 (1.7%) cases of cutaneous mel-      001                  SKCM                          T3AN1AM0           IIIB
anoma are reported among all newly diagnosed primary            002                  SKCM                          T3AN0M0            IIA
malignant cancers, and this disease results in approximately
                                                                003                  SKCM                          T3BN0M0            IIB
55,500 cancer deaths (0.7% of all cancer deaths) [1, 3]. The
                                                                004                  SKCM                          T2AN0M0            IA
incidence of melanoma in Australia, New Zealand, Norway,
Sweden, the UK, and the USA from 1982 to 2011 has               005                  SKCM                          T1AN0M0            IA
shown increases of approximately 3% annually and will fur-      006                  SKCM                          T1AN0M0            IA
ther increase until 2022 [3]. In 2015, there were 3.1 million   007                  SKCM                          T2BN0M0            IIA
people with melanoma, resulting in 59,800 deaths [4].           008                  SKCM                          T1AN0M0            IA
Nevertheless, 95,710 cases of melanoma in situ will be
                                                                009                  SKCM                          T4BN2AM0           IIIC
newly diagnosed in 2020 [5]. The high incidence and high
                                                                010                  SKCM                          T2BN0M0            IIA
mortality of melanoma indicate that researchers must fur-
ther study this disease. Although some achievements have        011                  SKCM                          T3AN0M0            IIA
been made in the genetic research of melanoma, markers          012                  SKCM                          T3BN0M0            IIB
related to diagnosis and treatment are needed.                  Abbrevations: SKCM Skin cutaneous melanoma; TNM Tumor node metastasis
                                                                a
   Tumorigenesis often results from aberrant transcrip-          Pathologic tumor stage is according to AJCC staging for SKCM (8th edition)

tomes, including aberrant levels of coding RNA and
noncoding RNA [6–8]. It has been proven that lncRNAs            the development of lncRNA-directed diagnostics and
have various effects, including regulation of gene tran-        therapeutics against this disease [23–25]. Unfortunately,
scription, post-transcriptional regulation and epigenetic       however, such functional interactions have not yet been
regulation [9–12]. In addition, dysregulation of lncRNAs        elucidated in melanoma.
has been observed in various diseases [13–16]. Unfortu-           In this study, we used bioinformatics methods to con-
nately, the functions of lncRNAs are more difficult to          struct the ceRNA network of cutaneous melanoma and
identify than those of coding RNAs. Until now, only a           to identify the key lncRNAs involved in melanomagen-
few lncRNAs have been identified as crucial factors in          esis. Through the reconstruction of a ceRNA network,
the tumorigenesis and development of melanoma, in-              we identified and verified that the key ceRNA molecules
cluding ZNNT1, THOR and SAMMSON [14, 15, 17].                   play a crucial role in the tumorigenesis and prognosis of
Thus, how to locate them and define their functions is a        SKCM. (Work flow was shown in Fig. 1).
challenge of current research.
   The effect of miRNAs on malignancies has been veri-          Methods
fied in many ways. Studies have suggested that lncRNAs          Raw data
can regulate miRNA abundance by binding and seques-             Human melanoma miRNA expression data were down-
tering them [18]. Thus, we aimed to study the function          loaded from the NCBI GEO database (GEO (http://
of lncRNAs by studying the interactions among
lncRNAs, mRNAs and miRNAs. In 2011, the competi-                Table 2 Exon locus of MALAT1, LINC00943 and LINC00261
tive endogenous RNA (ceRNA) hypothesis proposed a               Gene                  Exon number             Locusa
novel regulatory mechanism between noncoding RNA                MALAT1                Exon 1                  Chr 11:65265481–65,265,876
and coding RNA [19–21]. This theory indicated that any                                Exon 2                  Chr 11:65265159–65,265,336
RNA transcript harbouring miRNA-response elements                                     Exon 3                  Chr 11:65266440–65,271,376
(MREs) can sequester miRNAs from other targets shar-
                                                                                      Exon 4                  Chr 11:65273731–65,273,902
ing the same MREs and thereby regulate their expres-
sion [19–21]. That is, the RNA transcripts that can be          LINC00943             Exon 1                  Chr 12:127221553–127,221,702
cross regulated by each other can be biologically pre-                                Exon 2                  Chr 12:127227286–127,228,026
dicted according to their common MREs [20, 22]. Evi-                                  Exon 3                  Chr 12:127229316–127,229,434
dence has shown that ceRNAs exist in several species                                  Exon 4                  Chr 12:127229552–127,230,800
and contexts and might play an important role in vari-          LINC00261             Exon 1                  Chr 20:22559148–22,559,280
ous biological processes, such as tumorigenesis [21]. Sys-
                                                                                      Exon 2                  Chr 20:22548432–22,548,523
tematic analysis of the ceRNA network has been
performed in multiple tumours, such as gastric cancer,                                Exon 3                  Chr 20:22547321–22,547,443
bladder cancer, and ovarian cancer, contributing to a                                 Exon 4                  Chr 20:22541192–22,545,754
better understanding of tumorigenesis and facilitating          a
                                                                    The information of exons belongs to the hg19 database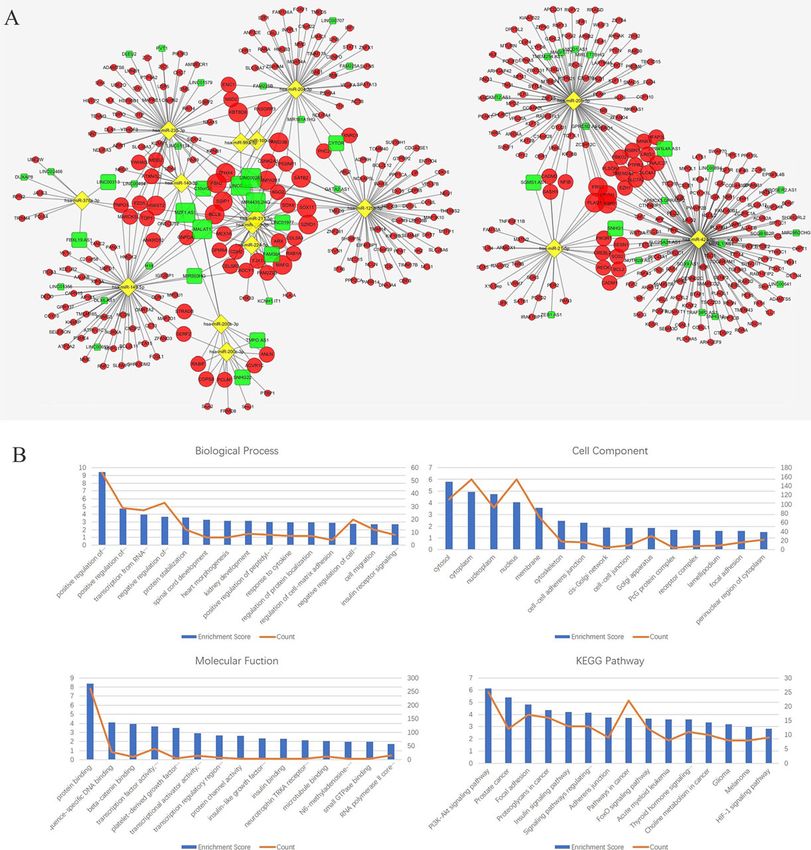
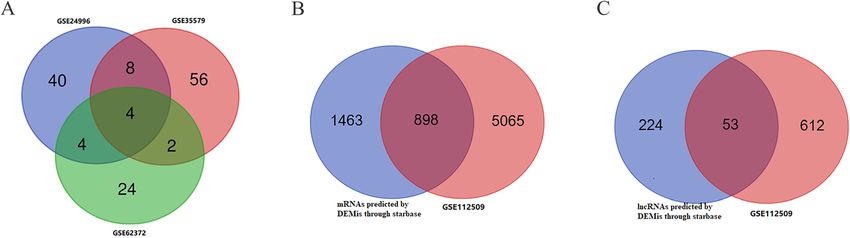
Zhu et al. BMC Cancer      (2020) 20:927                                                                                              Page 4 of 20

 Fig. 2 a Heatmap analysis of miRNA differential expressed profiles in GSE24996; (b) Volcano analysis of miRNA expressed profiles in GSE24996; (c)
 Heatmap analysis of miRNA differential expressed profiles in GSE35579; (d) Volcano analysis of miRNA expressed profiles in GSE35579; (e)
 Heatmap analysis of miRNA differential expressed profiles in GSE62372; (f) Volcano analysis of miRNA expressed profiles in GSE62372; (g) Heatmap
 analysis of RNA differential expressed profiles in GSE112509; (h) Volcano analysis of RNA expressed profiles in GSE112509. (These images were
 produced by R version 3.4.2)
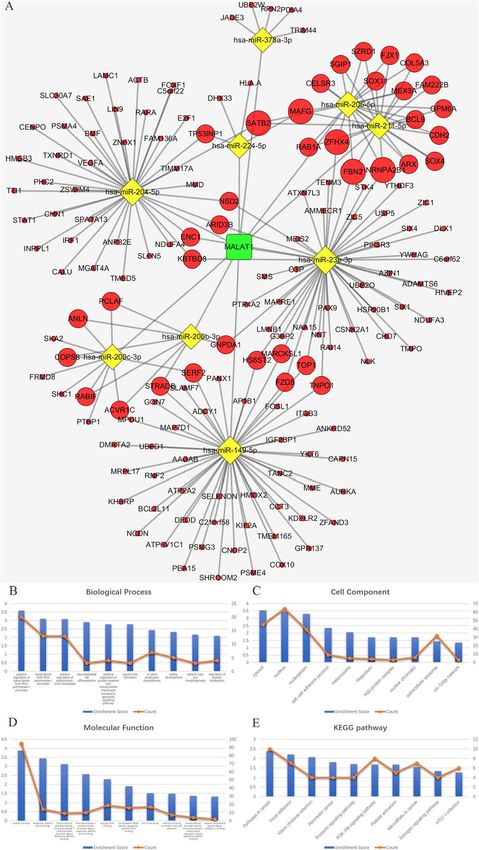
Zhu et al. BMC Cancer     (2020) 20:927                                                                                             Page 5 of 20

 Fig. 3 Venn diagram: (a) DEMis were selected with |log2FC| > 1 and adjusted P-value < 0.05 among the non-coding RNA profiling sets, GSE24996,
 GSE35579 and GSE62372. The candidates 18 miRNAs were shared in at least two datasets. b DEMs were selected by intersecting mRNAs
 predicted by DEMis through starbase and differential expressed mRNAs in GSE112509. c DELs were selected by intersecting lncRNAs predicted by
 DEMis through starbase and differential expressed lncRNAs in GSE112509. (These images were produced by R version 3.4.2)

www.ncbi.nlm.nih.gov/geo) [26], including GSE24996,                       and 20 primary melanoma tissue samples. The GSE62372
GSE35579, and GSE62372, which are array-based data-                       dataset consists of 9 benign nevus tissue samples and 92 pri-
sets. The GSE24996 dataset consists of 8 benign nevus tis-                mary melanoma tissue samples. mRNA and lncRNA expres-
sue samples and 23 primary melanoma tissue samples. The                   sion data were also downloaded from the NCBI GEO
GSE35579 dataset consists of 11 benign nevus tissue samples               database (GSE112509), which is a sequence-based dataset.

 Fig. 4 a ceRNA network. The round rectangle represents lncRNAs, the diamond represents miRNAs, and the ellipse represents mRNAs. There are
 53 lncRNA nodes, 16 miRNA nodes, 898 mRNA nodes and 609 edges in the network. b-e Biological function and pathway analysis of differentially
 expressed mRNAs. b The top 15 significant changes in GO-BP. c The top 15 significant changes in the GO-CC. d The top 15 significant changes in
 the GO-MF. e The top 15 significant changes in the KEGG pathway. Note: more details are shown in Table 3. (Fig. 4a was produced by Cytoscape
 version 3.7.1)
Zhu et al. BMC Cancer           (2020) 20:927                                                                                                  Page 6 of 20

Table 3 The top 15 significant changes in GO-BP (A), −CC (B),                  Table 3 The top 15 significant changes in GO-BP (A), −CC (B),
−MF(C) and KEGG pathway (D) according to differentially                        −MF(C) and KEGG pathway (D) according to differentially
expressed genes in ceRNA network                                               expressed genes in ceRNA network (Continued)
A                                                                                  protein binding              8.364509           260     61.18    < 0.001
    GO-BP Term                    Enrichment Score   Count   %       P-Value       sequence-specific DNA        4.118515           28      6.588    < 0.001
                                                                                   binding
    positive regulation of        9.446887           56      13.18   < 0.001
    transcription from RNA                                                         beta-catenin binding         3.946374           10      2.353    < 0.001
    polymerase II promoter
                                                                                   transcription factor         3.635935           41      9.647    < 0.001
    positive regulation of        4.759462           29      6.824   < 0.001       activity, sequence-
    transcription, DNA-                                                            specific DNA binding
    templated
                                                                                   platelet-derived growth      3.50464            5       1.176    < 0.001
    transcription from RNA        3.957811           27      6.353   < 0.001       factor receptor binding
    polymerase II promoter
                                                                                   transcriptional activator    2.912949           15      3.529    0.001
    negative regulation of        3.674737           33      7.765   < 0.001       activity, RNA polymerase
    transcription from RNA                                                         II core promoter proximal
    polymerase II promoter                                                         region sequence-specific
                                                                                   binding
    protein stabilization         3.580807           12      2.824   < 0.001
                                                                                   transcription regulatory     2.667561           7       1.647    0.002
    spinal cord development       3.291952           6       1.412   < 0.001       region sequence-specific
    heart morphogenesis           3.157839           6       1.412   < 0.001       DNA binding

    kidney development            3.144958           9       2.118   < 0.001       protein channel activity     2.637341           4       0.941    0.002
    positive regulation of        3.001168           8       1.882   < 0.001       insulin-like growth factor   2.344093           4       0.941    0.005
    peptidyl-serine                                                                receptor binding
    phosphorylation                                                                insulin binding              2.293839           3       0.706    0.005
    response to cytokine          2.967806           7       1.647   0.001         neurotrophin TRKA            2.124416           3       0.706    0.008
    regulation of protein         2.967806           7       1.647   0.001         receptor binding
    localization                                                                   microtubule binding          2.037592           12      2.824    0.009
    regulation of cell-matrix     2.914902           4       0.941   0.001         N6-methyladenosine-          1.984943           3       0.706    0.01
    adhesion                                                                       containing RNA binding
    negative regulation of        2.759652           20      4.706   0.002     small GTPase binding             1.982255           4       0.941    0.01
    cell proliferation
                                                                                   RNA polymerase II core       1.726919           16      3.765    0.019
    cell migration                2.732195           12      2.824   0.002         promoter proximal region
    insulin receptor              2.724648           8       1.882   0.002         sequence-specific DNA
    signaling pathway                                                              binding

B                                                                              D

    GO-CC Term                    Enrichment Score   Count   %       P-Value       KEGG pathway                 Enrichment Score   Count   %        P-Value

    cytosol                       5.793638           111     26.12   < 0.001       PI3K-Akt signaling pathway   6.144606           25      5.882    < 0.001

    cytoplasm                     4.942099           154     36.24   < 0.001       Prostate cancer              5.389517           12      2.824    < 0.001

    nucleoplasm                   4.725908           93      21.88   < 0.001       Focal adhesion               4.815445           17      4        < 0.001
    nucleus                       4.05725            154     36.24   < 0.001       Proteoglycans in cancer      4.365137           16      3.765    < 0.001
    membrane                      3.599508           73      17.18   < 0.001       Insulin signaling pathway    4.202316           13      3.059    < 0.001
    cytoskeleton                  2.478053           18      4.235   0.003         Signaling pathways           4.141148           13      3.059    < 0.001
                                                                                   regulating pluripotency
    cell-cell adherens            2.302618           16      3.765   0.005         of stem cells
    junction
                                                                                   Adherens junction            3.732503           9       2.118    < 0.001
    cis-Golgi network             1.888299           5       1.176   0.013
                                                                                   Pathways in cancer           3.709619           22      5.176    < 0.001
    cell-cell junction            1.877361           10      2.353   0.013
                                                                                   FoxO signaling pathway       3.670169           12      2.824    < 0.001
    Golgi apparatus               1.852153           30      7.059   0.014
                                                                                   Acute myeloid leukemia       3.609095           8       1.882    < 0.001
    PcG protein complex           1.690927           4       0.941   0.02
                                                                                   Thyroid hormone              3.584028           11      2.588    < 0.001
    receptor complex              1.672147           8       1.882   0.021         signaling pathway
    lamellipodium                 1.616858           9       2.118   0.024         Choline metabolism in        3.353402           10      2.353    < 0.001
    focal adhesion                1.603246           16      3.765   0.025         cancer

    perinuclear region of         1.496331           22      5.176   0.032         Glioma                       3.20572            8       1.882    < 0.001
    cytoplasm                                                                      Melanoma                     2.973883           8       1.882    0.001
C                                                                                  HIF-1 signaling pathway      2.844366           9       2.118    0.001
    GO-MF Term                    Enrichment Score   Count   %       P-Value
Zhu et al. BMC Cancer (2020) 20:927 Page 7 of 20
The GSE112509 dataset consists of 23 benign nevus tissue ceRNA network we reconstructed above by calculating
samples and 57 primary melanoma tissue samples. the number of lncRNA-miRNA and miRNA-mRNA
pairs. For these key lncRNAs, GO-BP, GO-CC, GO-MF
Identification of DEMis, DELs and DEMs and KEGG pathway annotation were performed accord-
For identification of the differentially expressed miRNAs ing to their first mRNA neighbours by using DAVID
(DEMis) between primary melanoma and benign nevus (version 6.8, https://david.ncifcrf.gov/) [33, 34].
samples, “R” (version 3.4.2, https://www.r-project.org/) [27]
was used with the “limma” package after normalization
[28]. For identification of the differentially expressed Sample selection for qRT-PCR validation
lncRNAs (DELs) and mRNAs (DEMs) between pri- To validate findings in the ceRNA network, we selected
mary melanoma and benign nevus samples, “R” (ver- the top three hub genes to determine their expression in
sion 3.4.2, https://www.r-project.org/) [27] was used cutaneous melanoma and skin tissues. Twelve patients
with the “DESeq2” package [29]. The DEMis, DELs with cutaneous melanoma and three healthy patients
and DEMs were selected according to |log2FC| > 1 were included in this study. The study protocol was ap-
and adjusted P-value < 0.05. proved by the Ethics Committee of The First Affiliated
Hospital, Sun Yat-sen University. All patients provided
Prediction of target lncRNAs and mRNAs written informed consent in compliance with the code
For prediction of the target lncRNAs and mRNAs of ethics of the World Medical Association (Declaration
through DEMis, starBase (starbase.sysu.edu.cn) was of Helsinki). The eligible patients for this study had to
used in our study [30]. Multiple lncRNA/mRNA- meet the following criteria: (1) histologically confirmed
predicting programmes (PITA, RNA22, miRmap, as melanoma; (2) received no radiotherapy, chemother-
DIANA-microT, miRanda, PicTar and TargetScan) apy or biotherapy before surgery. The exclusion criteria
were used in starBase [30]. For accuracy, only when were as follows: (1) previous malignancies; (2) concomi-
the target mRNA was predicted in at least four pre- tant malignancies; (3) serious active infection; and (4)
dicted programmes on starBase would it be chosen pregnancy or lactation.
as the predicted target mRNA. Then, these pre- Eligible cutaneous melanoma patients were from The
dicted target lncRNAs and mRNAs were merged First Affiliated Hospital, Sun Yat-sen University
with DEMs and DELs, respectively. (Guangzhou, Guangdong, China) or the Cancer Center
of Guangzhou Medical University (Guangzhou, Guang-
dong, China). Each tumour sample was matched with
Reconstruction of the ceRNA network
adjacent apparently normal tissues removed during the
The ceRNA network was reconstructed based on ceRNA
same operation. Frozen sections were made from these
theory [20] and as follows: (1) Expression correlation be-
tissues and examined by at least three pathologists. The
tween DELs and DEMs was evaluated using the Pearson
clinicopathological features of twelve skin cutaneous
correlation coefficient (PCC). The DEL-DEM pairs with
melanoma patients (51.67 ± 14.57 years old) for qRT-
PCC > 0.4 and P-value < 0.01 were considered coexpressed
PCR validation are shown in Table 1. Three healthy pa-
lncRNA-mRNA pairs. (2) Both lncRNAs and mRNAs in
tients from The First Affiliated Hospital, Sun Yat-sen
the pairs were negatively correlated with their common
University (Guangzhou, Guangdong, China) were in-
miRNAs. (3) The ceRNA network was reconstructed and
cluded in this study. These patients were scheduled to
visualized using Cytoscape (version 3.7.1, https://cytos-
undergo split-thickness skin grafting due to deep partial
cape.org/) [31, 32].
burn wounds. Each normal skin sample was obtained
from the donor site. All the samples were frozen imme-
Functional enrichment analysis diately after the operation and were stored in liquid ni-
For functional enrichment, Gene Ontology (GO) bio- trogen until RNA isolation.
logical process (BP), cell component (CC), molecular
function (MF) and Kyoto Encyclopedia of Genes and
Genomes (KEGG) pathway analysis of mRNAs in the
ceRNA network were performed using DAVID (version Table 4 The number of the highest lncRNA–miRNA and
6.8, https://david.ncifcrf.gov/) [33, 34]. miRNA–mRNA pairs
lncRNA-miRNA pairs miRNA-mRNA pairs Total number
Hub gene selection and reconstruction of key ceRNA MALAT1 9 200 209
subnetworks LINC00943 7 202 209
To reconstruct our key ceRNA subnetwork, we first se- LINC00261 5 158 163
lected hub genes according to the node degrees of theZhu et al. BMC Cancer (2020) 20:927 Page 8 of 20 RNA isolation and qRT-PCR DNA (cDNA) was synthesized from 2 μg RNA using Total RNA was extracted from all fresh-frozen sam- the GoScript Reverse Transcription System (Promega, ples using TRIzol reagent (Invitrogen, USA). The OD USA). The qRT-PCR comprised 10 μl of GoTaq qPCR value (260/280) of all RNA extracted samples was Master Mix (2×) (Promega, USA), 2 μl of diluted greater than 1.8. For each replicate, complementary cDNA template (1:10) and 10 μM of each primer Fig. 5 a The ceRNA sub-network of MALAT1. The round rectangle represents lncRNAs, the diamond represents miRNAs, and the ellipse represents mRNAs. There are 1 lncRNA nodes, 9 miRNA nodes, 158 mRNA nodes and 209 edges in the network. b-e Biological function and pathway analysis of MALAT1 paired mRNAs. b The top 10 significant changes in the GO-BP. c The top 10 significant changes in the GO-CC. d The top 10 significant changes in the GO- MF. e The top 10 significant changes in the KEGG pathway. Note: more details are shown in Table 5. (Fig. 5a was produced by Cytoscape version 3.7.1)
Zhu et al. BMC Cancer     (2020) 20:927                                                                                            Page 9 of 20

contributing to a total volume of 20 μl. Reactions                        ATT; GAPDH Fw: GAGAGGGAAATCGTGCGTGAC;
were run in an ABI 7500 real-time PCR system (Ap-                         GAPDH Rev.: CATCTGCTGGAAGGTGGACA.
plied Biosystems, USA) under the following condi-
tions: 95 °C for 10 mins and 40 cycles of 95 °C for 15                    Multivariate cox regression model for survival analysis
s and 60 °C for 60 s. Melting curves were derived for                     To carry out a multivariate Cox regression analysis for
every reaction to ensure a single product. Relative                       survival analysis of patients with MALAT1, LINC00943,
gene expression was evaluated according to the ddCT                       and LINC00261 CNV-deficient cutaneous melanoma,
method, using the human GAPDH gene as an en-                              we first used the UCSC genome browser (http://genome.
dogenous control for RNA load and gene expression                         ucsc.edu/index.html) to determine the number and re-
in the analysis. All experiments were performed in                        gion of exons of MALAT1, LINC00943, and LINC00261.
triplicate. GraphPad Prism 8 (GraphPad Software,                          All information belongs to the hg19 database (Table 2).
USA) was used to output figures.                                          A total of 537 SKCM patients were from the Skin Cuta-
  The primers were as follows: MALAT1 Fw.: GACGAG                         neous Melanoma (TCGA, PanCancer Atlas, https://gdc.
TTGTGCTGCGAT; MALAT1 Rev.: TTCTGTGTTA                                     cancer.gov/about-data/publications/pancanatlas) [35] and
TGCCTGGTTA; LINC00943 Fw.: GGATTGGATT                                     Metastatic Melanoma (DFCI, Science 2015, https://www.
GTGGATTGC; LINC00943 Rev.: CAGGTCTCAG                                     ncbi.nlm.nih.gov/projects/gap/cgi-bin/study.cgi?study_id=
TTCAGTGTT; LINC00261 Fw.: CTTCTTGACCACAT                                  phs000452.v2.p1) [36–38] datasets. Raw data were down-
CTTACAC; LINC00261 Rev.: GGACCATTGCCTCTTG                                 loaded from cBioPortal (http://www.cbioportal.org/) [39].

 Fig. 6 a The ceRNA sub-network of LINC00943. The round rectangle represents lncRNAs, the diamond represents miRNAs, and the ellipse
 represents mRNAs. There are 1 lncRNA nodes, 7 miRNA nodes, 182 mRNA nodes and 209 edges in the network. b-e Biological function and
 pathway analysis of LINC00943 paired mRNAs. b The top 10 significant changes in the GO-BP. c The top 10 significant changes in the GO-CC. d
 The top 10 significant changes in the GO-MF. e The top 10 significant changes in the KEGG pathway. Note: more details are shown in Table 6.
 (Fig. 6a was generated by Cytoscape version 3.7.1)
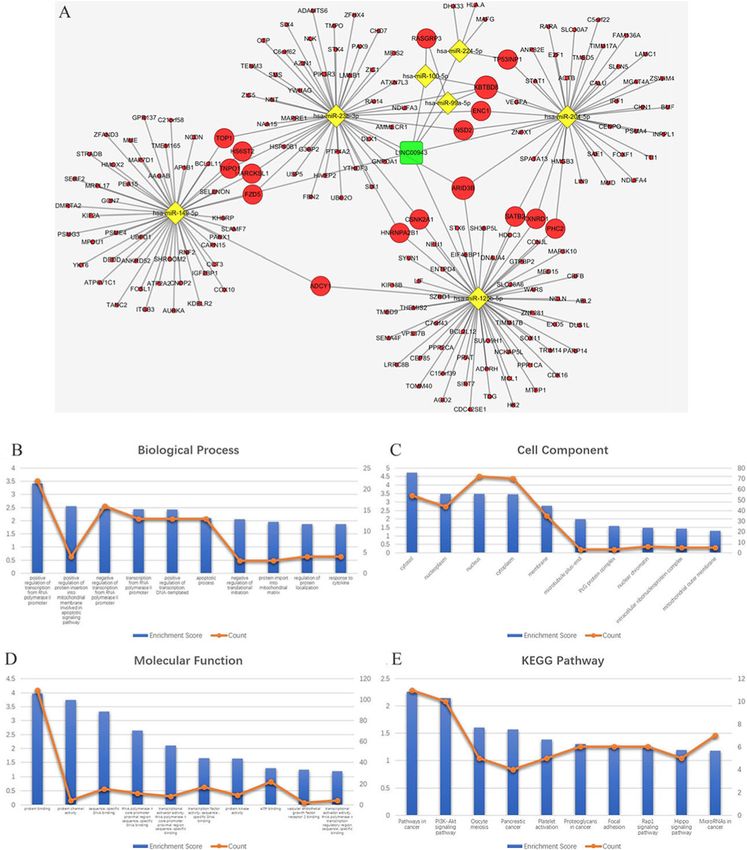
Zhu et al. BMC Cancer     (2020) 20:927                                                                                          Page 10 of 20

 Fig. 7 a The ceRNA sub-network of LINC00261. The round rectangle represents lncRNAs, the diamond represents miRNAs, and the ellipse
 represents mRNAs. There are 1 lncRNA nodes, 5 miRNA nodes, 123 mRNA nodes and 163 edges in the network. b-e Biological function and
 pathway analysis of LINC00261 paired mRNAs. b The top 10 significant changes in the GO-BP. c The changes in the GO-CC. d The top 10
 significant changes in the GO-MF. e The changes in the KEGG pathway. Note: more details are shown in Table 7. (Fig. 7a was generated by
 Cytoscape version 3.7.1)
Zhu et al. BMC Cancer          (2020) 20:927                                                                                                 Page 11 of 20

Table 5 The top 15 significant changes in GO-BP (A), −CC (B),                 Table 5 The top 15 significant changes in GO-BP (A), −CC (B),
−MF(C) and KEGG pathway (D) according to differentially                       −MF(C) and KEGG pathway (D) according to differentially
expressed genes in MALAT1-ceRNA sub-network                                   expressed genes in MALAT1-ceRNA sub-network (Continued)
A                                                                                 perinuclear region of                 1.205186     10      5.714   0.062
                                                                                  cytoplasm
    GO-BP Term                         Enrichment   Count   %       P-Value
                                       Score                                      membrane                              1.146558     25      14.29   0.071
    positive regulation of             3.579259     20      11.43   < 0.001       spindle                               1.134303     4       2.286   0.073
    transcription from RNA
    polymerase II promoter                                                    C

    transcription from RNA             3.106442     13      7.429   < 0.001       GO-MF Term                            Enrichment   Count   %       P-Value
    polymerase II promoter                                                                                              Score

positive regulation of                 3.091753     13      7.429   < 0.001       protein binding                       3.880727     95      54.29   < 0.001
transcription, DNA-                                                               sequence-specific                     3.451663     14      8       < 0.001
templated                                                                         DNA binding
    neuroepithelial cell               2.894845     3       1.714   0.001         transcriptional activator             3.120112     9       5.143   < 0.001
    differentiation                                                               activity, RNA polymerase
    positive regulation of             2.772993     4       2.286   0.002         II core promoter proximal
    protein insertion into                                                        region sequence-specific
    mitochondrial membrane                                                        binding
    involved in apoptotic                                                         RNA polymerase II core                2.566023     10      5.714   0.003
    signaling pathway                                                             promoter proximal region
    neural tube formation              2.772164     3       1.714   0.002         sequence-specific DNA
                                                                                  binding
    in utero embryonic                 2.425229     7       4       0.004
    development                                                                   poly(A) RNA binding                   2.27862      19      10.86   0.005

    kidney development                 2.315189     5       2.857   0.005         transcription factor                  1.893028     16      9.143   0.013
                                                                                  activity, sequence-
    camera-type eye                    2.158154     3       1.714   0.007         specific DNA binding
    morphogenesis
                                                                                  zinc ion binding                      1.508313     17      9.714   0.031
    regulation of protein              2.092037     4       2.286   0.008
    localization                                                                  cadherin binding                      1.481723     7       4       0.033
                                                                                  involved in cell-cell
    inner ear morphogenesis            2.092037     4       2.286   0.008         adhesion
    positive regulation of             2.011071     3       1.714   0.01          transcriptional activator             1.359345     4       2.286   0.044
    branching involved                                                            activity, RNA polymerase
    in ureteric bud                                                               II transcription regulatory
    morphogenesis                                                                 region sequence-specific
                                                                                  binding
    positive regulation of             1.967555     3       1.714   0.011
    neuroblast proliferation                                                      vascular endothelial                  1.315103     2       1.143   0.048
                                                                                  growth factor receptor
    negative regulation of             1.923719     13      7.429   0.012         2 binding
    transcription from RNA
    polymerase II promoter                                                        N6-methyladenosine-                   1.249923     2       1.143   0.056
                                                                                  containing RNA binding
    cell migration                     1.922663     6       3.429   0.012
                                                                                  mRNA 5′-UTR binding                   1.144306     2       1.143   0.072
B
                                                                                  protein heterodimerization activity   1.046398     8       4.571   0.09
    GO-CC Term                         Enrichment   Count   %       P-Value
                                       Score                                      RNA polymerase II                     1.031152     5       2.857   0.093
                                                                                  regulatory region
    cytosol                            3.530641     45      25.71   < 0.001       sequence-specific
    nucleus                            3.429028     64      36.57   < 0.001       DNA binding

    nucleoplasm                        3.288165     39      22.29   < 0.001       DNA binding                           1.029587     20      11.43   0.093

    cell-cell adherens                 2.341584     9       5.143   0.005     D
    junction                                                                      GO-MF Term                            Enrichment   Count   %       P-Value
    melanosome                         2.052614     5       2.857   0.009                                               Score

    filopodium                         1.71293      4       2.286   0.019         protein binding                       3.880727     95      54.29   < 0.001

    PcG protein complex                1.707154     3       1.714   0.02          sequence-specific                     3.451663     14      8       < 0.001
                                                                                  DNA binding
    nuclear chromatin                  1.705842     6       3.429   0.02
                                                                                  transcriptional activator             3.120112     9       5.143   < 0.001
    extracellular exosome              1.429256     32      18.29   0.037         activity, RNA polymerase
    cis-Golgi network                  1.35117      3       1.714   0.045         II core promoter proximal
                                                                                  region sequence-specific
    spindle microtubule                1.314751     3       1.714   0.048         binding
    cytoplasm                          1.239444     52      29.71   0.058         RNA polymerase II core                2.566023     10      5.714   0.003
                                                                                  promoter proximal
Zhu et al. BMC Cancer (2020) 20:927 Page 12 of 20
Table 5 The top 15 significant changes in GO-BP (A), −CC (B), (Supplementary Table 2, Fig. 2a-f). The candidate 18
−MF(C) and KEGG pathway (D) according to differentially miRNAs were shared in at least two datasets (Fig. 3a):
expressed genes in MALAT1-ceRNA sub-network (Continued) hsa-miRNA-378a-3p, hsa-miRNA-23b-3p, hsa-
region sequence-specific miRNA-140-3p, hsa-miRNA-99a-5p, hsa-miRNA-100-
DNA binding
5p, hsa-miRNA-204-5p, hsa-miRNA-211-5p, hsa-
poly(A) RNA binding 2.27862 19 10.86 0.005 miRNA-205-5p, hsa-miRNA-224-5p, hsa-miRNA-
transcription factor 1.893028 16 9.143 0.013 200b-3p, hsa-miRNA-200c-3p, hsa-miRNA-125b-5p,
activity, sequence-
specific DNA binding hsa-miRNA-149-5p, hsa-miRNA-21-5p, hsa-miRNA-
zinc ion binding 1.508313 17 9.714 0.031
20b-5p, hsa-miRNA-424-5p, hsa-miRNA-203a-3p and
hsa-miRNA-1826. According to method 2.3, 2361
cadherin binding 1.481723 7 4 0.033
involved in cell-cell mRNAs and 277 lncRNAs were predicted using these
adhesion miRNAs. We ruled out two of these 18 DEMis, hsa-
transcriptional activator 1.359345 4 2.286 0.044 miRNA-203a-3p and hsa-miRNA-1826, because no
activity, RNA polymerase predicted gene was found in starBase according to
II transcription regulatory
region sequence-specific method 2.3. In addition, 5953 DEMs and 665 DELs
binding between benign nevus tissues and primary melanoma
vascular endothelial growth 1.315103 2 1.143 0.048 tissues were identified in GSE112509 (Fig. 2g and h).
factor receptor 2 binding As a result, a total of 898 DEMs and 53 DELs were
N6-methyladenosine- 1.249923 2 1.143 0.056 selected for further analysis according to method 2.3
containing RNA binding
(Fig. 3b and c). Finally, 898 DEMs, 53 DELs and 16
mRNA 5′-UTR binding 1.144306 2 1.143 0.072
DEMis were selected for further reconstruction of
protein heterodimerization 1.046398 8 4.571 0.09 the lncRNA-miRNA-mRNA (ceRNA) network.
activity
The lncRNA-miRNA-mRNA (ceRNA) network, con-
RNA polymerase II 1.031152 5 2.857 0.093
regulatory region
sisting of 53 lncRNA nodes, 16 miRNA nodes, 898
sequence-specific mRNA nodes and 609 edges, was reconstructed and vi-
DNA binding sualized using Cytoscape (Fig. 4a).
DNA binding 1.029587 20 11.43 0.093
KEGG pathway and GO enrichment analysis of lncRNAs
By further analysing the copy number variation (CNV) based on the ceRNA network
data of these 537 patients, we determined whether each We used DAVID to analyse the biological classifica-
melanoma sample had deletions of these exons. Seg. tion of DEMs according to method 2.5. The results of
means ≤ − 0.3 were considered CNV deficiency, others the top 15 significant GO terms and KEGG pathways
were considered without CNV deficiency (see https:// are shown in Table 3 and Fig. 4b-e. Sixty pathways
docs.gdc.cancer.gov/Data/Bioinformatics_Pipelines/CNV_ were significantly enriched through KEGG pathway
Pipeline/, and CNV and patient information are shown in analysis, including the PI3K-Akt signalling pathway,
Supplementary Table 1). focal adhesion, proteoglycans in cancer, pathway in
To determine which factors should be included in the cancer and, most importantly, melanomagenesis. The
multivariate Cox regression model, we first performed results of GO-BP analysis revealed 172 enriched
the univariate Cox regression model for survival analysis. terms, particularly in the regulation of transcription,
Factors that were statistically significant (p < 0.05) in the such as positive regulation of transcription from the
univariate Cox regression model were included in the RNA polymerase II promoter, positive regulation of
multivariate Cox regression model, and the multivariate transcription (DNA-templated), and transcription
Cox regression model for survival analysis was per- from the RNA polymerase II promoter.
formed. SPSS 22.0 was used for the analysis of the Cox
regression model. Hub gene selection
According to the node degree in the ceRNA net-
Results work, we found that three lncRNAs, MALAT1,
Identification of DEMs, DELs and DEMis and LINC00943, and LINC00261, had the highest number
reconstruction of the lncRNA-miRNA-mRNA (ceRNA) of lncRNA-miRNA and miRNA-mRNA pairs, sug-
network gesting that these three lncRNAs could be chosen as
After standardization of the GEO datasets, 56, 70 hub nodes, and the results are shown in Table 4.
and 34 DEMis between benign nevus tissues and Therefore, these three lncRNAs might play an essen-
primary melanoma tissues were identified in tial role in melanomagenesis and might be consid-
GSE24996, GSE35579 and GSE62372, respectively ered key lncRNAs.Zhu et al. BMC Cancer (2020) 20:927 Page 13 of 20
Table 6 The top significant changes in GO-BP (A), −CC (B), Table 6 The top significant changes in GO-BP (A), −CC (B),
−MF(C) and KEGG pathway (D) according to differentially −MF(C) and KEGG pathway (D) according to differentially
expressed genes in LINC00943-ceRNA sub-network expressed genes in LINC00943-ceRNA sub-network (Continued)
A mitochondrial outer 1.3075 5 2.778 0.049
membrane
GO-BP Term Enrichment Count % P-Value
Score endoplasmic 1.253057 14 7.778 0.056
reticulum
positive regulation 3.413985 22 12.22 < 0.001 membrane
of transcription from
RNA polymerase II perinuclear region 1.207393 11 6.111 0.062
promoter of cytoplasm
positive regulation of 2.5522952 4 2.222 0.003 MLL5-L complex 1.146143 2 1.111 0.071
protein insertion into
mitochondrial 1.096965 2 1.111 0.08
mitochondrial
membrane involved inner membrane
presequence
in apoptotic signaling
translocase complex
pathway
C
negative regulation of 2.4555568 16 8.889 0.004
transcription from RNA GO-MF Term Enrichment Count % P-Value
polymerase II promoter Score
transcription from RNA 2.4471842 13 7.222 0.004 protein binding 3.972219 109 60.56 < 0.001
polymerase II promoter
protein channel 3.7469 4 2.222 < 0.001
positive regulation of 2.4336944 13 7.222 0.004 activity
transcription, DNA-
templated sequence-specific 3.320627 15 8.333 < 0.001
DNA binding
apoptotic process 2.1092412 13 7.222 0.008
RNA polymerase II 2.640286 11 6.111 0.002
negative regulation of 2.064083 3 1.667 0.009 core promoter
translational initiation proximal region
sequence-specific
protein import into 1.95711 3 1.667 0.011
DNA binding
mitochondrial matrix
transcriptional 2.106865 8 4.444 0.008
regulation of protein 1.8821494 4 2.222 0.013
localization activator activity,
RNA polymerase II
response to cytokine 1.8821494 4 2.222 0.013 core promoter
proximal region
cellular response to 1.7404426 3 1.667 0.018
sequence-specific
cytokine stimulus
binding
cell morphogenesis 1.6784701 4 2.222 0.021
transcription factor 1.648871 17 9.444 0.022
positive regulation of 1.6028585 3 1.667 0.025 activity, sequence-
mesenchymal cell specific DNA binding
proliferation
protein kinase activity 1.643895 9 5 0.023
intracellular protein 1.6019839 7 3.889 0.025
ATP binding 1.307149 22 12.22 0.049
transport
vascular endothelial 1.25008 2 1.111 0.056
protein sumoylation 1.5991972 5 2.778 0.025
growth factor receptor
B 2 binding
GO-CC Term Enrichment Count % P-Value transcriptional activator 1.197916 4 2.222 0.063
Score activity, RNA polymerase
II transcription regulatory
cytosol 4.721026 54 30 < 0.001 region sequence-specific
nucleoplasm 3.468485 44 24.44 < 0.001 binding
nucleus 3.459493 72 40 < 0.001 N6-methyladenosine- 1.185193 2 1.111 0.065
containing RNA binding
cytoplasm 3.448156 70 38.89 < 0.001
P-P-bond-hydrolysis- 1.129258 2 1.111 0.074
membrane 2.786622 35 19.44 0.002 driven protein
microtubule plus-end 1.979181 3 1.667 0.01 transmembrane
transporter activity
PcG protein complex 1.593489 3 1.667 0.025
poly(A) RNA binding 1.119963 17 9.444 0.076
nuclear chromatin 1.476598 6 3.333 0.033
chromatin binding 1.08038 8 4.444 0.083
intracellular 1.428852 5 2.778 0.037
ribonucleoprotein mRNA 5′-UTR binding 1.080159 2 1.111 0.083
complexZhu et al. BMC Cancer (2020) 20:927 Page 14 of 20
Table 6 The top significant changes in GO-BP (A), −CC (B), Expression of MALAT1, LINC00943 and LINC00261 is higher
−MF(C) and KEGG pathway (D) according to differentially in tumour tissues
expressed genes in LINC00943-ceRNA sub-network (Continued) To confirm the expression of MALAT1, LINC00943
D and LINC00261 in melanoma tissues, we evaluated
KEGG pathway Enrichment Count % P-Value the MALAT1, LINC00943 and LINC00261 expression
Score levels in the cancer tissues from 12 melanoma pa-
Pathways in cancer 2.26453 11 6.111 0.005 tients (see Table 1) and 3 healthy tissues via qRT-
PI3K-Akt signaling 2.145933 10 5.556 0.007 PCR, as shown in Fig. 8. The results showed that the
pathway expression of MALAT1, LINC00943 and LINC00261
Oocyte meiosis 1.604046 5 2.778 0.025 was significantly higher in the tumour tissues than in
Pancreatic cancer 1.566902 4 2.222 0.027 the healthy tissues (p = 0.0243, p = 0.0005, p < 0.0001,
Platelet activation 1.386975 5 2.778 0.041
respectively). Additionally, the expression of MALAT1,
LINC00943 and LINC00261 was significantly higher in
Insulin signaling 1.307592 5 2.778 0.049
pathway the tumour tissues than in the adjacent normal tis-
sues (p = 0.0002, p < 0.0001, p < 0.0001, respectively).
Proteoglycans in 1.304184 6 3.333 0.05
cancer However, no significant difference was observed be-
tween the healthy tissues and the adjacent normal
Focal adhesion 1.259046 6 3.333 0.055
skin tissues in the expression of MALAT1, LINC00943
Rap1 signaling 1.229991 6 3.333 0.059
pathway and LINC00261 (p = 0.366, p = 0.379, p = 0.262, re-
spectively). The results are consistent with those dis-
Hippo signaling 1.190921 5 2.778 0.064
pathway cussed above. Thus, the expression of MALAT1,
MicroRNAs in 1.179653 7 3.889 0.066
LINC00943 and LINC00261 is increased in melanoma
cancer and may be responsible for the tumorigenesis of
HIF-1 signaling 1.146419 4 2.222 0.071 melanoma.
pathway
Vibrio cholerae 1.020041 3 1.667 0.095 MALAT1 and LINC00943 are independent risk factors for
infection the prognosis of cutaneous melanoma
A univariate Cox regression model for survival analysis
of age, sex and stage was performed, and the results are
shown in Supplementary Table 3. Then, the multivariate
Cox regression model for survival analysis of MALAT1,
Reconstruction of the MALAT1/LINC00943/LINC00261- LINC00943, and LINC00261 was performed. The results
miRNA-mRNA subnetworks showed that the overall survival time and disease-free
MALAT, LINC00943, LINC00261 and their paired survival time of the patients with MALAT1 or
miRNAs and mRNAs were used to reconstruct key LINC00943 CNV deficiency were significantly lower
ceRNA subnetworks. The MALAT1 ceRNA network than those without it, and the difference was significant
consists of 1 lncRNA node, 9 miRNA nodes, 158 (details are shown in Table 8 and Fig. 9a-d), suggesting
mRNA nodes and 209 edges, as shown in Fig. 5a. The that MALAT1 and LINC00943 are independent risk fac-
LINC00943 ceRNA network consists of 1 lncRNA tors for the prognosis of cutaneous melanoma. Although
node, 7 miRNA nodes, 182 mRNA nodes and 209 the overall survival time and disease-free survival time of
edges, as shown in Fig. 6a. The LINC00261 ceRNA patients with LINC00261 deletion were lower than those
network consists of 1 lncRNA node, 5 miRNA nodes, without it, the difference was not significant (p = 0.535,
123 mRNA nodes and 163 edges, as shown in Fig. 7a. p = 0.694) (details are shown in Table 8 and Fig. 9e- f).
The results of functional analysis revealed that 75 GO-
BP, 21 GO-CC, 15 GO-MF and 20 pathways were Discussion
enriched in the MALAT1-miRNA-mRNA subnetwork; In this study, three lncRNAs, MALAT1, LINC00943
67 GO-BP, 14 GO-CC, 17 GO-MF and 13 pathways and LINC00261, were identified according to the
were enriched in the LINC00943-miRNA-mRNA sub- reconstructed ceRNA network. Among these key
network; and 42 GO-BP, 7 GO-CC, 10 GO-MF and 7 lncRNAs found in this study, MALAT1 has been
pathways were enriched in the LINC00261-miRNA- demonstrated to be related to various malignant tu-
mRNA subnetwork. The results of the top 10 signifi- mours [40–44]. Studies have confirmed that MALA
cant GO terms and KEGG pathways of these three T1 is a valuable prognostic marker and a promising
lncRNAs are shown in Fig. 5b-e, Fig. 6b-e, Fig. 7b-e, therapeutic target in lung cancer metastasis [40,
and Tables 5, 6, 7. 41]. A study also suggested that MALAT1 plays anZhu et al. BMC Cancer (2020) 20:927 Page 15 of 20
Table 7 The top significant changes in GO-BP (A), −CC (B), Table 7 The top significant changes in GO-BP (A), −CC (B),
−MF(C) and KEGG pathway (D) according to differentially −MF(C) and KEGG pathway (D) according to differentially
expressed genes in LINC00261-ceRNA sub-network expressed genes in LINC00261-ceRNA sub-network (Continued)
A activity
GO-BP Term Enrichment Count % P-Value transcription regulatory 2.171926 4 3.008 0.007
Score region sequence-specific
DNA binding
positive regulation of 4.294676 19 14.29 < 0.001
transcription from RNA sequence-specific DNA 2.120902 10 7.519 0.008
polymerase II promoter binding
transcription from RNA 3.946596 13 9.774 < 0.001 RNA polymerase II core 2.024814 8 6.015 0.009
polymerase II promoter promoter proximal region
sequence-specific DNA
neuroepithelial cell 3.074302 3 2.256 < 0.001
binding
differentiation
chromatin binding 1.812398 8 6.015 0.015
spinal cord development 3.033527 4 3.008 0.001
RNA polymerase II 1.602367 3 2.256 0.025
neural tube formation 2.951191 3 2.256 0.001 transcription coactivator
inner ear morphogenesis 2.342119 4 3.008 0.005 activity
regulation of protein 2.342119 4 3.008 0.005 N6-methyladenosine- 1.341641 2 1.504 0.046
localization containing RNA binding
regulation of neuron 2.141452 3 2.256 0.007 protein kinase activity 1.042052 6 4.511 0.091
differentiation D
regulation of 2.141452 3 2.256 0.007 KEGG pathway Enrichment Count % P-Value
transforming growth Score
factor beta receptor
signaling pathway PI3K-Akt signaling 1.809894 7 5.263 0.015
pathway
protein stabilization 1.937969 5 3.759 0.012
Oocyte meiosis 1.553469 4 3.008 0.028
fungiform papilla 1.892035 2 1.504 0.013
morphogenesis Platelet activation 1.379399 4 3.008 0.042
stem cell differentiation 1.887589 3 2.256 0.013 Insulin signaling 1.315081 4 3.008 0.048
pathway
regulation of signal 1.799832 3 2.256 0.016
transduction Hippo signaling 1.219786 4 3.008 0.06
pathway
negative regulation of 1.756023 11 8.271 0.018
transcription from RNA Purine metabolism 1.062637 4 3.008 0.087
polymerase II promoter
ErbB signaling 1.024741 3 2.256 0.094
myotome development 1.717328 2 1.504 0.019 pathway
B
GO-CC Term Enrichment Count % P-Value
Score important role in tumour progression and could
nucleus 4.161906 55 41.35 < 0.001 serve as a promising therapeutic target [42].
Through the study of the whole-genome mutational
nucleoplasm 3.062718 32 24.06 < 0.001
landscape and characterization of noncoding and
cytoplasm 3.032352 50 37.59 < 0.001
structural mutations in liver cancer, Fujimoto A.
membrane 2.306958 25 18.8 0.005 and colleagues discovered that MALAT1 is closely
microtubule plus-end 2.297019 3 2.256 0.005 related to liver carcinogenesis. 46 In addition, a study
cytosol 1.228885 29 21.8 0.059 revealed a novel mechanism of MALAT1-regulated
cytoplasmic mRNA 1.060323 3 2.256 0.087 autophagy-related chemoresistance in gastric cancer
processing body [44]. At present, it is believed that MALAT1 is
C mainly responsible for regulating the proliferation,
migration and invasion of tumour cells. According to
GO-MF Term Enrichment Score Count % P-Value
our findings, MALAT1 might also be a crucial factor
transcriptional activator 3.752771 9 6.767 < 0.001
activity, RNA polymerase in the tumorigenesis and development of melanoma.
II core promoter proximal In this subnetwork, we found nine lncRNA-miRNA
region sequence-specific pairs: miRNA-378a-3p, miRNA-23b-3p, miRNA-224-
binding
5p, miRNA-204-5p, miRNA-205-5p, miRNA-200c-3p,
protein binding 2.747245 75 56.39 0.002 miRNA-200b-3p, miRNA-149-5p, and miRNA-211-5p.
protein channel 2.559552 3 2.256 0.003 Among them, MALAT1 was shown to regulateZhu et al. BMC Cancer (2020) 20:927 Page 16 of 20
Fig. 8 The expression level of MALAT1 (a), LINC00943 (b) and LINC00261 (c) in normal skin, adjacent normal skin and melanoma tissues
Table 8 Multivariate COX regression model for overall survival (A) and disease-free survival analysis (B) of MALAT1, LINC00943, and
LINC00261
A
Number of cases, Total Number of cases, Decased Median Months, Overall OR 95%CI p-value
MALAT1
with CNV deficiency 82 53 34.23 0.714 0.524–0.975 0.034
without CNV deficiency 454 243 63.53
LINC00943
with CNV deficiency 54 34 55.59 0.671 0.465–0.969 0.033
without CNV deficiency 482 262 61.05
LINC00261
with CNV deficiency 23 16 17.03 0.612 0.356–1.053 0.076
without CNV deficiency 513 280 61.05
B
Number of cases, Total Number of cases, Decased Median Months, Overall OR 95%CI p-value
MALAT1
with CNV deficiency 84 69 15.52 0.691 0.528–0.906 0.007
without CNV deficiency 448 331 27.09
LINC00943
with CNV deficiency 55 45 21.37 0.704 0.511–0.971 0.033
without CNV deficiency 477 355 24.82
LINC00261
with CNV deficiency 23 19 13.50 0.842 0.516–1.374 0.491
without CNV deficiency 509 381 25.02Zhu et al. BMC Cancer (2020) 20:927 Page 17 of 20 Fig. 9 Multivariate COX regression model for survival analysis of MALAT1 (a, b), LINC00943 (c, d) and LINC00261 (e, f). (This image was generated by SPSS version 22.0) chemoresistance via miRNA-23b-3p sequestration in in melanoma, and it can inhibit uveal melanoma cell gastric cancer [44]. In ovarian cancer, a study sug- proliferation, migration, and invasion by targeting gested that MALAT1-miRNA-211-5p may act as a key PIK3R3/AKT3 [52, 53]. miRNA-204-5p, known as a mediator in the prevention of this disease [45]. MALA tumour suppressor gene in melanoma, was associated T1 is also involved in promoting renal cell carcinoma with the CDKN2A pathway and NRAS gene and con- through interaction with miRNA-205-5p [46]. Studies tributed to BRAF inhibitor resistance [51, 54, 55].. have confirmed that MALAT1 functions in liver and miRNA-205-5p suppresses proliferation and induces lung cancer through miRNA-204-5p [47, 48]. In senescence via regulation of E2F1 in melanoma [51, 56– addition, targeting the MALAT1/miRNA-200c-3p axis 58]. miRNA-200b/c-3p act as potential diagnostic and in a xenograft endometrial carcinoma model strongly prognostic markers for melanoma [59–61]. Upregulation inhibited tumour growth [49]. of miRNA-149-5p, directly regulated by p53, results in Moreover, studies have illustrated that these miRNAs increased expression of Mcl-1 and resistance to apop- are closely related to melanoma in several ways. tosis in melanoma cells [62]. Most importantly, studies miRNA-378a-3p can regulate oncogenic PARVA expres- have confirmed that miRNA-211-5p plays a major role sion in melanoma, preventing its progression [50]. as a tumour suppressor via various targets in melanoma miRNA-23b-3p was shown to be a tumour suppressor [51, 55, 59, 63, 64]. Moreover, MALAT1 is an independ- gene in melanoma [51]. miRNA-224-5p can be regulated ent risk factor for the prognosis of SKCM according to by E2F1 to drive EMT through TXNIP downregulation multivariate Cox regression model analysis. Thus, we
Zhu et al. BMC Cancer   (2020) 20:927                                                                                         Page 18 of 20

believe that MALAT1 may contribute to the tumorigen-              Three of the 16 predicted miRNAs were not asso-
esis and survival of SKCM.                                      ciated with MALAT1, LINC00943 and LINC00261:
  Little is known about LINC00943. According to the             miRNA-21-5p, miRNA-20b-5p and miRNA-424-5p.
LINC00943-miRNA-mRNA subnetwork, miRNA-99a-                     They are closely related to SGMS1.AS1, EPB41L4A.AS1
5p, miRNA-100-5p, miRNA-23b-3p, miRNA-204-5p,                   and SNHG1 according to the ceRNA network. Little is
miRNA-224-5p, miRNA-149-5p and miRNA-125b-5p                    known about miRNA-424-5p in melanoma, while studies
closely interacted with LINC00943. No connection                have suggested that miRNA-20b-5p may inhibit tumour
between LINC00943 and these miRNAs has been discov-             metastasis via regulation of the PAR-1 receptor in melan-
ered yet; however, these miRNAs were also demon-                oma cells [73], and miRNA-21 may regulate melanoma
strated to be associated with melanoma, except miRNA-           cell proliferation, migration, and apoptosis through the
99a-5p. The links between miRNA-204-5p, miRNA-224-              ERK/NF-κB signalling pathway by targeting SPRY1,
5p, miRNA-149-5p and melanoma are discussed above.              PDCD4 and PTEN [74, 75].
In addition, miRNA-23b was suggested as a tumour sup-
pressor gene.54 miRNA-100-5p and miRNA-125b-5p are              Conclusions
associated with resistance to treatment with immune             This study advances our understanding of tumorigenesis
checkpoint inhibitors in melanoma [65]. Additionally,           and development in cutaneous melanoma from the per-
we confirmed that LINC00943 is an independent risk              spective of the ceRNA theory. In addition, MALAT1 and
factor for the prognosis of SKCM. Therefore, under-             LINC00943 may be independent risk factors for the
standing the relationships among LINC00943, miRNAs              prognosis of patients with cutaneous melanoma and
and malignancies may provide further information for            might become predictive molecules for the long-term
future research on melanoma and other malignancies.             treatment of melanoma and potential therapeutic tar-
  Seven KEGG pathways were enriched based on the                gets. Further studies are required to validate the role of
LINC00261 subnetwork. One of these pathways, the                MALAT1, LINC00943 and LINC00261 in cutaneous
PI3K/Akt signalling pathway, has been proven to play a          melanoma.
critical role in tumorigenesis [66], especially in melanoma
[67]. Additionally, a study has demonstrated that               Supplementary information
LINC00261 promotes cancer cell proliferation and metas-         Supplementary information accompanies this paper at https://doi.org/10.
tasis in human choriocarcinoma [68]. However,                   1186/s12885-020-07302-5.
LINC00261 has shown a strong capacity in improving the
chemotherapeutic response and survival of patients with          Additional file 1: Supplementary Table 1. CNV data and patient
                                                                 information from the Skin Cutaneous Melanoma (TCGA, PanCancer Atlas)
oesophageal cancer [69]. In gastric cancer, LINC00261 can        [35] and Metastatic Melanoma (DFCI, Science 2015) [36–38].
suppress tumour metastasis by regulating epithelial-             Additional file 2: Supplementary Table 2. Differentially expressed
mesenchymal transition [70]. Moreover, LINC00261 can             miRNAs in GSE24996、GSE35579、GSE62372.
block cellular proliferation by activating the DNA damage        Additional file 3: Supplementary Table 3. Univariate COX regression
response [71]. LINC00261 may affect the biological behav-        model for survival analysis of age, sex and stage.
iour of different tumours in different ways. Therefore, it is
essential to further explore the role of LINC00261 in dif-      Abbreviations
                                                                ceRNA: Competitive endogenous RNA; SKCM: Skin cutaneous melanoma;
ferent tumours. However, five miRNAs, miRNA-23b-3p,             lncRNA: Long non-coding RNAs; NCBI GEO: National center for
miRNA-211-5p, miRNA-205-5p, miRNA-140-3p and                    biotechnology information gene expression omnibus; GO: Gene ontology;
miRNA-125b-5p, interacted with LINC00261 according to           KEGG: Kyoto encyclopedia of genes and genomes; DAVID: Database for
                                                                annotation, visualization, and integration discovery; MREs: miRNA-response
the LINC00261-miRNA-mRNA subnetwork. Similarly,                 elements; DEMis: Differential expressed miRNAs; DELs: Differential expressed
no connection between LINC00261 and these miR-                  lncRNAs; DEMs: Differential expressed mRNAs; CNV: Copy number variation
NAs has been discovered yet. The roles of miRNA-
23b-3p,       miRNA-211-5p,        miRNA-205-5p,        and     Acknowledgements
                                                                This manuscript is approved by all authors for publication. And we sincerely
miRNA-125b-5p in melanoma are discussed above.                  thank those who help finishing this article.
miRNA-140-3p was reported to be regulated by
MALAT1 in uveal melanoma cells [72]. The multi-                 Authors’ contributions
variate Cox regression model for survival suggested             JY. Z, N. L, F. Z and RZ. C collected the data from GEO and cBioportal
                                                                database; JY. Z and JL. Z analyzed the data; J. W, B. S and SH. Q provided
that LINC00261 was not a risk factor for the prog-              project administration, and resources; and JY. Z, J. D and LJ. Z wrote the
nosis of SKCM, however, the median overall sur-                 paper. All authors have read and approved this manuscript.
vival and disease-free survival time for patients with
LINC00261 CNV deficiency were significantly lower               Funding
                                                                This article is funded by the Science and Technology Program of Guangzhou
than those without LINC00261 CNV deficiency                     (201704020165) and Natural Science Foundation of Guangdong Province
(17.03 m vs 61.05 m, 13.50 vs 25.02).                           (2017A030313619).
Zhu et al. BMC Cancer (2020) 20:927 Page 19 of 20
Availability of data and materials activation screen identifies a lncRNA locus regulating a gene
The data that support results of the present study are available from GEO neighbourhood. Nature. 2017;548(7667):343–6.
datasets (including GSE24996(https://www.ncbi.nlm.nih.gov/ geo/query/ 14. Leucci E, Vendramin R, Spinazzi M, Laurette P, Fiers M, Wouters J, Radaelli E,
acc.cgi?acc = GSE24996),GSE35579(https://www.ncbi.nlm.nih.gov/geo/query/ Eyckerman S, Leonelli C, Vanderheyden K, et al. Melanoma addiction to the
acc.cgi?acc=GSE35579),GSE62372(https://www.ncbi.nlm.nih.gov/geo/query/ long non-coding RNA SAMMSON. Nature. 2016;531(7595):518–22.
acc.cgi?acc=GSE62372), and GSE112509(https://www.ncbi.nlm.nih.gov/geo/ 15. Hosono Y, Niknafs YS, Prensner JR, Iyer MK, Dhanasekaran SM, Mehra R,
query/ acc.cgi?acc = GSE112509)), and cBioportal (http://www.cbioportal.org/ Pitchiaya S, Tien J, Escara-Wilke J, Poliakov A, et al. Oncogenic role of THOR, a
), DAVID (https://david.ncifcrf.gov/), and starbase miRNA-mRNA Interactions conserved Cancer/testis long non-coding RNA. Cell. 2017;171(7):1559–72 e1520.
(http://starbase.sysu.edu.cn/agoClipRNA.php?source=mRNA), and starbase 16. Montes M, Nielsen MM, Maglieri G, Jacobsen A, Hojfeldt J, Agrawal-Singh S,
miRNA-lncRNA Interactions (http://starbase.sysu.edu.cn/agoClipRNA. Hansen K, Helin K, van de Werken HJG, Pedersen JS, et al. The lncRNA
php?source = lncRNA) database. MIR31HG regulates p16(INK4A) expression to modulate senescence. Nat
Commun. 2015;6:6967.
Ethics approval and consent to participate 17. Li P, He J, Yang Z, Ge S, Zhang H, Zhong Q, Fan X. ZNNT1 long noncoding
The study protocol was approved by the Ethics Committee of The First RNA induces autophagy to inhibit tumorigenesis of uveal melanoma by
Affiliated Hospital, Sun Yat-sen University. All patients provided written in- regulating key autophagy gene expression. Autophagy. 2020;16(7):1186–99.
formed consent in compliance with the code of ethics of World Medical As- 18. Jalali S, Bhartiya D, Lalwani MK, Sivasubbu S, Scaria V. Systematic
sociation (Declaration of Helsinki). All the data used in this article were from transcriptome wide analysis of lncRNA-miRNA interactions. PLoS One. 2013;
open assess databases, and no permission was required. 8(2):e53823.
19. Ala U, Karreth FA, Bosia C, Pagnani A, Taulli R, Leopold V, Tay Y, Provero P,
Consent for publication Zecchina R, Pandolfi PP. Integrated transcriptional and competitive
Written informed consent for publication of this article was obtained from endogenous RNA networks are cross-regulated in permissive molecular
patients themselves. environments. Proc Natl Acad Sci U S A. 2013;110(18):7154–9.
20. Salmena L, Poliseno L, Tay Y, Kats L, Pandolfi PP. A ceRNA hypothesis: the
Competing interests Rosetta stone of a hidden RNA language? Cell. 2011;146(3):353–8.
No potential conflict of interest was declared by the authors. 21. Tay Y, Rinn J, Pandolfi PP. The multilayered complexity of ceRNA crosstalk
and competition. Nature. 2014;505(7483):344–52.
Author details 22. Rinn JL, Chang HY. Genome regulation by long noncoding RNAs. Annu Rev
1
Department of Burn, The First Affiliated Hospital, Sun yat-sen University, Biochem. 2012;81:145–66.
Guangzhou, Guangdong 510080, People’s Republic of China. 2Department of 23. Liu XH, Sun M, Nie FQ, Ge YB, Zhang EB, Yin DD, Kong R, Xia R, Lu KH, Li JH, et al.
Radiation Oncology, Cancer Center of Guangzhou Medical University, Lnc RNA HOTAIR functions as a competing endogenous RNA to regulate HER2
Guangzhou, Guangdong 510095, People’s Republic of China. expression by sponging miR-331-3p in gastric cancer. Mol Cancer. 2014;13:92.
24. Zhong Z, Huang M, Lv M, He Y, Duan C, Zhang L, Chen J. Circular RNA
Received: 23 January 2020 Accepted: 16 August 2020 MYLK as a competing endogenous RNA promotes bladder cancer
progression through modulating VEGFA/VEGFR2 signaling pathway. Cancer
Lett. 2017;403:305–17.
References 25. Chang L, Guo R, Yuan Z, Shi H, Zhang D. LncRNA HOTAIR regulates CCND1
1. McGuire S. World Cancer report 2014. Geneva, Switzerland: World Health and CCND2 expression by sponging miR-206 in ovarian Cancer. Cell Physiol
Organization, International Agency for Research on Cancer, WHO press, Biochem. 2018;49(4):1289–303.
2015. Adv Nutr. 2016;7(2):418–9. 26. Edgar R, Domrachev M, Lash AE. Gene expression omnibus: NCBI gene
2. Berwick M, Erdei E, Hay J. Melanoma epidemiology and public health. expression and hybridization array data repository. Nucleic Acids Res. 2002;
Dermatol Clin. 2009;27(2):205–14 viii. 30(1):207–10.
3. Schadendorf D, van Akkooi ACJ, Berking C, Griewank KG, Gutzmer R, 27. Breuer J: R (Software). In., edn.; 2017.
Hauschild A, Stang A, Roesch A, Ugurel S. Melanoma. Lancet. 2018; 28. Smyth GK: limma: Linear Models for Microarray Data. 2005.
392(10151):971–84. 29. Love MI, Huber W, Anders S. Moderated estimation of fold change and
4. Disease GBD, Injury I, Prevalence C. Global, regional, and national incidence, dispersion for RNA-seq data with DESeq2. Genome Biol. 2014;15(12):550.
prevalence, and years lived with disability for 310 diseases and injuries, 30. Li JH, Liu S, Zhou H, Qu LH, Yang JH. starBase v2.0: decoding miRNA-ceRNA,
1990-2015: a systematic analysis for the global burden of Disease study miRNA-ncRNA and protein-RNA interaction networks from large-scale CLIP-
2015. Lancet. 2016;388(10053):1545–602. Seq data. Nucleic Acids Res. 2014;42(Database issue):D92–7.
5. Siegel RL, Miller KD, Jemal A. Cancer statistics, 2020. CA Cancer J Clin. 2020; 31. Liao Q, Liu C, Yuan X, Kang S, Miao R, Xiao H, Zhao G, Luo H, Bu D, Zhao H, et al.
70(1):7–30. Large-scale prediction of long non-coding RNA functions in a coding-non-
6. Burrell RA, McGranahan N, Bartek J, Swanton C. The causes and coding gene co-expression network. Nucleic Acids Res. 2011;39(9):3864–78.
consequences of genetic heterogeneity in cancer evolution. Nature. 2013; 32. Shannon P, Markiel A, Ozier O, Baliga NS, Wang JT, Ramage D, Amin N,
501(7467):338–45. Schwikowski B, Ideker T. Cytoscape: a software environment for integrated
7. Lander ES, Linton LM, Birren B, Nusbaum C, Zody MC, Baldwin J, Devon K, models of biomolecular interaction networks. Genome Res. 2003;13(11):2498–504.
Dewar K, Doyle M, FitzHugh W, et al. Initial sequencing and analysis of the 33. Huang da W, Sherman BT, Lempicki RA. Bioinformatics enrichment tools:
human genome. Nature. 2001;409(6822):860–921. paths toward the comprehensive functional analysis of large gene lists.
8. Yost SE, Smith EN, Schwab RB, Bao L, Jung H, Wang X, Voest E, Pierce JP, Nucleic Acids Res. 2009;37(1):1–13.
Messer K, Parker BA, et al. Identification of high-confidence somatic 34. Huang da W, Sherman BT, Lempicki RA. Systematic and integrative analysis
mutations in whole genome sequence of formalin-fixed breast cancer of large gene lists using DAVID bioinformatics resources. Nat Protoc. 2009;
specimens. Nucleic Acids Res. 2012;40(14):e107. 4(1):44–57.
9. Goodrich JA, Kugel JF. Non-coding-RNA regulators of RNA polymerase II 35. Hoadley KA, Yau C, Hinoue T, Wolf DM, Lazar AJ, Drill E, Shen R, Taylor AM,
transcription. Nat Rev Mol Cell Biol. 2006;7(8):612–6. Cherniack AD, Thorsson V, et al. Cell-of-origin patterns dominate the
10. Yoon JH, Abdelmohsen K, Gorospe M. Posttranscriptional gene regulation molecular classification of 10,000 tumors from 33 types of Cancer. Cell.
by long noncoding RNA. J Mol Biol. 2013;425(19):3723–30. 2018;173(2):291–304 e296.
11. Kiefer JC. Epigenetics in development. Dev Dyn. 2007;236(4):1144–56. 36. Van Allen EM, Miao D, Schilling B, Shukla SA, Blank C, Zimmer L, Sucker
12. Mikkelsen TS, Ku M, Jaffe DB, Issac B, Lieberman E, Giannoukos G, Alvarez P, A, Hillen U, Foppen MHG, Goldinger SM, et al. Genomic correlates of
Brockman W, Kim TK, Koche RP, et al. Genome-wide maps of chromatin response to CTLA-4 blockade in metastatic melanoma. Science. 2015;
state in pluripotent and lineage-committed cells. Nature. 2007;448(7153): 350(6257):207–11.
553–60. 37. Tryka KA, Hao L, Sturcke A, Jin Y, Wang ZY, Ziyabari L, Lee M, Popova N,
13. Joung J, Engreitz JM, Konermann S, Abudayyeh OO, Verdine VK, Aguet F, Sharopova N, Kimura M, et al. NCBI's database of genotypes and
Gootenberg JS, Sanjana NE, Wright JB, Fulco CP, et al. Genome-scale phenotypes: dbGaP. Nucleic Acids Res. 2014;42(Database issue):D975–9.You can also read