REALTY GROWTH Investor Presentation - CTO Realty Growth, Inc.
←
→
Page content transcription
If your browser does not render page correctly, please read the page content below
REALTY GROWTH Investor Presentation
Company Profile
93% 22 2.7M 7.6%
LEASED PROPERTIES SQUARE FEET IMPLIED CAP RATE (1)
OCCUPANCY
$41M $4.90 – $5.15
INVESTMENT IN AFFO PER SHARE GUIDANCE RANGE
ALPINE INCOME PROPERTY TRUST
$351M $283M $75M $677M
EQUITY MARKET CAP(1) OUTSTANDING DEBT SERIES A PREFERRED TOTAL ENTERPRISE VALUE
(Net of Cash)
$4.32/share
Q1 2022 ANNUALIZED
7.4%
CURRENT ANNUALIZED
DIVIDEND (2) DIVIDEND YIELD (2)
The Strand at St. John’s Town Center
Jacksonville, FL
(1) As of February 21, 2022.
(2) Based on $58.50 per share common stock price as of February 23, 2022.
© CTO Realty Growth, Inc. | ctoreit.com 2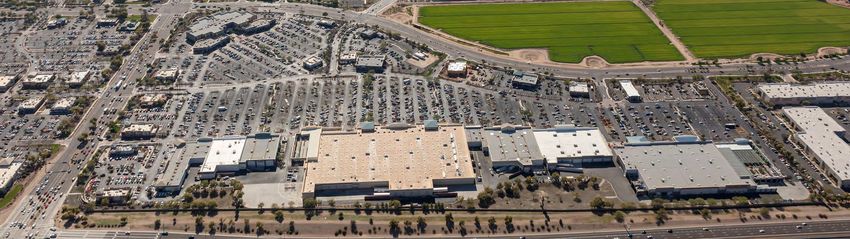
Key Takeaways
Significant Discount to the Peer Group
Meaningful potential upside in valuation as CTO has one of the lowest 2022E AFFO multiple of its primarily retail peer group.

Earnings Growth Through Capital Recycling
Strong, long-term track record of monetizing assets at favorable spreads to drive accretive earnings growth and attractive risk-adjusted returns.

Attractive Dividend and Improving Payout Ratio
CTO has declared a $1.08 quarterly cash dividend, representing a 7.4% in-place annualized yield and a quickly improving AFFO payout ratio (86% based
on the midpoint of 2022 AFFO guidance) driven by the monetization and reinvestment of low cap rate, single tenant properties and non-income
producing assets.

Differentiated Investment Strategy
Retail-based investment strategy focused on grocery-anchored, traditional retail and mixed-use properties with value-add or long-term residual value
opportunities with strong real estate fundamentals in growing markets that can be acquired at meaningful discounts to replacement cost.

High-Quality Portfolio in Faster Growing, Business Friendly Locations with Operational Upside
Recently constructed real estate portfolio with a durable, stable tenant base located in faster growing, business friendly states such as Georgia, Florida,
Texas, Arizona and North Carolina, and with acquired vacancy that represents notable leasing and/or repositioning upside.

Profitable External Investment Management
External management of Alpine Income Property Trust, Inc. (NYSE: PINE), a high-growth, publicly traded, single tenant net lease REIT, provides excellent
in-place cash flow and significant valuation upside through the CTO’s 16% retained ownership position.

Stable and Flexible Balance Sheet
Conservatively levered balance sheet with ample liquidity, no near-term debt maturities and a demonstrated access to multiple capital sources provides
financial stability and flexibility.
 © CTO Realty Growth, Inc. | ctoreit.com                                                                                                                      3

NAV Components
             Net Operating Income of Income Property Portfolio(1)                                                                                                        $44.1                       $44.1                      $44.1    $44.1    $44.1
    ÷        Capitalization Rate                                                                                                                                       6.00%                        6.25%                      6.50%    6.75%    7.00%
                 Income Portfolio Value                                                                                                                               $735.0                       $705.6                      $678.5   $653.3   $630.0
        Other Assets:
             Estimated Value for Subsurface Interests, Loan Portfolio,
    +                                                                                                                                                                    $26.4                       $26.4                      $26.4    $26.4    $26.4
             Mitigation Credits and Other Assets
    +        Cash, Cash Equivalents & Restricted Cash                                                                                                                      31.3                         31.3                     31.3     31.3     31.3
    +        Value of Shares & Units in Alpine Income Property Trust (PINE)                                                                                                41.0                         41.0                     41.0     41.0     41.0
    +        Value of PINE Management Agreement(2)                                                                                                                            8.6                         8.6                     8.6      8.6      8.6
                 Other Assets Value                                                                                                                                   $107.3                       $107.3                      $107.3   $107.3   $107.3
                    Total Implied Asset Value                                                                                                                         $842.3                       $812.9                      $785.8   $760.6   $737.3

    -               Total Debt Outstanding                                                                                                                            $283.0                       $283.0                      $283.0   $283.0   $283.0

    -               Series A Preferred Equity                                                                                                                            $75.0                       $75.0                      $75.0    $75.0    $75.0

Note: 5,968,590 shares outstanding as of February 17, 2022.
(1) Based on in-place net operating income of the existing income property portfolio assets as of December 31, 2021.
(2) Calculated using the trailing 24-month average management fee paid to CTO by PINE as of December 31, 2021, annualized by multiplying by twelve, and then multiplying by three to account for a termination fee multiple.

  © CTO Realty Growth, Inc. | ctoreit.com                                                                                                                                                                                                                 4
Differentiated Investment Strategy
                            CTO has a retail-oriented real estate strategy that focuses on owning, operating and investing in
                                   high-quality properties through direct investment and management structures

Multi-Tenant Asset Strategy                                                                                           Focused Execution
    ▪     Focused on retail-based multi-tenanted assets that have a grocery, lifestyle or community-
          oriented retail component and a complimentary mixed-use component, located in higher
          growth MSAs within the continental United States
                                                                                                              Targeting Multi-Tenant, Retail-Based,
    ▪     Acquisition targets exhibit strong current in-place yields with a future potential for increased
          returns through a combination of vacancy lease-up, redevelopment or rolling in-place leases
                                                                                                             Value-Add Income Property Acquisitions
          to higher market rental rates

Monetization of Non-Income Producing Assets                                                                     Monetize Legacy Mitigation Credits,
    ▪     CTO has a number of legacy non-income producing assets (mitigation credits and mineral                 Mineral Rights and Other Assets
          rights) that when monetized, will unlock meaningful equity to be redeployed into income
          producing assets that can drive higher cash flow and AFFO per share
                                                                                                             Monetize the Retained Net Lease & Office
Alpine Income Property Trust and Retained Net Lease Assets                                                     Portfolio at Opportunistic Valuations
    ▪     CTO seeded and externally manages Alpine Income Property Trust (NYSE: PINE), a pure
          play net lease REIT, which is a meaningful source of management fee income and dividend
          income through its direct investment of REIT shares and OP unit holdings                               Manage and Retain Ownership in
    ▪     CTO intends to monetize its remaining net lease properties at market pricing, creating                   Alpine REIT (NYSE:PINE)
          attractive net investment spreads relative to where it is investing in multi-tenanted assets,
          and resulting in an opportunity to grow PINE through direct asset sales from CTO to PINE
 © CTO Realty Growth, Inc. | ctoreit.com                                                                                                              5
Real Estate Strategy
     CTO’s investment strategy is focused on generating relative outsized returns for our shareholders through a
 combination of accretive acquisitions and dispositions, asset-level value creation, acquiring at meaningful discounts to
                       replacement cost, and sustainably growing organizational level cash flow.

                                                                                                                                 Differentiated asset investment strategy

                                                                                                                                 Primary focus on value-add retail and mixed-use
                                                                                                                                 properties with strong real estate fundamentals

                                                                                                                                 Markets projected to have outsized job and population
              Salt Lake City
            Reno                                                                                                                 growth; states with favorable business climates
                                          Boulder                                                               Washington, DC
                                                    Denver

                      Las Vegas                                                                    Raleigh-Durham
                                                                                                                                 Attractive single tenant asset portfolio identified for
                                                                                                         Charlotte               future disposition to fund new investments
                                                                                   Nashville

                             Phoenix
                                                                                               Atlanta                           Acquiring at meaningful discounts to replacement
                                                                          Dallas
                                                                                                                                 cost and below market rents
                                                                                                           Jacksonville
                                                             Austin
                       CTO Target Market                              Houston
                                                                                                              Orlando            Seek properties with leasing or repositioning upside
                                                                                                Tampa                            or highly stable assets with an identifiable opportunity
                                                                                                                 Miami
                                                                                                                                 to drive long-term, outsized risk-adjusted returns

© CTO Realty Growth, Inc. | ctoreit.com                                                                                                                                                     6
Meaningful Progress with Portfolio Repositioning
Acquisition and Disposition Activity
50000.0% $489 500.0
450.0
2022 AFFO is set to benefit
40000.0% 400.0
from the full-year impact of 2021
$365 transaction activity
350.0
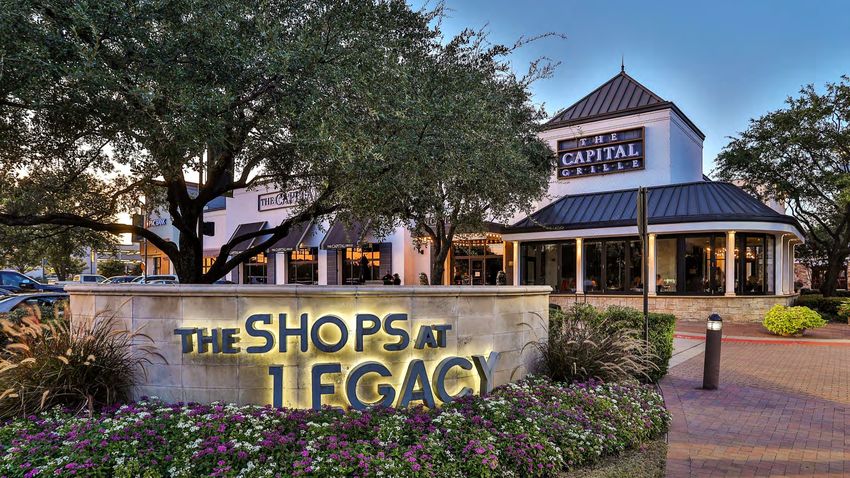
The Shops at Legacy
Cumulative Investment Activity
$305 Plano, TX
30000.0% 300.0
250.0
20000.0% 200.0
150.0
10000.0% 100.0
50.0
0.0% 0.0
(1)
2020 2021 2022 Guidance
Monetization of Non-Core Dispositions Investments
The Shops at Legacy
Legacy Assets Plano, TX
(1) Reflects the midpoint of 2022 Guidance.
© CTO Realty Growth, Inc. | ctoreit.com 7
Durable Portfolio with Growth Opportunities
Recently constructed retail and mixed-use portfolio with a combination of value-add lease up, redevelopment and
stable, in-place cash flows in some of the strongest markets in the United States.
Repositioning Upside Essential Retail Stable Cash Flow
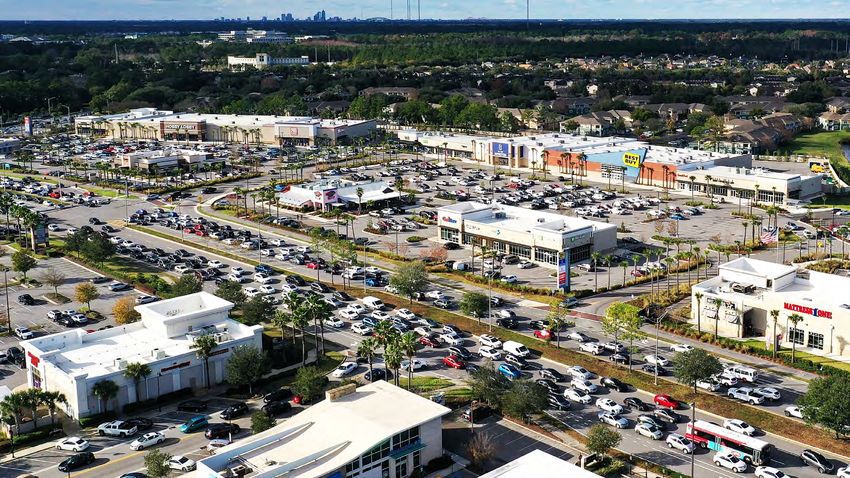
Ashford Lane The Exchange at Gwinnett Crossroads Towne Center
Atlanta, GA Buford, GA Chandler, AZ
125 Lincoln & 150 Washington The Strand at St. John’s Town Center Beaver Creek Crossings
Santa Fe, NM Jacksonville, FL Apex, NC
The Shops at Legacy Westcliff Shopping Center Jordan Landing
Plano, TX Fort Worth, TX West Jordan, UT
© CTO Realty Growth, Inc. | ctoreit.com 8
Strong Demographic Portfolio

       227,000    Portfolio Average
                                                                               $109,900   Portfolio Average
                                                                                                                              1.7%
                                                                                                                          Portfolio Average 2021 - 2026
                                                                                                                                                                                 70%
                                                                                                                                                                           Percentage of Portfolio ABR
                5-Mile Population                (1)
                                                                                     5-Mile Household Income   (1)
                                                                                                                     Projected Annual Population Growth     (1)
                                                                                                                                                                         from ULI’s Top 30 Markets       (1)

                                                                                                                                         Atlanta, GA                                 16%
                                                                                                                                        Jacksonville, FL                             16%
                                                                                                                                          Dallas, TX                                 15%
                                                                                                                                         Raleigh, NC                                 10%
                                                                                                                                         Phoenix, AZ                                 10%
                                                                                                                                       Albuquerque, NM                                7%
                                                                                                                                         Santa Fe, NM                                 4%
                                                                                                                                          Tampa, FL                                  4%
                                                                                                                                      Salt Lake City, UT                              3%
                                                                                                                                          Miami, FL                                   3%
                                                                                                                                       Washington, DC                                 3%
                                                                                                                                        Las Vegas, NV                                 3%
               Income Producing Property                                                                                                  Austin, TX                                  2%
                                                                                                                                       Daytona Beach, FL                              2%
                                                                                                                                         New York, NY                                 1%
                                                                                                                                         Orlando, FL                                  1%
                                                       % of Cash Base Rent By State
                                                                                                                                             Denotes an MSA with over one million people;
                                  > 20%                    10% - 20%             5% - 10%               < 5%                                 Bold denotes a Top 30 ULI Market(2)

Percentages listed based on in-place cash rent..
(1) Source: Esri; Portfolio average weighted by the Annualized Base Rent of each property.
(2) As ranked by Urban Land Institute & PWC in the ‘2022 Emerging Trends in Real Estate’ publication.

  © CTO Realty Growth, Inc. | ctoreit.com                                                                                                                                                                      9
Meaningful Leasing Momentum
                                  New Leases Signed in 2021                                                      Lease Rollover Schedule

                                                                                         20.0%

                                                                                         19.0%                                        19%
                                                                                         18.0%                                                                  17%
                                                                                         17.0%

                                                                                         16.0%

                                                                                         15.0%

                                                                                         14.0%                             14%
                                                                                         13.0%

                                                                                         12.0%

                                                                                   % of ABR Expiring
                                                                                         11.0%

                                                                                         10.0%

                                                                                               9.0%         9%                              9%
                                                                                               8.0%                              7%
                                                                                               7.0%
                                                                                                                      7%
                                                                                               6.0%
                                                                                                       5%                                             5%
       ▪ Q4 2021 Leasing Spreads                  12.3%                                        5.0%
                                                                                                                 4%                              4%
                                                                                               4.0%
                  o       6.4% new lease spreads (excluding acquired vacancy)                  3.0%
                                                                                                                                                           2%
                  o       15.5% option & renewal spreads                                       2.0%

                                                                                               1.0%
       ▪ Leased Occupancy 93%                                                                  0.0%

                  o     Over 400 bps of future occupancy pickup based on current
                        spread between Occupancy and Leased Occupancy

© CTO Realty Growth, Inc. | ctoreit.com                                                                                                                               10
Repositioning – Ashford Lane, Atlanta, GA
THE HALL
Acquired as Perimeter Place in 2020, with
an opportunity to up-tier through targeted
Ashford Lane
lease-up, an improved tenant mix and Atlanta, GA
market repositioning
▪ High barrier-to-entry location with new
residential projects, increasing density and 24-
hour demand
▪ Near southeast corporate headquarters for UPS,
State Farm, First Data, IHG and Mercedes Benz
▪ Daytime population over 126,000 in 3-mile
radius; average household income of $138,000
Ashford Lane Ashford Lane
Atlanta, GA Atlanta, GA
© CTO Realty Growth, Inc. | ctoreit.com 11Repositioning – Ashford Lane, Atlanta, GA
Ashford Lane will incorporate
outdoor seating and eating areas,
along with a number of new green
spaces, including The Lawn, that
will drive a more community-
(Not Owned)
focused experience
THE HALL
(Not Owned)
(Not Owned)
Ashford Lane Ashford Lane
Atlanta, GA Atlanta, GA
© CTO Realty Growth, Inc. | ctoreit.com 12Repositioning – Ashford Lane, Atlanta, GA
Ashford Lane is being repositioned as a higher-end
shopping and dining destination within a growing
and relatively affluent submarket of Atlanta
▪ Opportunity to deliver increased rental rates with
higher-end tenants supported by new multi-family
and office development
▪ Additional green space, outdoor seating and eating
areas will support improved foot traffic and offer
restaurant-focused amenities
▪ Signed 17,000 square foot lease with a food hall
operator who will open in spring 2022
▪ Signed new leases with the following notable tenants
in 2021:
Ashford Lane
Atlanta, GA
© CTO Realty Growth, Inc. | ctoreit.com 13Repositioning – 125 Lincoln & 150 Washington, Santa Fe, NM
Plaza
125 Lincoln & 150 Washington
Santa Fe, NM
125 Lincoln & 150 Washington 125 Lincoln & 150 Washington
Santa Fe, NM Santa Fe, NM
Two-building property with ▪ High barrier-to-entry location with 34% vacancy ▪ Currently negotiating letters of intent and forms
dedicated underground parking in at the time of acquisition of lease with multiple prospective tenants
the heart of Santa Fe, just north of ▪ Immediate repositioning opportunity to drive ▪ Opportunity to add a hospitality or multifamily
the historic Santa Fe Plaza increased cash flow and re-vision the property component by maximizing an existing 9,000
for a higher and better use square foot fourth floor vacancy
© CTO Realty Growth, Inc. | ctoreit.com 14Peer Comparisons
CTO has an outsized dividend yield and very attractive valuation relative to its REIT peer group and
recent retail M&A multiples (KRG/RPAI and KIM/WRI), implying significant valuation upside.
27.0x
2022E AFFO Multiple and Annualized Dividend Yield(1) 27.0x
26.0x
26.0x 26.0x
25.2x 7.50% 7.3% 7.50%
25.0x 25.0x
24.0x 24.0x
23.0x 23.0x
6.50% 6.50%
22.0x 22.0x
21.0x 20.6x 21.0x
20.1x
20.0x
19.7x 20.0x
5.50% 5.50%
19.0x 18.4x 19.0x
18.0x 18.0x
16.9x 4.8%
17.0x 17.0x
16.0x
15.7x 15.7x 4.50%
16.0x 4.50%
4.0% 15.0x
15.0x 15.0x
3.6% 3.7%
14.0x
3.5% 3.5% 3.6% 14.0x
3.4% 3.4% 3.50% 3.50%
13.0x 3.2% 13.0x
12.0x 12.0x
11.8x
11.0x 11.0x
10.0x 10.0x
2.50% 2.50%
AAT FRT UE AKR KIM SITC RPT WSR AHH KRG CTO
(1) All 2022E peer AFFO multiples and dividend yield information are based on the closing stock price on February 18, 2022, using annualized dividends and 2022E FFO per share estimates from the KeyBank The Leaderboard report dated February 18, 2022; CTO’s AFFO multiple and dividend yield is
based on its closing stock price on February 18, 2022, using its Q1 annualized dividend announced on February 23, 2022, and 2022E AFFO per share guidance as included in the Company’s 2022 Guidance.
© CTO Realty Growth, Inc. | ctoreit.comBalance Sheet
Debt Maturities
▪ More than $170 million of $100
existing liquidity(1)
$67 $65
▪ No near-term debt maturities $51
▪ Minimal exposure to floating
interest rates
▪ 100% of CTO’s outstanding 2022 2023 2024 2025 2026 2027
debt is unsecured Unsecured Revolving Credit Facility
(2)
Components of Long-Term Debt Principal Interest Rate Type
▪ 36% net debt-to-total Revolving Credit Facility 67.0 million 30-Day LIBOR + [1.35% – 1.95%] Floating
enterprise value (TEV) 2025 Convertible Senior Notes 51.0 million 3.88% Fixed
2026 Term Loan(3) 65.0 million 30-Day LIBOR + [1.35% – 1.95%] Fixed
▪ 6.1x Net Debt-to-EBITDA 2027 Term Loan(4) 100.0 million 30-Day LIBOR + [1.35% – 1.95%] Fixed
Total Debt $283.0 million
$ and shares outstanding in millions.
(1) Estimated liquidity is through a combination of revolving credit facility availability and existing cash and restricted cash.
(2) Reflects $67.0 million outstanding under the Company’s $210 million senior unsecured revolving credit facility; the Company’s senior unsecured revolving credit facility matures in May 2023 and includes a one-year extension option, subject to satisfaction of certain conditions; the maturity date reflected
assumes the Company exercises the one-year extension option.
(3) The Company utilized interest rate swaps on the $65.0 million 2026 Term Loan balance, including (i) its redesignation of the existing $50.0 million interest rate swap, entered into as of August 31, 2020, and (ii) a $15.0 million interest rate swap effective August 31, 2021, to fix LIBOR and achieve a weighted
average fixed interest rate of 0.35% plus the applicable spread.
(4) The Company utilized interest rate swaps on the $100.0 million 2027 Term Loan balance, including (i) its redesignation of the existing $100.0 million interest rate swap, entered into as of March 31, 2020, and (ii) an additional interest rate swap, effective March 29, 2024, to extend the fixed interest rate
through maturity on January 31, 2027, to fix LIBOR and achieve a fixed interest rate of 0.73% plus the applicable spread.
© CTO Realty Growth, Inc. | ctoreit.com 162022 Guidance
CTO has provided guidance indicating as much as 18% year-over-year AFFO per share growth in 2022.
Low High
Acquisition & Structured Investments $200 - $250
Target Initial Investment Cash Yield 6.25% - 6.75%
Dispositions $40 - $70
Target Disposition Cash Yield 6.50% - 7.50%
Core FFO Per Diluted Share $4.30 - $4.55
AFFO Per Diluted Share $4.90 - $5.15
Weighted Average Diluted
6.1 million - 6.3 million The Exchange at Gwinnett
Shares Outstanding Buford, GA
$ and shares outstanding in millions, except per share data.
© CTO Realty Growth, Inc. | ctoreit.com 17Experienced Management Team
CTO Realty Growth is led by an experienced management team with meaningful shareholder alignment, deep
industry relationships and a strong long-term track record.
John P. Albright Matthew M. Partridge
President & Chief Executive Officer Senior Vice President, Chief Financial Officer & Treasurer
▪ Former Co-Head and Managing Director of Archon Capital, a Goldman ▪ Former Chief Operating Officer and Chief Financial Officer of Hutton;
Sachs Company; Executive Director of Merchant Banking – Investment Executive Vice President, Chief Financial Officer and Secretary of Agree
Management at Morgan Stanley; and Managing Director of Crescent Real Realty Corporation (NYSE: ADC); and Vice President of Finance for
Estate (NYSE: CEI) Pebblebrook Hotel Trust (NYSE: PEB)
Daniel E. Smith Steven R. Greathouse
Senior Vice President, General Counsel & Corporate Secretary Senior Vice President & Chief Investment Officer
▪ Former Vice President and Associate General Counsel of Goldman Sachs ▪ Former Director of Finance for N3 Real Estate; Senior Associate of
& Co. and Senior Vice President and General Counsel of Crescent Real Merchant Banking – Investment Management at Morgan Stanley; and
Estate (NYSE: CEI) Senior Associate at Crescent Real Estate (NYSE: CEI)
Lisa M. Vorakoun Helal A. Ismail
Vice President & Chief Accounting Officer Vice President – Investments
▪ Former Assistant Finance Director for the City of DeLand, Florida and ▪ Former Associate of Jefferies Real Estate Gaming and Lodging
Audit Manager for James Moore & Company, an Accounting and Investment Banking and Manager at B-MAT Homes, Inc.
Consulting Firm
© CTO Realty Growth, Inc. | ctoreit.com 18ESG – Corporate Responsibility
CTO Realty Growth is committed to sustainability, strong corporate governance,
and meaningful corporate social responsibility programs.
Social Responsibility Corporate Governance
▪ Independent Chairman of the Board and 6 of
Inclusive and Supportive Company Culture
7 Directors classified as independent
▪ Dedicated to an inclusive and supportive office environment filled with diverse backgrounds
and perspectives, with a demonstrated commitment to financial, mental and physical wellness ▪ Annual election of all Directors
▪ Annual Board of Director evaluations
Notable Community Outreach
▪ Board oversees risk assessment/management,
▪ Numerous and diverse community outreach programs, supporting environmental, artistic, civil with oversight for specific areas of risk
and social organizations in the community delegated to Board committees
▪ Stock ownership requirements for all
Executive Management and Directors
▪ Prohibition against hedging and pledging
CTO Realty Growth stock
▪ Robust policies and procedures for approval of
related party transactions
▪ All team members adhere to a comprehensive
Code of Business Conduct and Ethics policy
© CTO Realty Growth, Inc. | ctoreit.com 19ESG – Environmental Responsibility
Environmental Responsibility
Committed Focus & Targeted Investment
▪ Committed to maintaining an environmentally conscious culture, the
utilization of environmentally friendly & renewable products, and the
promotion of sustainable business practices. Notable achievements:
o Formed a conservation mitigation bank on approximately 2,500
acres of land, resulting in the land being barred from
development permanently preserved
o Invested in LED lighting, recycling and waste reduction
strategies, programmable thermostats, energy management Over the past nine years,
systems in our office and/or at our owned properties CTO has planted
approximately 170,000
o Conveyed over 11,000 acres of land to the State of Florida to pine trees in Florida and
significantly enlarge the neighboring Tiger Bay State Forest has restored over 700
acres of former industrial
Tenant Alignment timberland. These
170,000 trees absorb
▪ Alignment with environmentally aware tenants who have strong
more than 1,000 tons of
sustainability programs and initiatives embedded into their corporate
carbon each year.
culture and business practices
© CTO Realty Growth, Inc. | ctoreit.com 20NYSE: CTO
Appendix
The Shops at Legacy
Plano, TXSchedule of Properties
Property
Property Market Asset Type Square Feet Occupancy % of Cash ABR
Type
The Shops at Legacy – Plano, TX Dallas, TX Multi-Tenant Mixed Use 236,867 85% 14%
Ashford Lane – Atlanta, GA Atlanta, GA Multi-Tenant Retail 285,052 71% 12%
Beaver Creek Crossings – Apex, NC Raleigh, NC Multi-Tenant Retail 320,732 90% 10%
Crossroads Towne Center – Chandler, AZ Phoenix, AZ Multi-Tenant Retail 244,711 99% 10%
The Strand – Jacksonville, FL Jacksonville, FL Multi-Tenant Retail 204,552 93% 9%
Fidelity – Albuquerque, NM Albuquerque, NM Single Tenant Office 210,067 100% 7%
245 Riverside – Jacksonville, FL Jacksonville, FL Multi-Tenant Office 136,853 77% 5%
125 Lincoln & 150 Washington - Santa Fe, NM Santa Fe, NM Multi-Tenant Mixed Use 136,638 66% 4%
The Exchange at Gwinnett - Buford, GA Atlanta, GA Multi-Tenant Retail 69,265 90% 4%
Sabal Pavilion – Tampa, FL Tampa, FL Single Tenant Office 120,500 100% 4%
Jordan Landing – West Jordan, UT Salt Lake City, UT Multi-Tenant Retail 170,996 100% 3%
Blue shading denotes a ground lease property or a property that has parcels that are ground leased, where the Company owns the land, and the tenant owns the building and the improvements and leases the land from the Company.
© CTO Realty Growth, Inc. | ctoreit.com 22Schedule of Properties
Property
Property Market Asset Type Square Feet Occupancy % of ABR
Type
Westland Gateway Plaza – Hialeah, FL Miami, FL Multi-Tenant Retail 108,029 100% 3%
General Dynamics – Reston, VA Washington, DC Single Tenant Office 64,319 100% 3%
Eastern Commons – Henderson, NV Las Vegas, NV Multi-Tenant Retail 133,304 96% 3%
The Carpenter Hotel – Austin, TX Austin, TX Single Tenant Hospitality 73,508 100% 2%
Landshark Bar & Grill – Daytona Beach, FL Daytona Beach, FL Single Tenant Retail 6,264 100% 1%
Westcliff Center – Fort Worth, TX Dallas, TX Multi-Tenant Retail 136,185 60% 1%
Party City – Oceanside, NY New York, NY Single Tenant Retail 15,500 100% 1%
Chuy’s – Jacksonville, FL Jacksonville, FL Single Tenant Retail 7,950 100% < 1%
369 N. New York Ave – Winter Park, FL Orlando, FL Multi-Tenant Mixed Use 28,008 100% < 1%
Firebirds – Jacksonville, FL Jacksonville, FL Single Tenant Retail 6,948 100% < 1%
Crabby’s Oceanside – Daytona Beach, FL Daytona Beach, FL Single Tenant Retail 5,780 100% < 1%
Blue shading denotes a ground lease property or a property that has parcels that are ground leased, where the Company owns the land, and the tenant owns the building and the improvements and leases the land from the Company.
© CTO Realty Growth, Inc. | ctoreit.com 23The Shops at Legacy, Plano, TX © CTO Realty Growth, Inc. | ctoreit.com 24
Ashford Lane, Atlanta, GA

© CTO Realty Growth, Inc. | ctoreit.com   25
Beaver Creek Crossings, Apex, NC

© CTO Realty Growth, Inc. | ctoreit.com   26
Crossroads Town Center, Chandler, AZ

© CTO Realty Growth, Inc. | ctoreit.com   27
The Strand, Jacksonville, FL

© CTO Realty Growth, Inc. | ctoreit.com   28
125 Lincoln & 150 Washington, Santa Fe, NM

© CTO Realty Growth, Inc. | ctoreit.com      29
The Carpenter Hotel, Austin, TX (Ground Lease)

© CTO Realty Growth, Inc. | ctoreit.com          30
The Exchange at Gwinnett, Buford, GA

© CTO Realty Growth, Inc. | ctoreit.com   31
Jordan Landing, West Jordan, UT

© CTO Realty Growth, Inc. | ctoreit.com   32
Eastern Commons, Henderson, NV

© CTO Realty Growth, Inc. | ctoreit.com   33
Forward Looking Statements & Non-GAAP Financial Measures
Certain statements contained in this presentation (other than statements of historical fact) are forward-looking statements within the meaning of Section 27A of the Securities Act of 1933, as amended and Section 21E of the Securities Exchange Act of
1934, as amended. Forward-looking statements can typically be identified by words such as “believe,” “estimate,” “expect,” “intend,” “anticipate,” “will,” “could,” “may,” “should,” “plan,” “potential,” “predict,” “forecast,” “project,” and similar expressions,
as well as variations or negatives of these words.

Although forward-looking statements are made based upon management’s present expectations and reasonable beliefs concerning future developments and their potential effect upon the Company, a number of factors could cause the Company’s actual
results to differ materially from those set forth in the forward-looking statements. Such factors may include, but are not limited to: the Company’s ability to remain qualified as a REIT; the Company’s exposure to U.S. federal and state income tax law
changes, including changes to the REIT requirements; general adverse economic and real estate conditions; the ultimate geographic spread, severity and duration of pandemics such as the COVID-19 Pandemic, actions that may be taken by governmental
authorities to contain or address the impact of such pandemics, and the potential negative impacts of such pandemics on the global economy and the Company’s financial condition and results of operations; the inability of major tenants to continue
paying their rent or obligations due to bankruptcy, insolvency or a general downturn in their business; the loss or failure, or decline in the business or assets of PINE; the completion of 1031 exchange transactions; the availability of investment properties
that meet the Company’s investment goals and criteria; the uncertainties associated with obtaining required governmental permits and satisfying other closing conditions for planned acquisitions and sales; and the uncertainties and risk factors discussed
in the Company’s Annual Report on Form 10-K for the fiscal year ended December 31, 2021 and other risks and uncertainties discussed from time to time in the Company’s filings with the U.S. Securities and Exchange Commission.

There can be no assurance that future developments will be in accordance with management’s expectations or that the effect of future developments on the Company will be those anticipated by management. Readers are cautioned not to place undue
reliance on these forward-looking statements, which speak only as of the date of this presentation. The Company undertakes no obligation to update the information contained in this press release to reflect subsequently occurring events or circumstances.

Non-GAAP Financial Measures

Our reported results are presented in accordance with accounting principles generally accepted in the United States of America (“GAAP”). We also disclose Funds From Operations (“FFO”), Core Funds From Operations (“Core FFO”), Adjusted Funds
From Operations (“AFFO”), and Pro Forma Earnings Before Interest, Taxes, Depreciation and Amortization (“Pro Forma EBITDA”), each of which are non-GAAP financial measures. We believe these non-GAAP financial measures are useful to investors
because they are widely accepted industry measures used by analysts and investors to compare the operating performance of REITs.

FFO, Core FFO, AFFO, and Pro Forma EBITDA do not represent cash generated from operating activities and are not necessarily indicative of cash available to fund cash requirements; accordingly, they should not be considered alternatives to net
income as a performance measure or cash flows from operating activities as reported on our statement of cash flows as a liquidity measure and should be considered in addition to, and not in lieu of, GAAP financial measures.

We compute FFO in accordance with the definition adopted by the Board of Governors of the National Association of Real Estate Investment Trusts, or NAREIT. NAREIT defines FFO as GAAP net income or loss adjusted to exclude extraordinary items
(as defined by GAAP), net gain or loss from sales of depreciable real estate assets, impairment write-downs associated with depreciable real estate assets and real estate related depreciation and amortization, including the pro rata share of such
adjustments of unconsolidated subsidiaries. The Company also excludes the gains or losses from sales of assets incidental to the primary business of the REIT which specifically include the sales of mitigation credits, impact fee credits, subsurface sales,
and land sales. To derive Core FFO, we modify the NAREIT computation of FFO to include other adjustments to GAAP net income related to gains and losses recognized on the extinguishment of debt. To derive AFFO, we further modify the NAREIT
computation of FFO and Core FFO to include other adjustments to GAAP net income related to non-cash revenues and expenses such as straight-line rental revenue, amortization of above- and below-market lease related intangibles, non-cash
compensation, and other non-cash amortization. Such items may cause short-term fluctuations in net income but have no impact on operating cash flows or long-term operating performance. We use AFFO as one measure of our performance when we
formulate corporate goals.

To derive Pro Forma EBITDA, GAAP net income or loss is adjusted to exclude extraordinary items (as defined by GAAP), net gain or loss from sales of depreciable real estate assets, impairment write-downs associated with depreciable real estate assets
and real estate related depreciation and amortization, including the pro rata share of such adjustments of unconsolidated subsidiaries, non-cash revenues and expenses such as straight-line rental revenue, amortization of deferred financing costs, above-
and below-market lease related intangibles, non-cash compensation, and other non-cash income or expense. Cash interest expense is also excluded from Pro Forma EBITDA, and GAAP net income or loss is adjusted for the annualized impact of
acquisitions, dispositions and other similar activities.

FFO is used by management, investors and analysts to facilitate meaningful comparisons of operating performance between periods and among our peers primarily because it excludes the effect of real estate depreciation and amortization and net gains
or losses on sales, which are based on historical costs and implicitly assume that the value of real estate diminishes predictably over time, rather than fluctuating based on existing market conditions. We believe that Core FFO and AFFO are additional
useful supplemental measures for investors to consider because they will help them to better assess our operating performance without the distortions created by other non-cash revenues or expenses. We also believe that Pro Forma EBITDA is an
additional useful supplemental measure for investors to consider as it allows for a better assessment of our operating performance without the distortions created by other non-cash revenues, expenses or certain effects of the Company’s capital structure
on our operating performance. FFO, Core FFO, AFFO, and Pro Forma EBITDA may not be comparable to similarly titled measures employed by other companies.

  © CTO Realty Growth, Inc. | ctoreit.com                                                                                                                                                                                                                      34
References & Contacts
References and terms used in this presentation that are in addition to terms defined in the Non-GAAP Financial Measures include:

 ▪    This presentation is as of February 24, 2022.
 ▪    All information is as of December 31, 2021, unless otherwise noted.
 ▪    Any calculation differences are assumed to be a result of rounding.
 ▪    “2022 Guidance” is based on the 2022 Outlook provided in the Company’s Fourth Quarter and Full Year 2021 Operating Results press release filed on February 24, 2022.
 ▪    “Alpine” or “PINE” refers to Alpine Income Property Trust, a publicly traded net lease REIT traded on the New York Stock Exchange under the ticker symbol PINE.
 ▪    “Annualized Straight-line Base Rent”, “ABR” or “Rent” and the statistics based on ABR are calculated based on our current portfolio and represent straight-line rent calculated in accordance with GAAP.
 ▪    “2022 Net Operating Income” or “2022 NOI” is budgeted 2022 property-level net operating income based on the Company’s portfolio as of December 31, 2021, plus the annualized current quarterly dividend
      and management fees from PINE based on the Company’s PINE ownership as of December 31, 2021
 ▪    “Credit Rated” is a tenant or the parent of a tenant with a credit rating from S&P Global Ratings, Moody’s Investors Service, Fitch Ratings or the National Associated of Insurance Commissioners (NAIC)
      (together, the “Major Rating Agencies”). An “Investment Grade Rated Tenant” or “IG” references a Credit Rated tenant or the parent of a tenant, or credit rating thereof with a rating of BBB-, Baa3 or NAIC-2
      or higher from one or more of the Major Rating Agencies.
 ▪    “Contractual Base Rent” or “CBR” represents the amount owed to the Company under the terms of its lease agreements at the time referenced.
 ▪    “Dividend” or “Dividends”, subject to the required dividends to maintain our qualification as a REIT, are set by the Board of Directors and declared on a quarterly basis and there can be no assurances as to
      the likelihood or number of dividends in the future.
 ▪    “Investment in Alpine Income Property Trust” or “Alpine Investment” or “PINE Ownership” is calculated based on the 2,047,732 common shares and partnership units CTO owns in PINE and is based on
      PINE’s closing stock price.
 ▪    “Leased Occupancy” refers to space that is currently leased but for which rent payments have not yet commenced.
 ▪    “MSA” or “Metropolitan Statistical Area” is a region that consists of a city and surrounding communities that are linked by social and economic factors, as established by the U.S. Office of Management and
      Budget. The names of the MSA have been shortened for ease of reference.
 ▪    “Net Debt” is calculated as our total long-term debt as presented on the face of our balance sheet; plus financing costs, net of accumulated amortization and unamortized convertible debt discount; less cash,
      restricted cash and cash equivalents.
 ▪    “Net Operating Income” or “NOI” is revenues from all income properties less operating expense, maintenance expense, real estate taxes and rent expense.
 ▪    “Total Enterprise Value” is calculated as the Company’s Total Common Shares Outstanding multiplied by the common stock price; plus the par value of the Series A perpetual preferred equity outstanding and
      Net Debt.
 ▪    “Total Common Shares Outstanding” equaled 5,916,226 shares.

Investor Inquiries:                            Matthew M. Partridge
                                               Senior Vice President, Chief Financial Officer and Treasurer
                                               (407) 904-3324
                                               mpartridge@ctoreit.com

     © CTO Realty Growth, Inc. | ctoreit.com                                                                                                                                                                            35
Non-GAAP Financial Measures Reconciliation
CTO Realty Growth, Inc.
Consolidated Statements of Operations
(Unaudited, in thousands, except share, per share and dividend data)
Three Months Ended Year Ended
December 31, 2021 December 31, 2020 December 31, 2021 December 31, 2020
Revenues
Income Properties $ 13,922 $ 14,544 $ 50,679 $ 49,953
Management Fee Income 944 664 3,305 2,744
Interest Income from Commercial Loan and Master Lease Investments 725 734 2,861 3,034
Real Estate Operations 9,109 19 13,427 650
Total Revenues 24,700 15,961 70,272 56,381
Direct Cost of Revenues
Income Properties (4,127) (3,715) (13,815) (11,988)
Real Estate Operations (7,748) 40 (8,615) (3,223)
Total Direct Cost of Revenues (11,875) (3,675) (22,430) (15,211)
General and Administrative Expenses (2,725) (2,963) (11,202) (11,567)
Impairment Charges (1,072) (7,242) (17,599) (9,147)
Depreciation and Amortization (5,153) (4,729) (20,581) (19,063)
Total Operating Expenses (20,825) (18,609) (71,812) (54,988)
Gain on Disposition of Assets 210 2,381 28,316 9,746
Gain (Loss) on Extinguishment of Debt (2,790) — (3,431) 1,141
Other Gains and Income (Loss) (2,580) 2,381 24,885 10,887
Total Operating Income (Loss) 1,295 (267) 23,345 12,280
Investment and Other Income (Loss) 4,007 (686) 12,445 (6,432)
Interest Expense (2,078) (2,454) (8,929) (10,838)
Income (Loss) from Operations Before Income Tax Benefit (Expense) 3,224 (3,407) 26,861 (4,990)
Income Tax Benefit (Expense) (1,292) 83,089 3,079 83,499
Net Income Attributable to the Company $ 1,932 $ 79,682 $ 29,940 $ 78,509
Distributions to Preferred Stockholders (1,196) — (2,325) —
Net Income Attributable to Common Stockholders $ 736 $ 79,682 $ 27,615 $ 78,509
Per Share Information:
Basic and Diluted Net Income Attributable to Common Stockholders $ 0.13 $ 16.60 $ 4.69 $ 16.69
Weighted Average Number of Common Shares:
Basic 5,890,398 4,799,668 5,892,270 4,704,877
Diluted 5,890,398 4,799,668 5,892,270 4,704,877
Dividends Declared and Paid – Common Stock $ 1.00 $ 12.98 $ 4.00 $ 13.88
Dividends Declared and Paid – Preferred Stock $ 0.40 $ — $ 0.77 $ —
© CTO Realty Growth, Inc. | ctoreit.com 36Non-GAAP Financial Measures Reconciliation
CTO Realty Growth, Inc.
Non-GAAP Financial Measures
(Unaudited, in thousands, except per share data)
Three Months Ended Year Ended
December 31, 2021 December 31, 2020 December 31, 2021 December 31, 2021
Net Income Attributable to the Company $ 1,932 $ 79,682 $ 29,940 $ 78,509
Depreciation and Amortization 5,153 4,729 20,581 19,063
Gains on Disposition of Assets (210) (2,381) (28,316) (9,746)
Losses (Gains) on the Disposition of Other Assets (1,375) (60) (4,924) 2,480
Impairment Charges, Net 809 7,242 13,283 9,147
Unrealized (Gain) Loss on Investment Securities (3,446) 1,142 (10,340) 8,240
Income Tax Expense (Benefit) from Non-FFO Items and
De-Recognition of REIT Deferred Tax Assets and Liabilities 1,840 (80,225) 1,840 (80,225)
Funds from Operations $ 4,703 $ 10,129 $ 22,064 $ 27,468
Distributions to Preferred Stockholders (1,196) — (2,325) —
Funds from Operations Attributable to Common Stockholders $ 3,507 $ 10,129 $ 19,739 $ 27,468
Loss (Gain) on Extinguishment of Debt 2,790 — 3,431 (1,141)
Core Funds from Operations Attributable to Common Stockholders $ 6,297 $ 10,129 $ 23,170 $ 26,327
Adjustments:
Straight-Line Rent Adjustment (599) (754) (2,443) (2,564)
COVID-19 Rent Repayments (Deferrals), Net 104 363 842 (1,005)
Amortization of Intangibles to Lease Income 416 (402) (404) (1,754)
Other Non-Cash Amortization (149) (229) (676) (834)
Amortization of Loan Costs and Discount on Convertible Debt 469 428 1,864 1,833
Non-Cash Compensation 734 651 3,168 2,786
Non-Recurring G&A — 371 155 1,426
Adjusted Funds from Operations Attributable to Common Stockholders $ 7,272 $ 10,557 $ 25,676 $ 26,215
FFO per common share – diluted $ 0.60 $ 2.11 $ 3.35 $ 5.84
Core FFO per common share – diluted $ 1.07 $ 2.11 $ 3.93 $ 5.60
AFFO per common share – diluted $ 1.23 $ 2.20 $ 4.36 $ 5.57
© CTO Realty Growth, Inc. | ctoreit.com 37Non-GAAP Financial Measures Reconciliation
CTO Realty Growth, Inc.
Non-GAAP Financial Measures
Reconciliation of Net Debt to Pro Forma EBITDA
(Unaudited, in thousands) Three Months Ended
December 31, 2021
Net Income Attributable to the Company $ 1,932
Depreciation and Amortization 5,153
Gains on Disposition of Assets (210)
Gains on the Disposition of Other Assets (1,375)
Impairment Charges, Net 809
Unrealized Gain on Investment Securities (3,446)
Income Tax Expense (Benefit) from Non-FFO Items and
De-Recognition of REIT Deferred Tax Assets and Liabilities 1,840
Distributions to Preferred Stockholders (1,196)
Loss on Extinguishment of Debt 2,790
Straight-Line Rent Adjustment (599)
Amortization of Intangibles to Lease Income 416
Other Non-Cash Amortization (149)
Amortization of Loan Costs and Discount on Convertible Debt 469
Non-Cash Compensation 734
Interest Expense, Net of Amortization of Loan Costs and Discount on Convertible Debt 1,609
EBITDA $ 8,777
Annualized EBITDA $ 35,108
Pro Forma Annualized Impact of Current Quarter Acquisitions and Dispositions, Net (1) 6,214
Pro Forma EBITDA $ 41,322
Total Long-Term Debt 278,273
Financing Costs, Net of Accumulated Amortization 1,196
Unamortized Convertible Debt Discount 3,565
Cash & Cash Equivalents (8,615)
Restricted Cash (22,734)
Net Debt $ 251,685
Net Debt to Pro Forma EBITDA 6.1x
(1) Reflects the pro forma annualized impact on Annualized EBITDA of the Company’s acquisition and disposition activity during the three months ended December 31, 2021.
© CTO Realty Growth, Inc. | ctoreit.com 38REALTY GROWTH Crabby’s Oceanside & Landshark Bar and Grill Daytona Beach, FL
You can also read